Copyright
©The Author(s) 2022.
World J Stem Cells. Aug 26, 2022; 14(8): 616-632
Published online Aug 26, 2022. doi: 10.4252/wjsc.v14.i8.616
Published online Aug 26, 2022. doi: 10.4252/wjsc.v14.i8.616
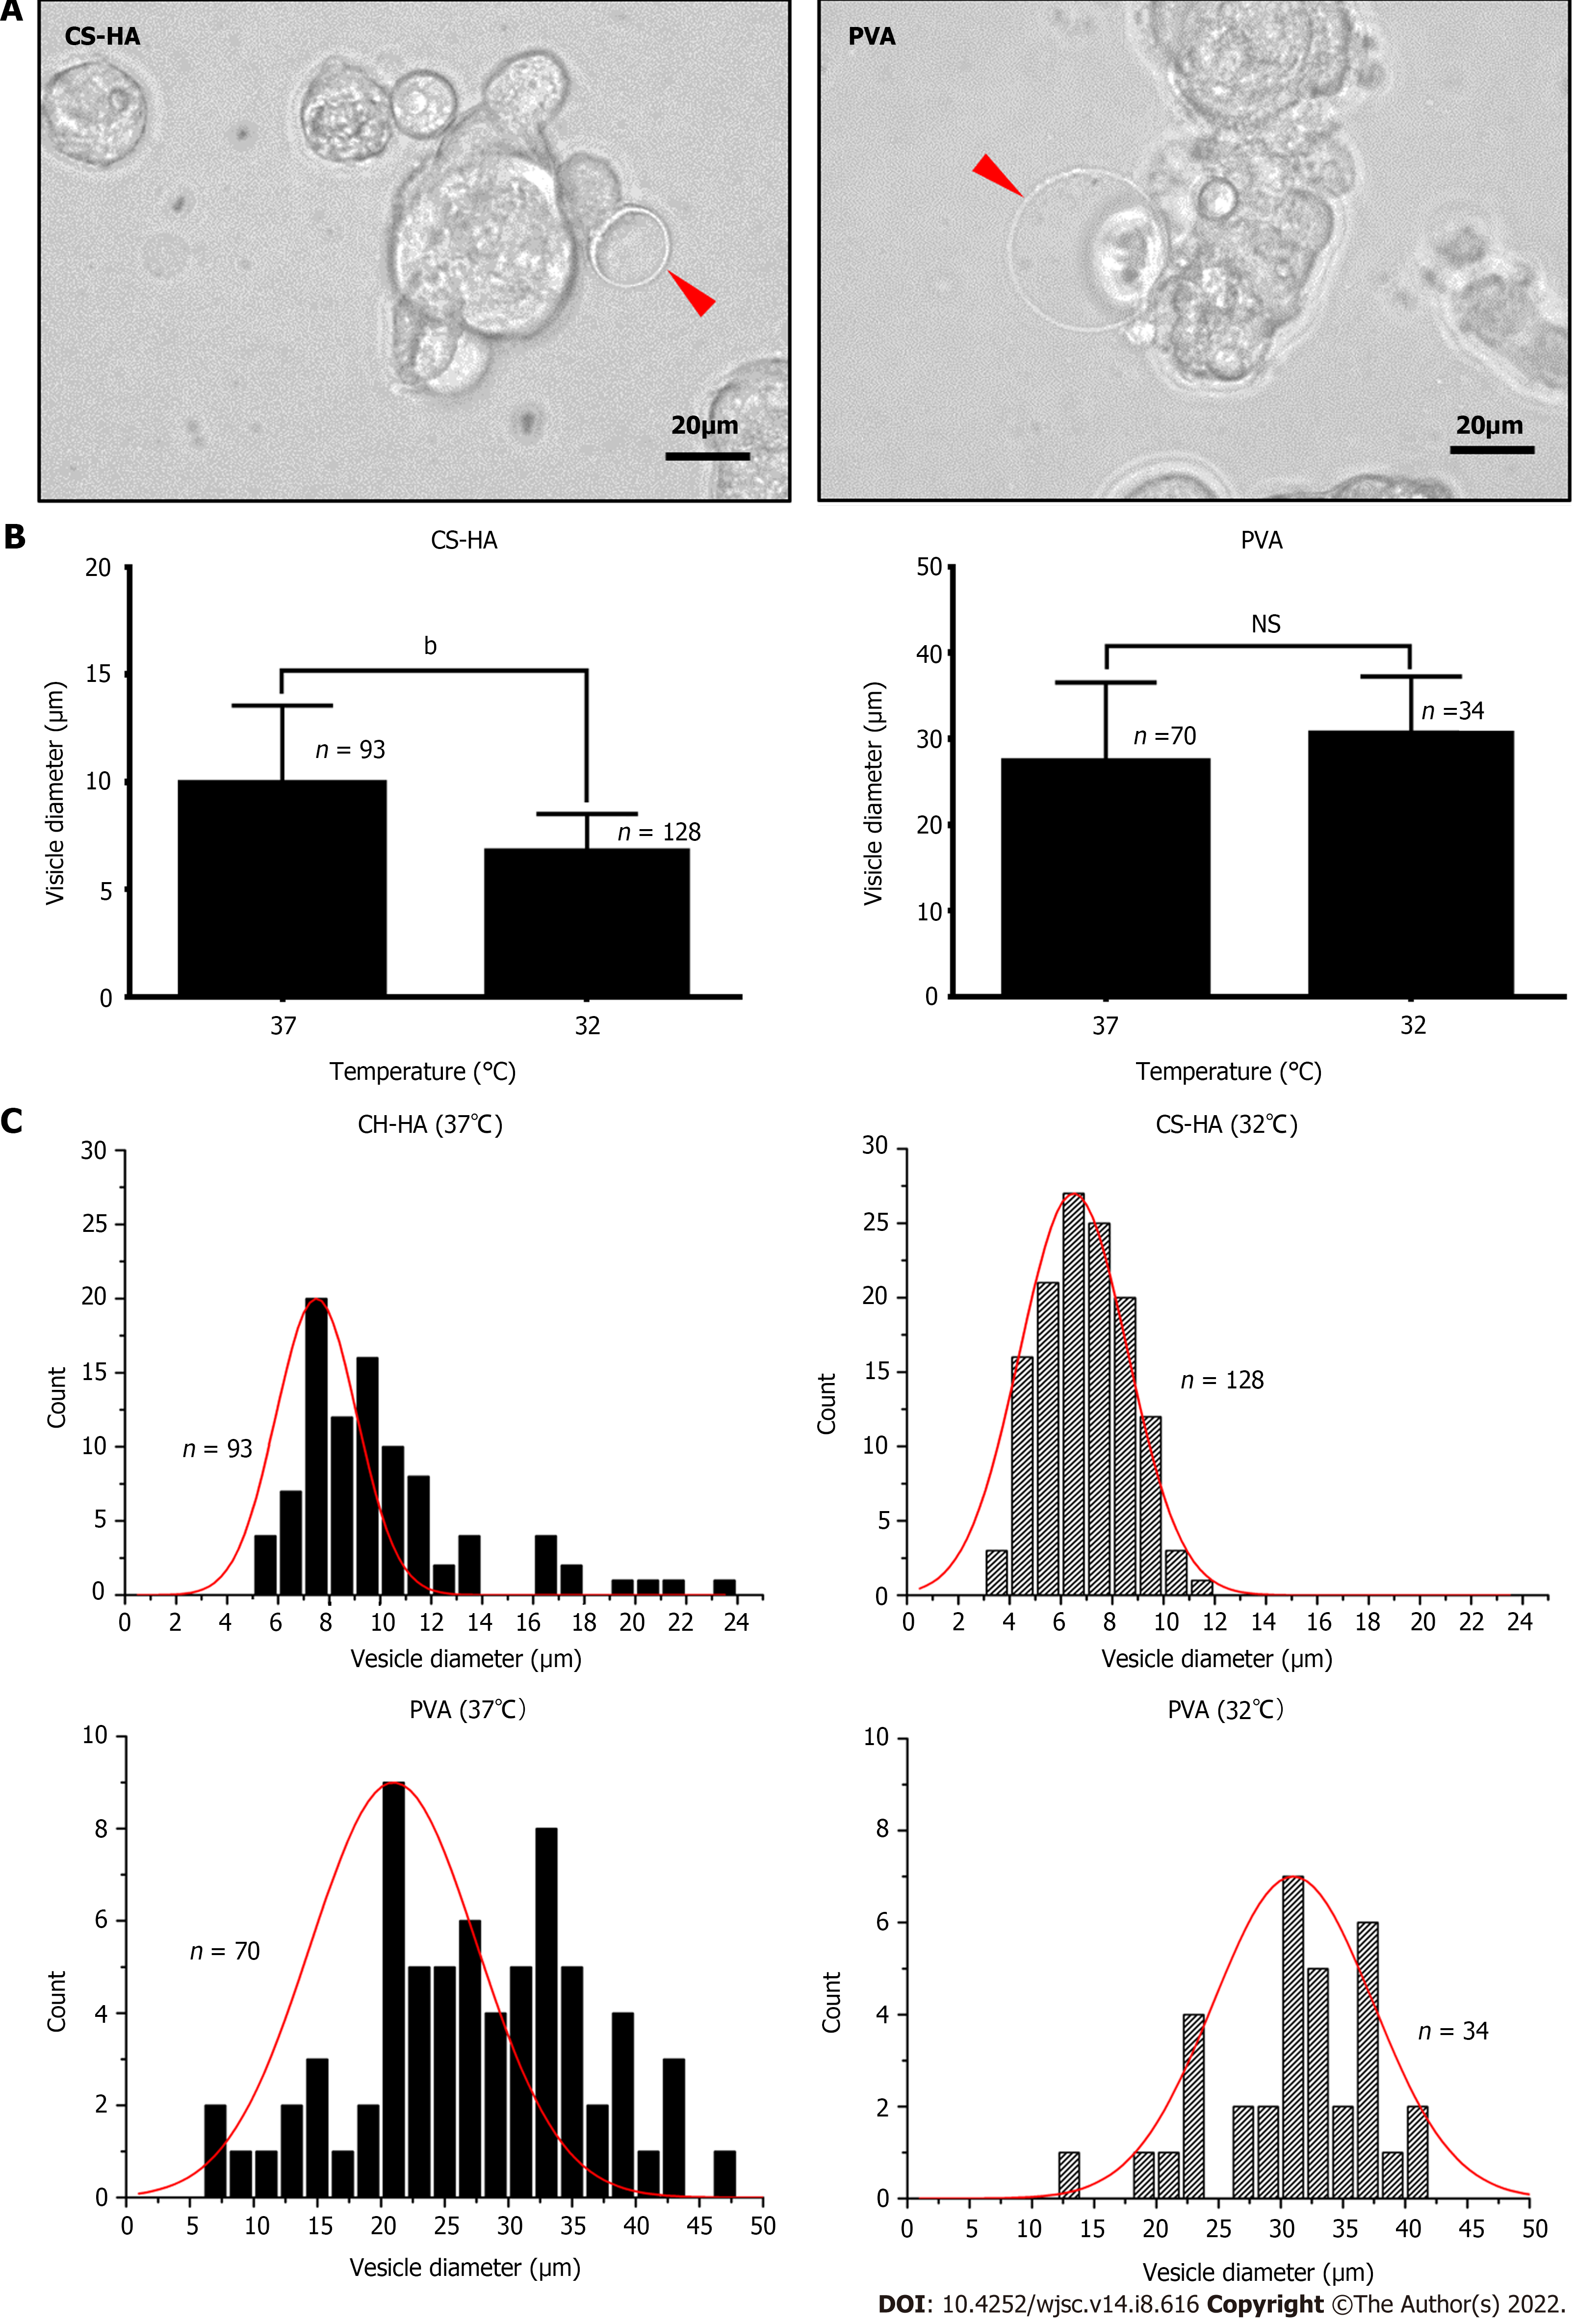
Figure 1 The morphologies of vesicle-like bubbles on the cell membrane of the spheroids of mesenchymal stem cells cultured on chitosan-hyaluronan or polyvinyl alcohol substrates.
A: Representative spheroids from cells cultured on chitosan-hyaluronan (CS-HA) substrates for 15 h are shown. The vesicle-like bubbles are indicated by red arrows. The scale bar represent 20 μm; B: The average diameter of the vesicle-like bubbles was measured and compared between different temperatures. Statistical significance was tested using the GraphPad Prim unpaired t-test. bP < 0.01; C: The frequency distribution histogram of vesicle-like bubbles diameter on the cell membrane for mesenchymal stem cells cultured on CS-HA or polyvinyl alcohol substrates at 37 °C or 32 °C. The frequency distribution histogram was obtained through the Gauss-amp fitting curve. n: Number of measured vesicle-like bubbles; PVA: Polyvinyl alcohol; MSCs: Mesenchymal stem cells; NS: Non-significant differences; CS: Chitosan; CS-HA: CS-hyaluronan.
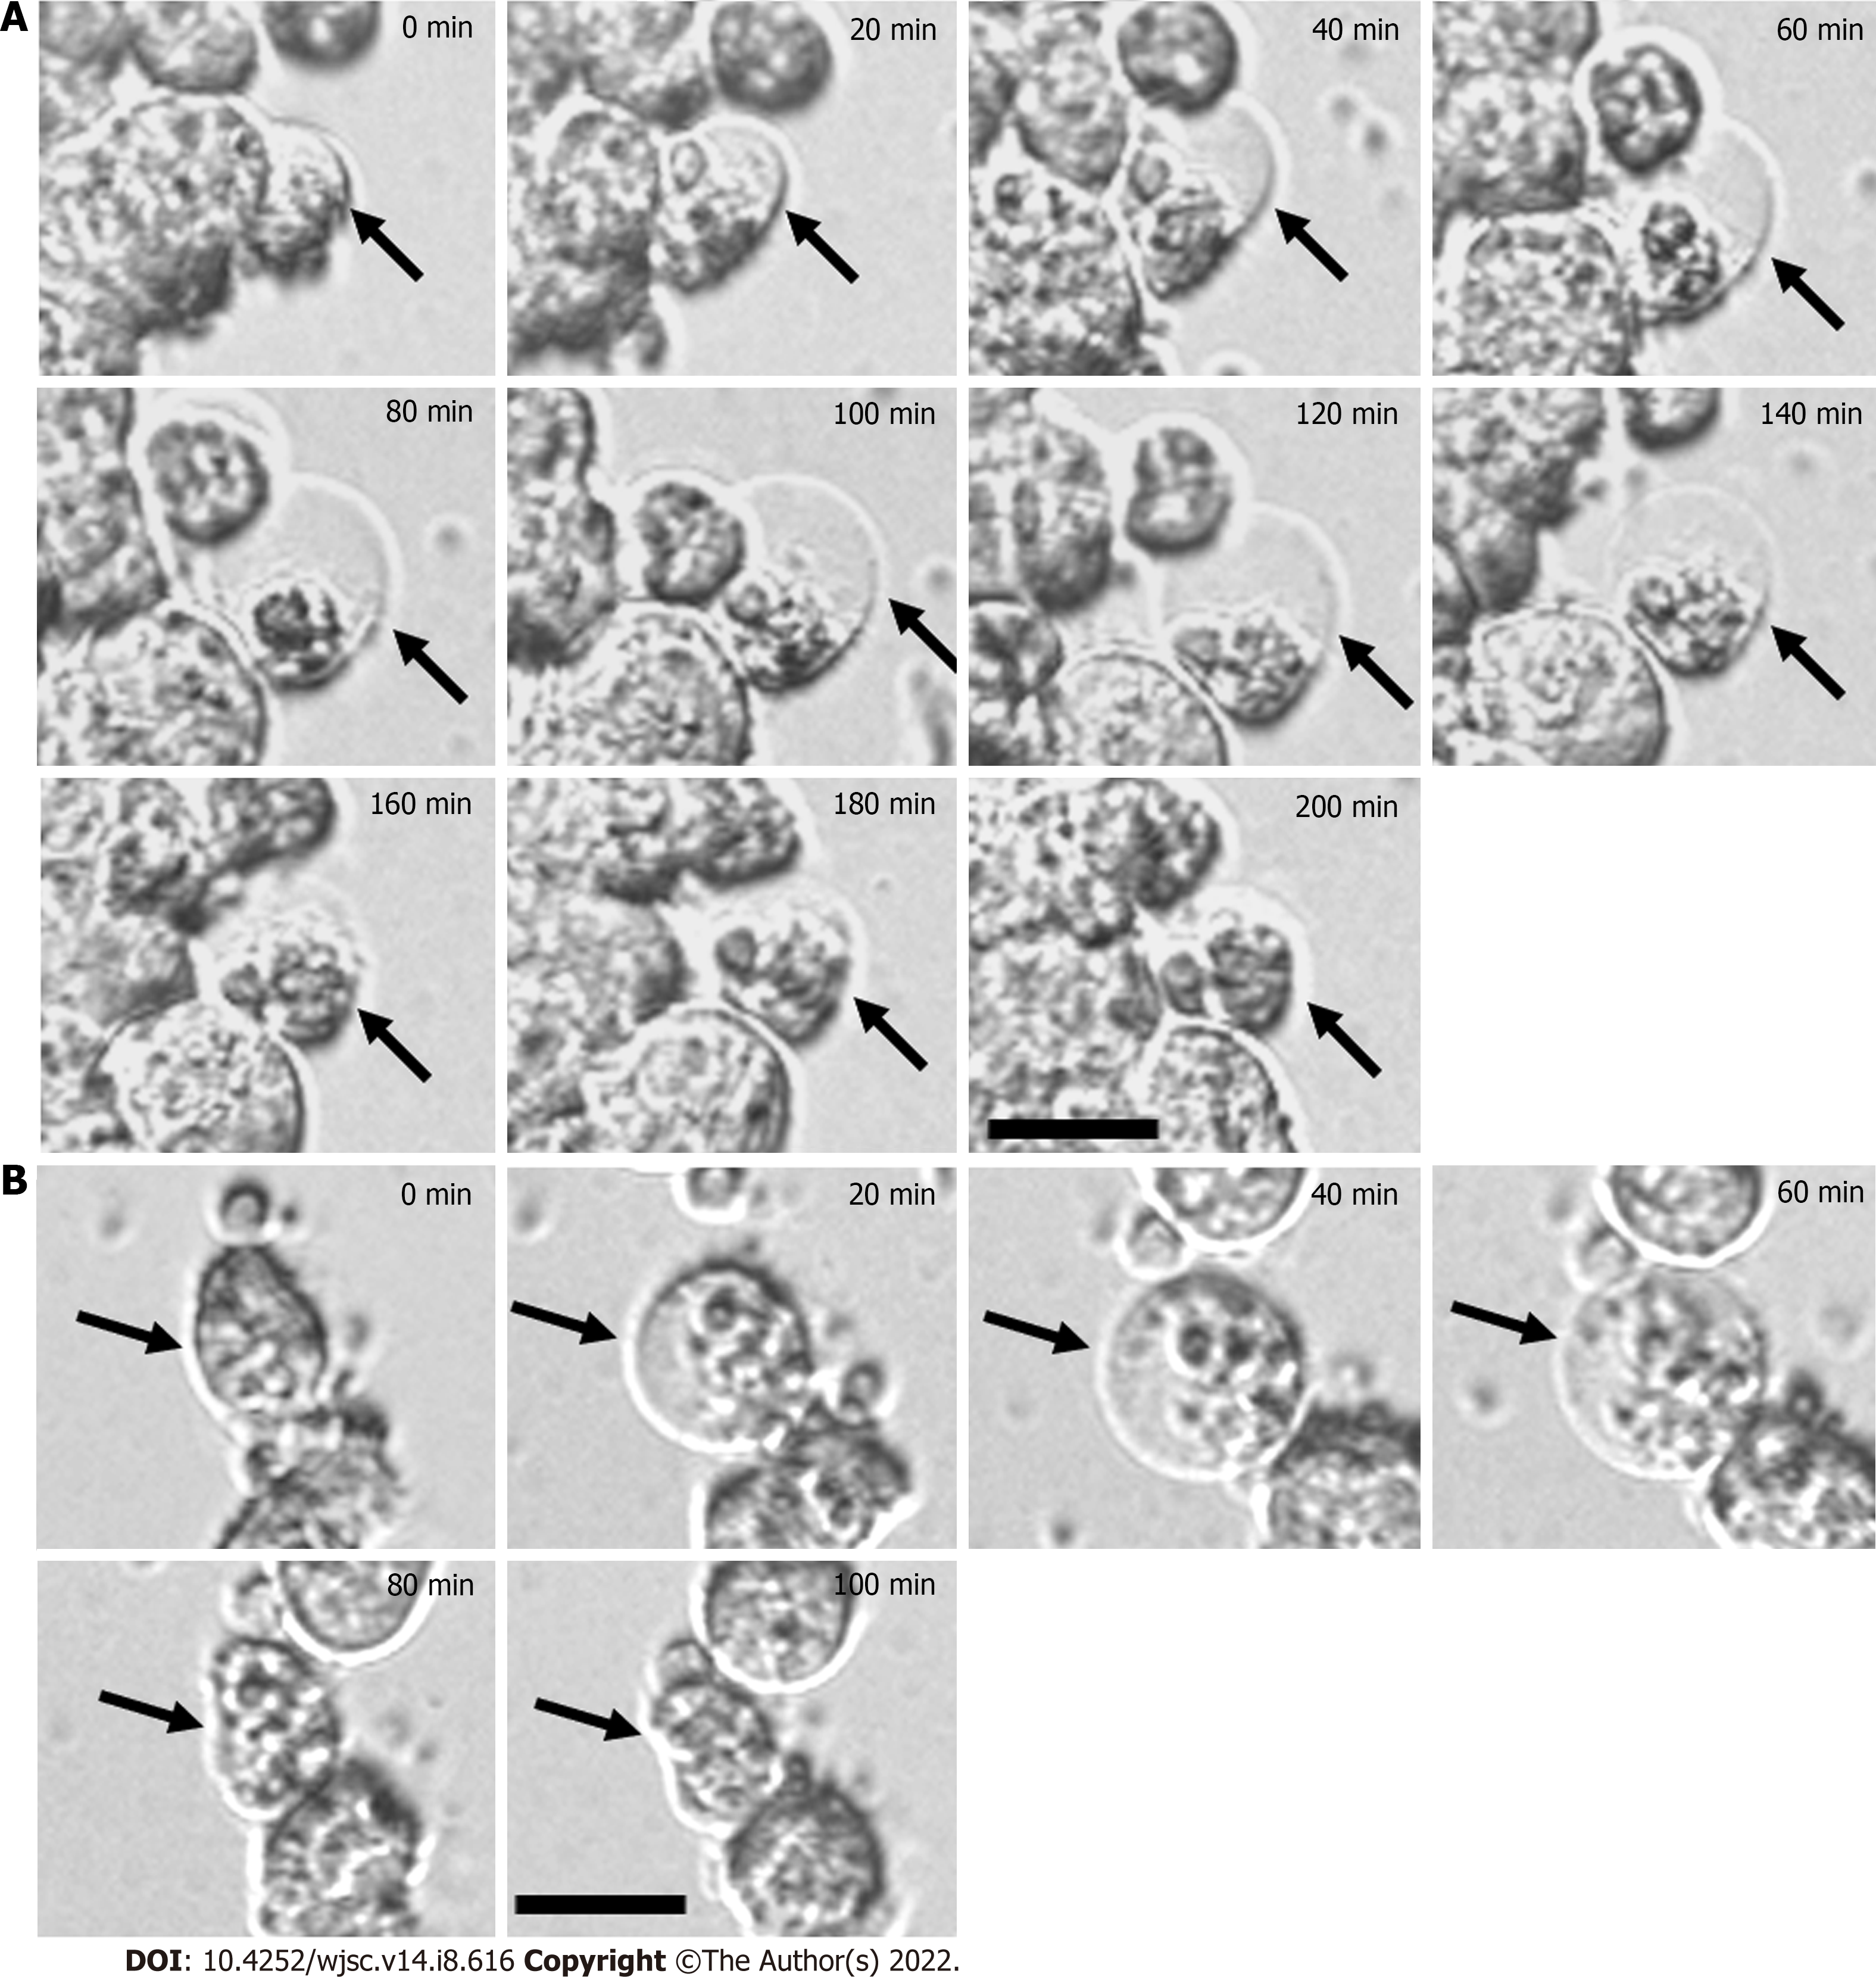
Figure 2 Time-lapse images showing the dynamic process of bubble formation for mesenchymal stem cells cultured on chitosan-hyaluronan or polyvinyl alcohol substrates.
A: Chitosan-hyaluronan; B: Polyvinyl alcohol. All images were collected after seeding of mesenchymal stem cells for 30 min. The process of bubble formation and disappearance was recorded by time-lapse phase contrast microscope. The dynamic changes of bubble structure were indicated by black arrows. The timeline in the upper right corner represents the initial snapshot of the immature bubble counted from the beginning (0 min to 200 min). Scale bar: 20 μm.
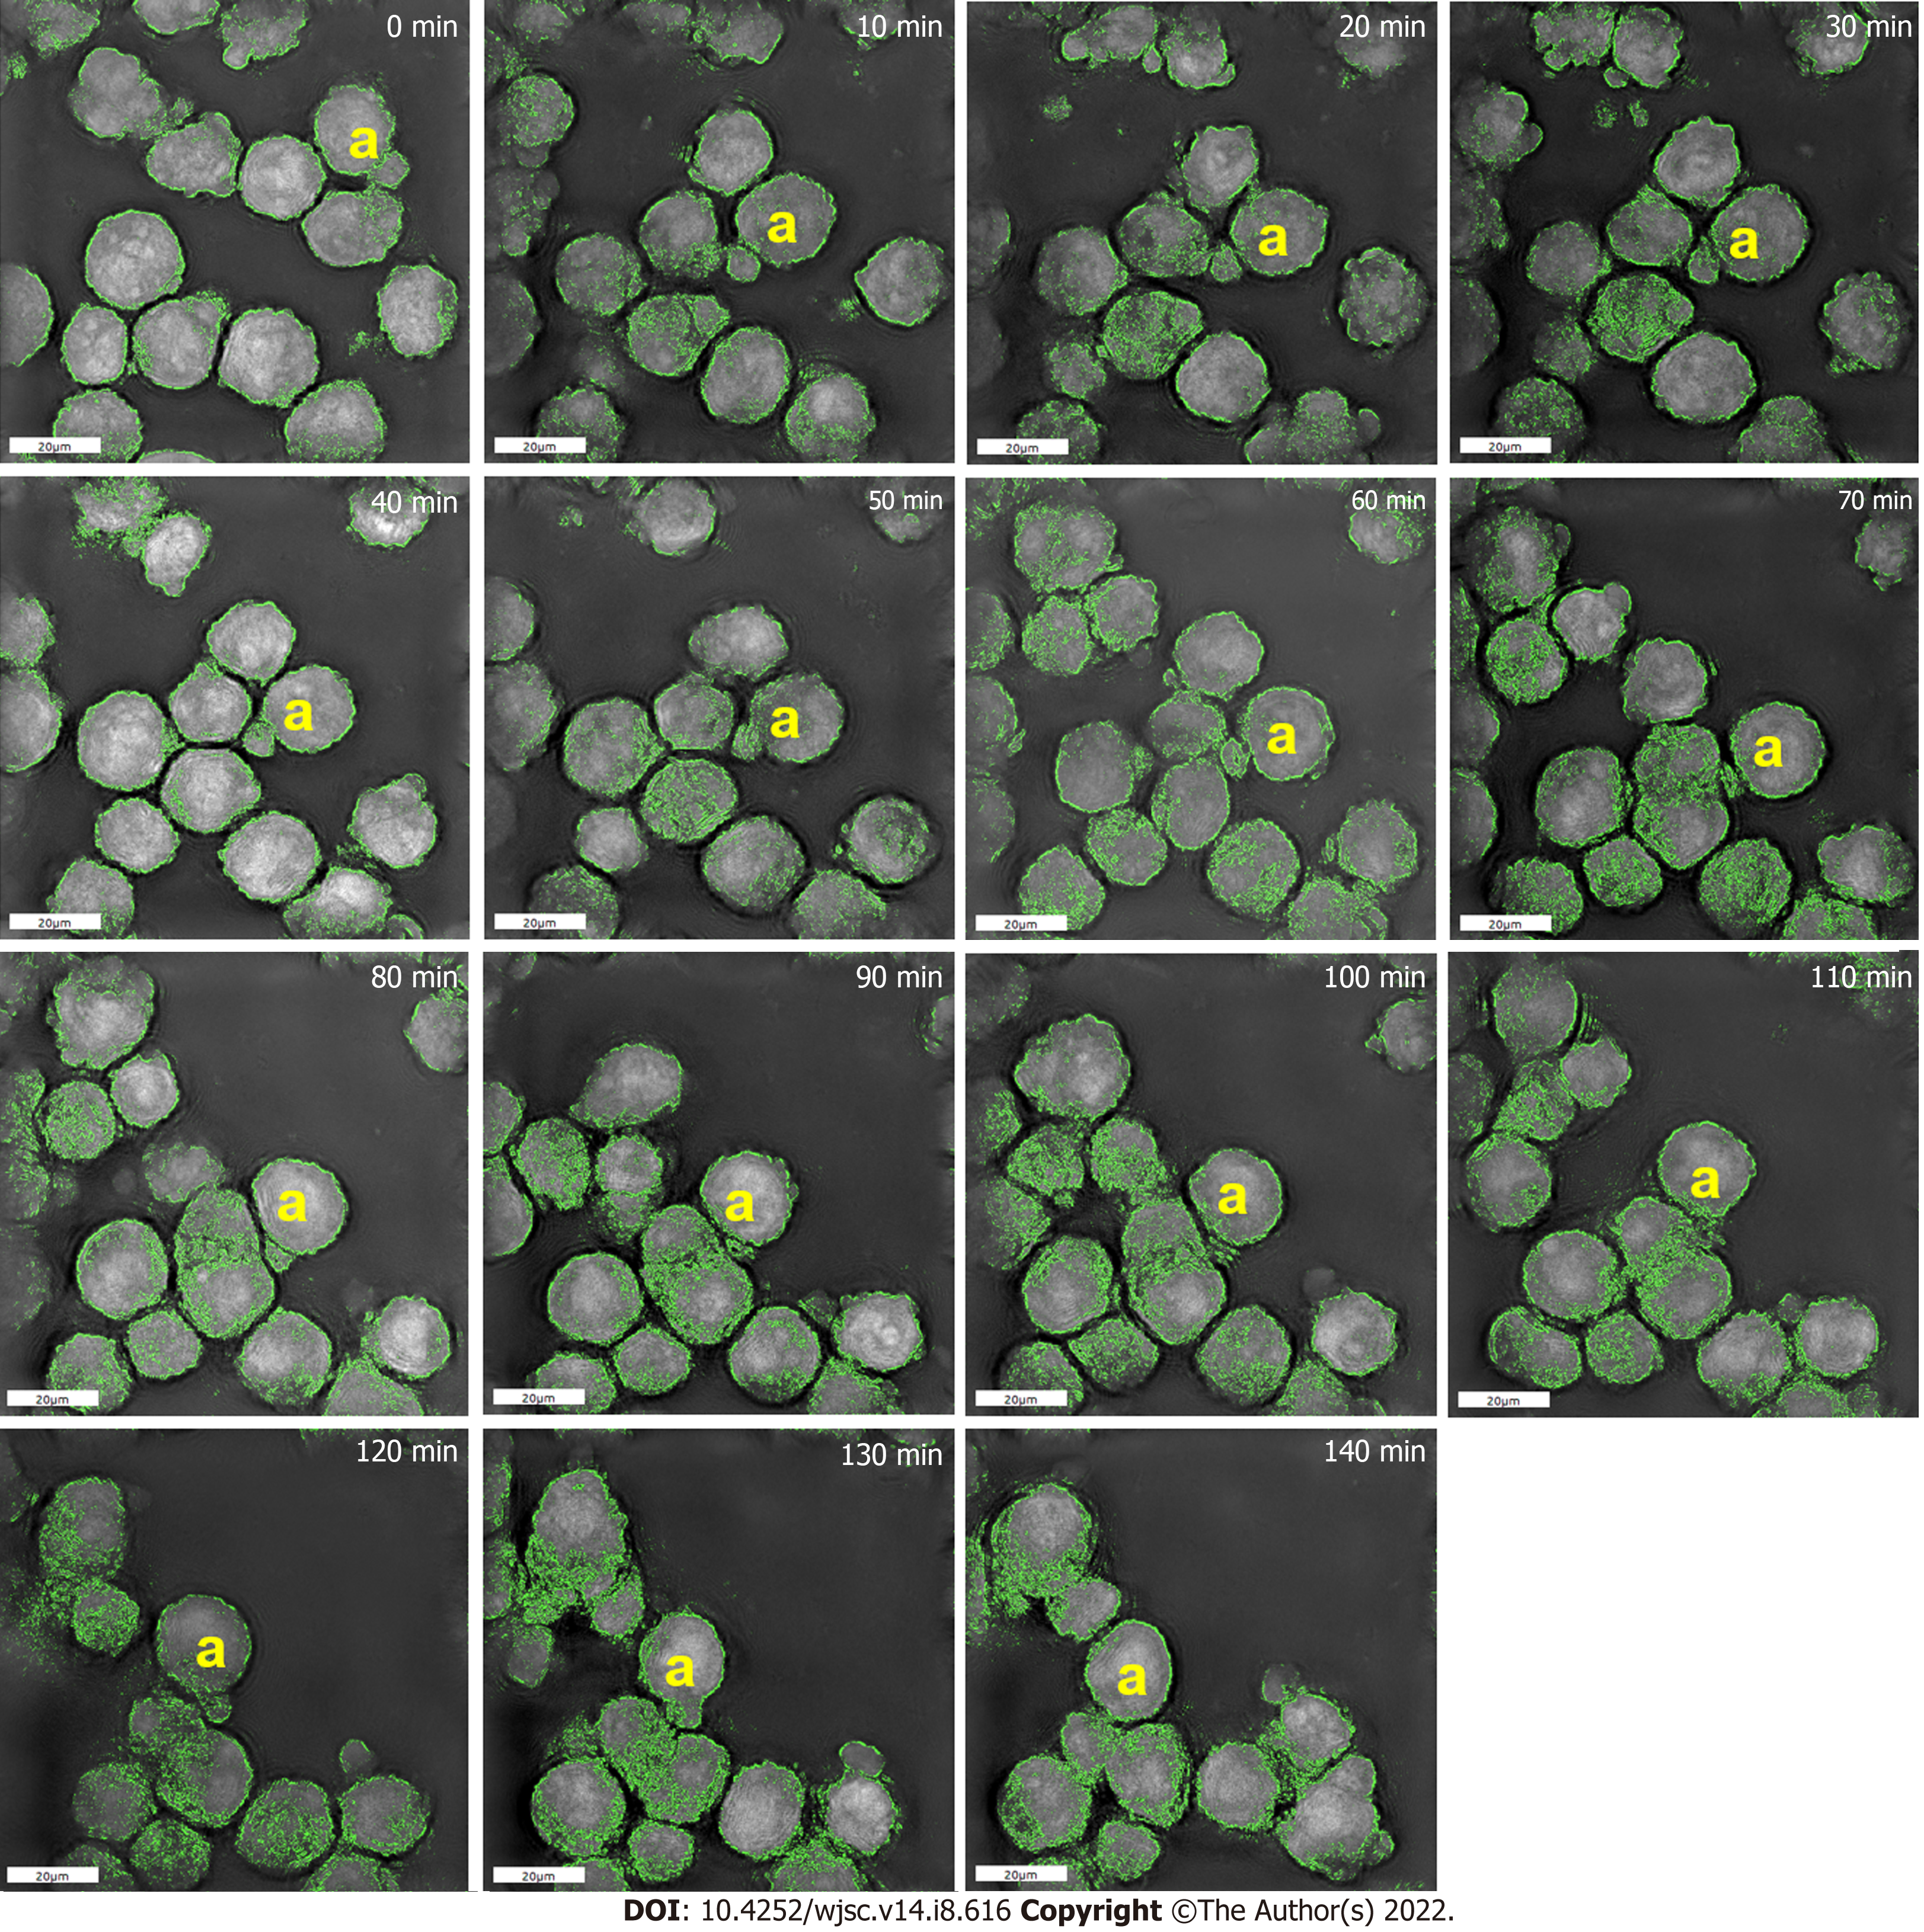
Figure 3 High-resolution images of the dynamic membrane morphology for spheroid-forming mesenchymal stem cells on chitosan-hyaluronan substrates.
Dynamic membrane morphology was recorded by the Nanolive instrument. Based on the specific refractive index, cell membrane is indicated in green color, and the dynamic change of membrane morphology was observed in the yellow a-marked cell. Scale bar: 20 μm.
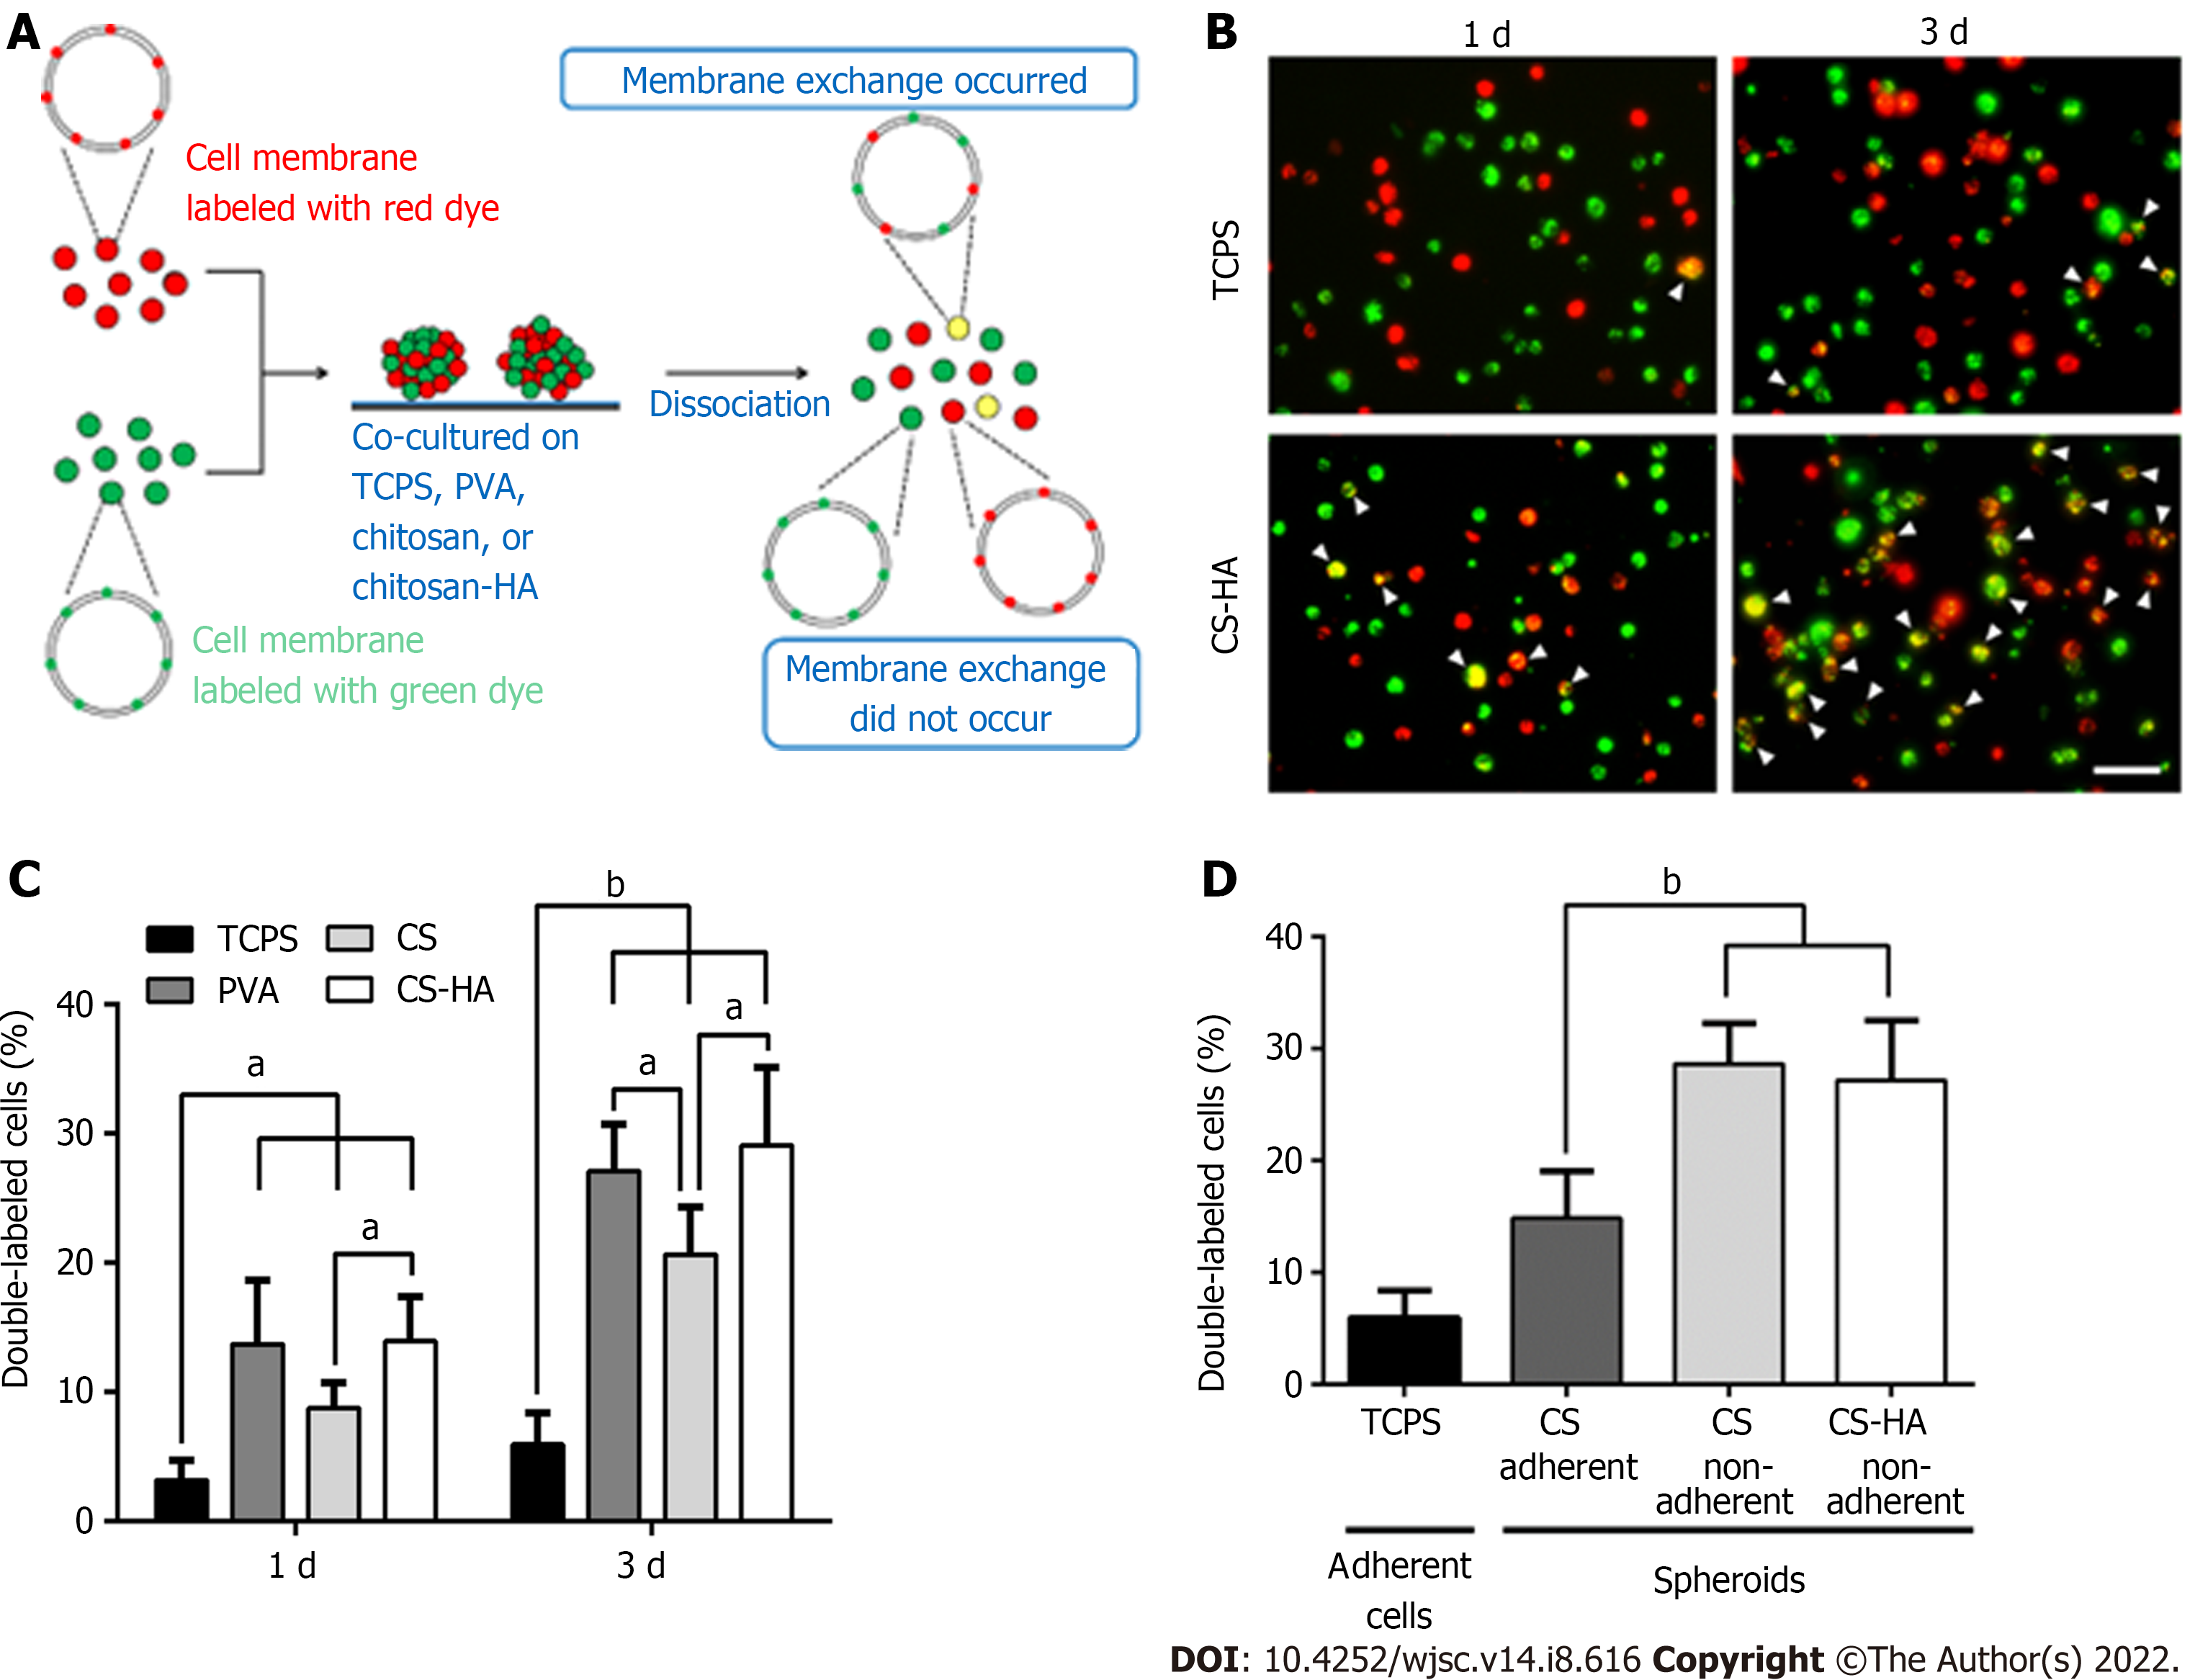
Figure 4 Membrane fluidity for mesenchymal stem cells cultured on tissue culture polystyrene and for mesenchymal stem cells spheroids formed on various substrates.
A: Illustration of experimental procedures for determination of the membrane fluidity; B: Double-labeled cells (with yellow color) are indicated by white arrowheads. Scale bar: 100 μm; C: Population percentages of the double-labeled cells collected from the tissue culture polystyrene (TCPS), polyvinyl alcohol (PVA), chitosan (CS), or CS-hyaluronan (CS-HA) substrates as indicated. aP < 0.05, bP < 0.01, among the indicated groups; D: Population percentages of double-labeled cells were measured from adherent and non-adherent mesenchymal stem cells (MSCs) spheroids on CS and CS-HA substrates after 3 d of incubation. The adherent MSCs cultured on TCPS plates served as the control group in this experiment. bP < 0.01, among the indicated groups. PVA: Polyvinyl alcohol; MSC: Mesenchymal stem cells; CS-HA: CS-hyaluronan; CS: Chitosan.
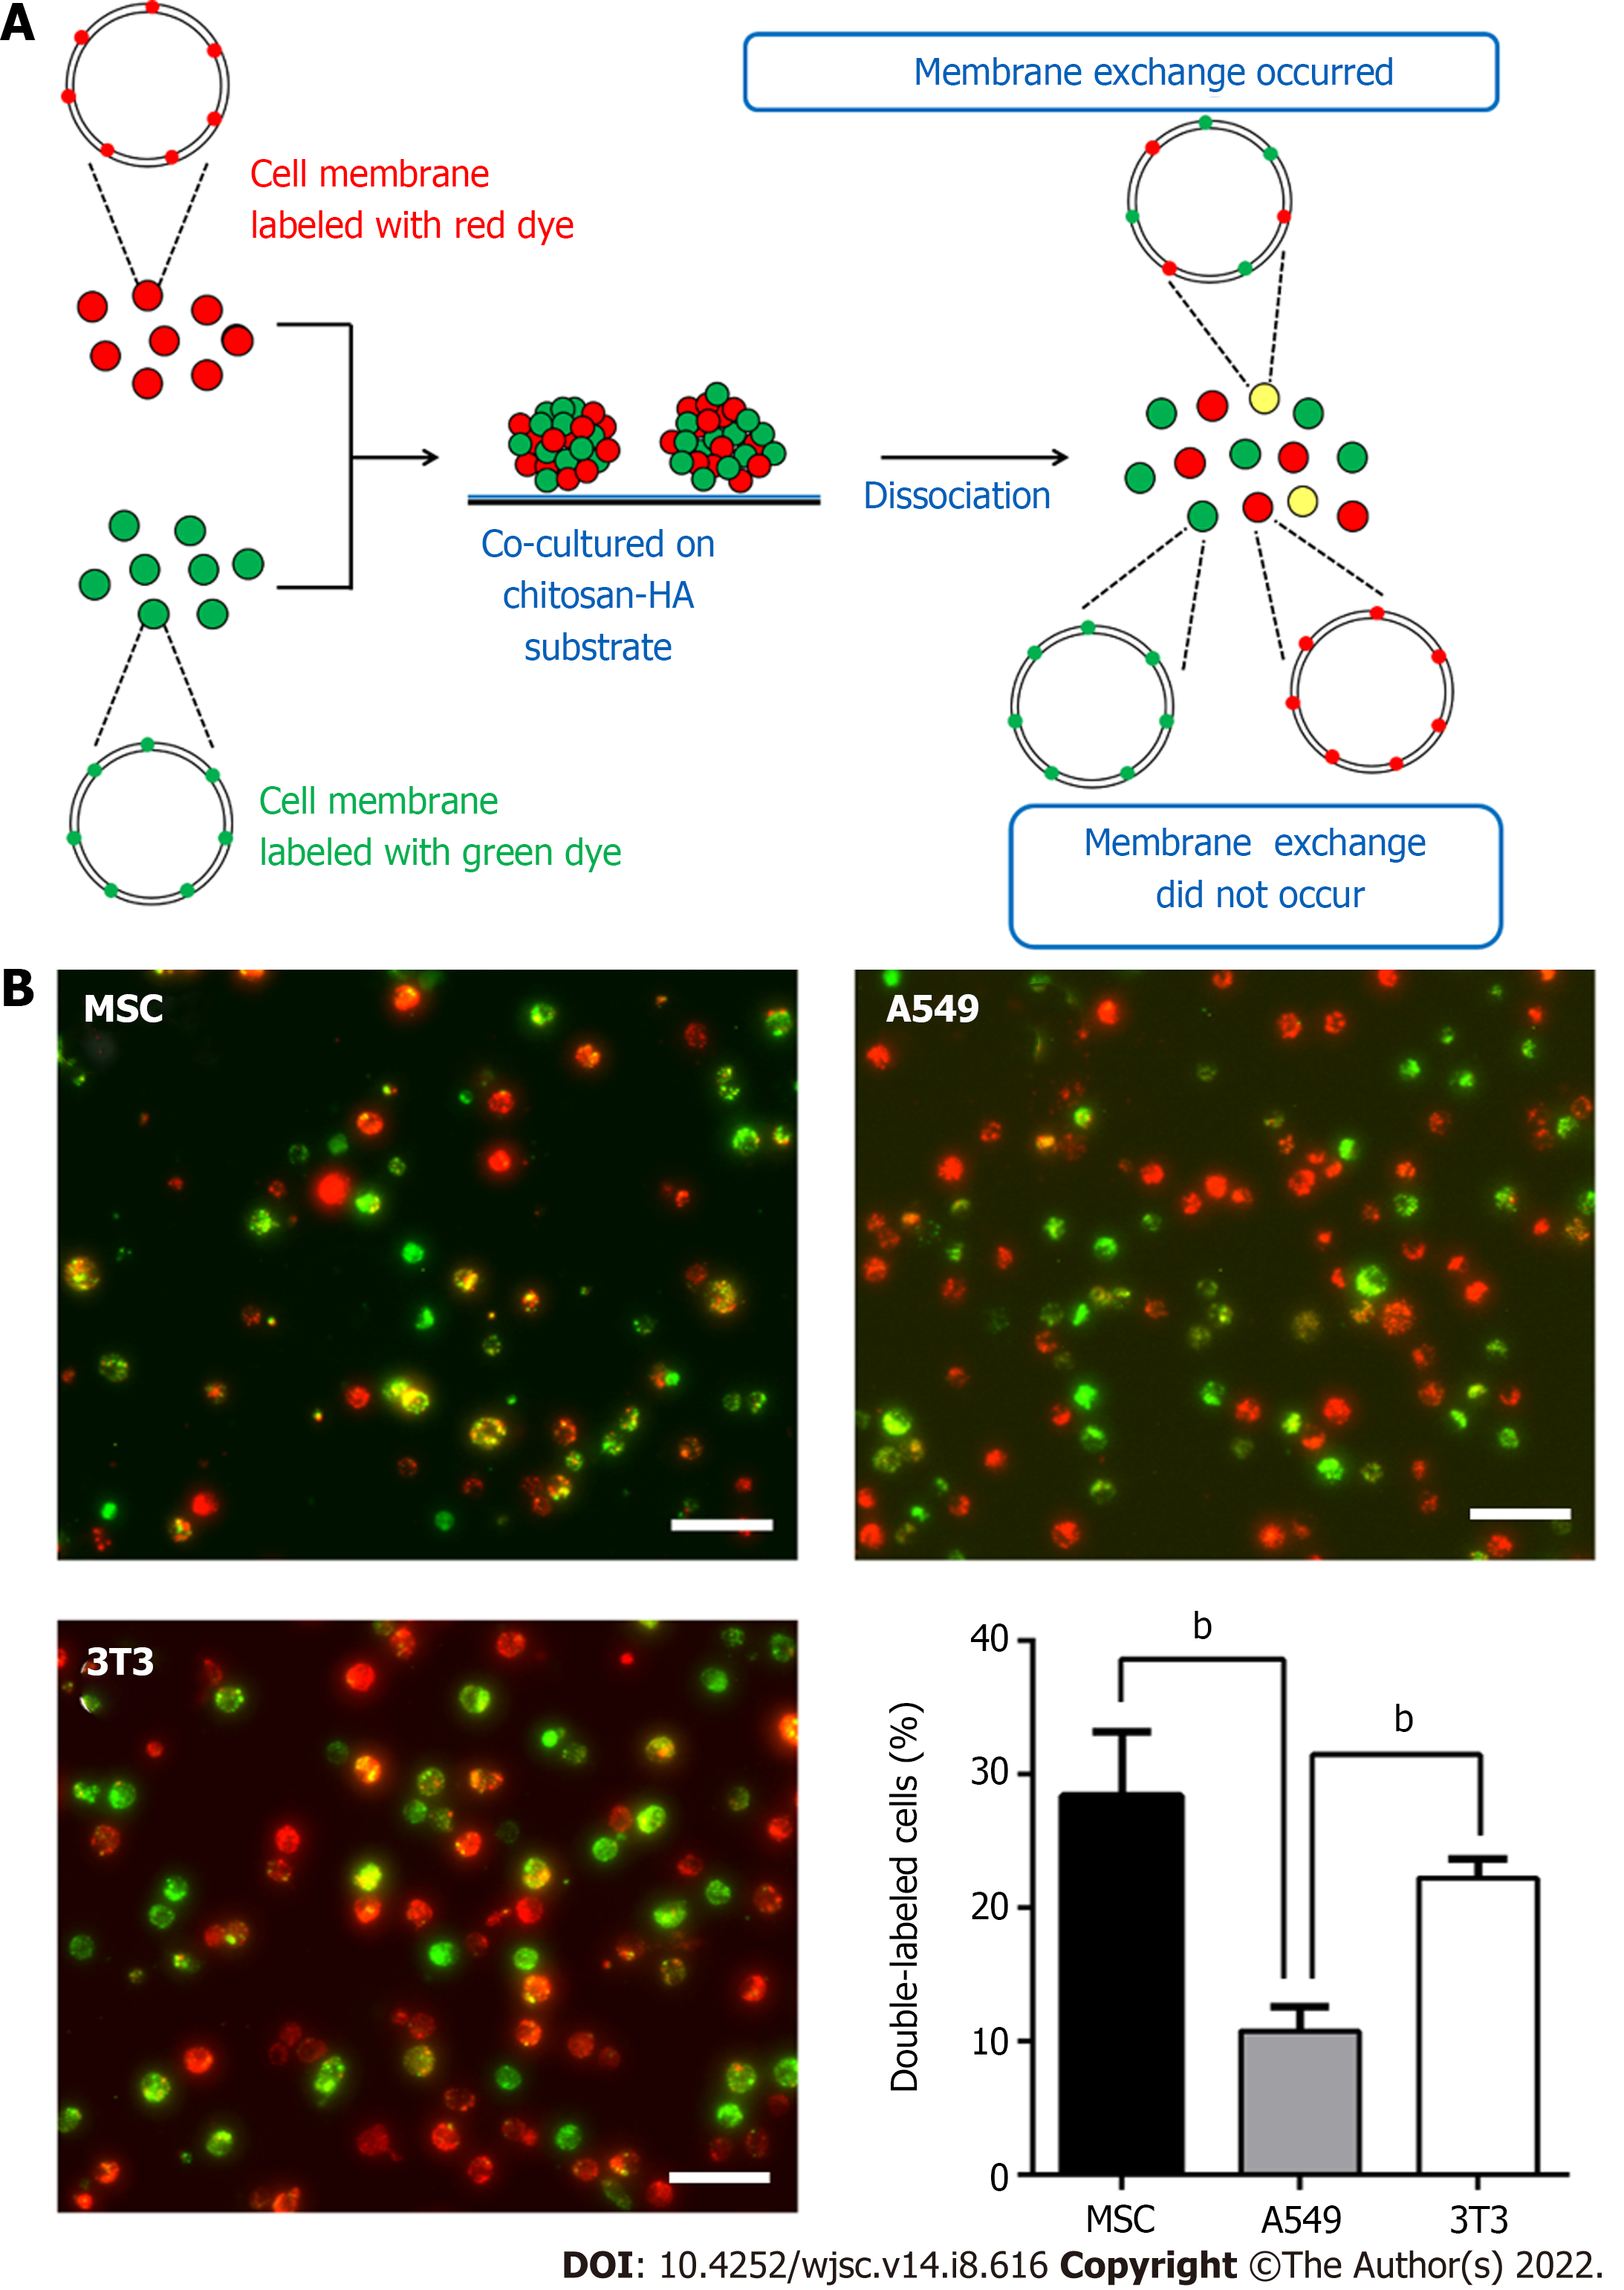
Figure 5 Membrane fluidity of mesenchymal stem cells, 3T3, and A549 individually cultured on chitosan-hyaluronan substrates.
The single cell suspension was subjected to the analysis for respective ratios of the cells labeled with single and double fluorescent dyes. A: Illustration of experimental procedures; B: Mesenchymal stem cells, A549, or 3T3 cells labeled with fluorescent dyes were cultured on chitosan-hyaluronan substrates for 3 d, and then the membrane fluidity of cells was revealed by the percentages of the double-labeled cell population. bP < 0.01, among the indicated groups. Scale bar: 100 μm. MSC: Mesenchymal stem cells.
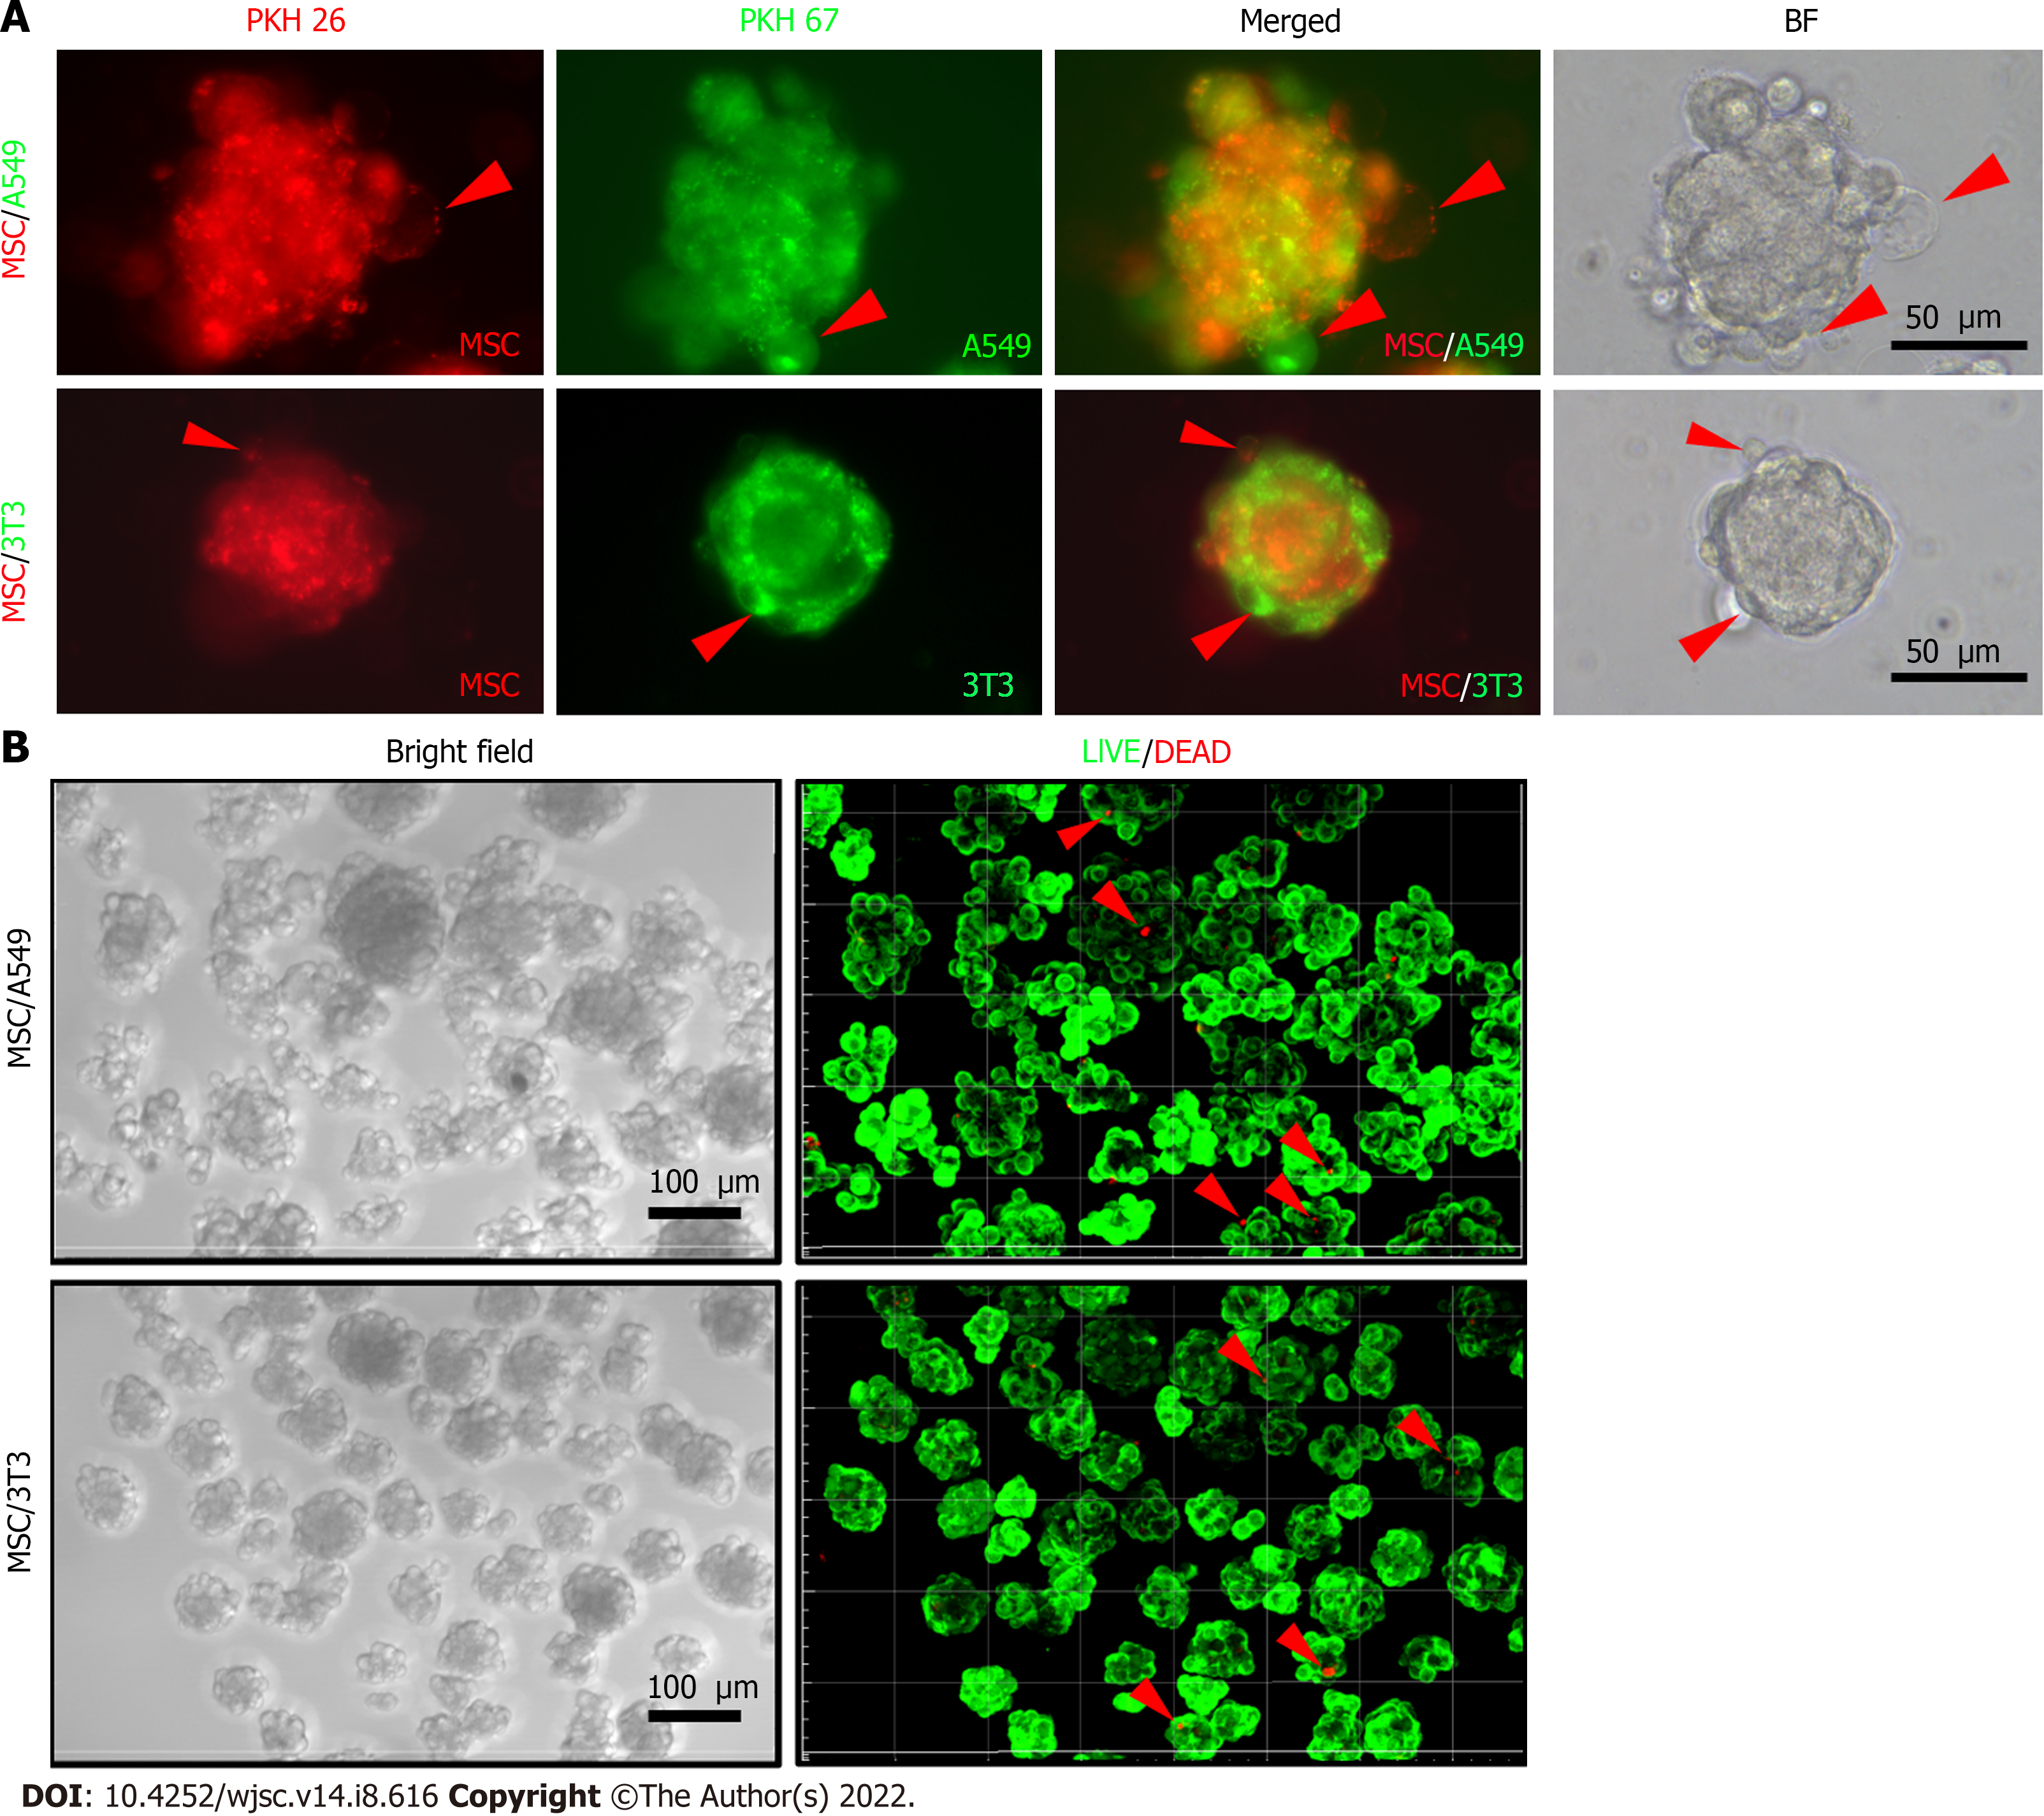
Figure 6 Morphologies and cell viability of cellular co-spheroids.
A: Fluorescent dye-labeled mesenchymal stem cells (MSCs) (PKH26, red), A549 (PKH67, green), or 3T3 (PKH67, green) cells were co-cultured on chitosan-hyaluronan (CS-HA) substrates for 3 d. The image of typical cell morphologies and vesicle-like bubbles on the cell membrane of the MSC/3T3 or MSC/A549 co-spheroids were taken by the inverted microscope; B: confocal images of co-spheroids co-cultured on CS-HA substrates for 2 d. The cell viability was detected by LIVE/DEAD staining with calcein AM (green) and ethidium homodimer-1 (red). Viable cells appear as green, while the red arrows indicate dead cells (red). Z-stack images were collected at 3 μm sections (total stacks approximately 25 images). BF: Bright field; MSC: Mesenchymal stem cells.
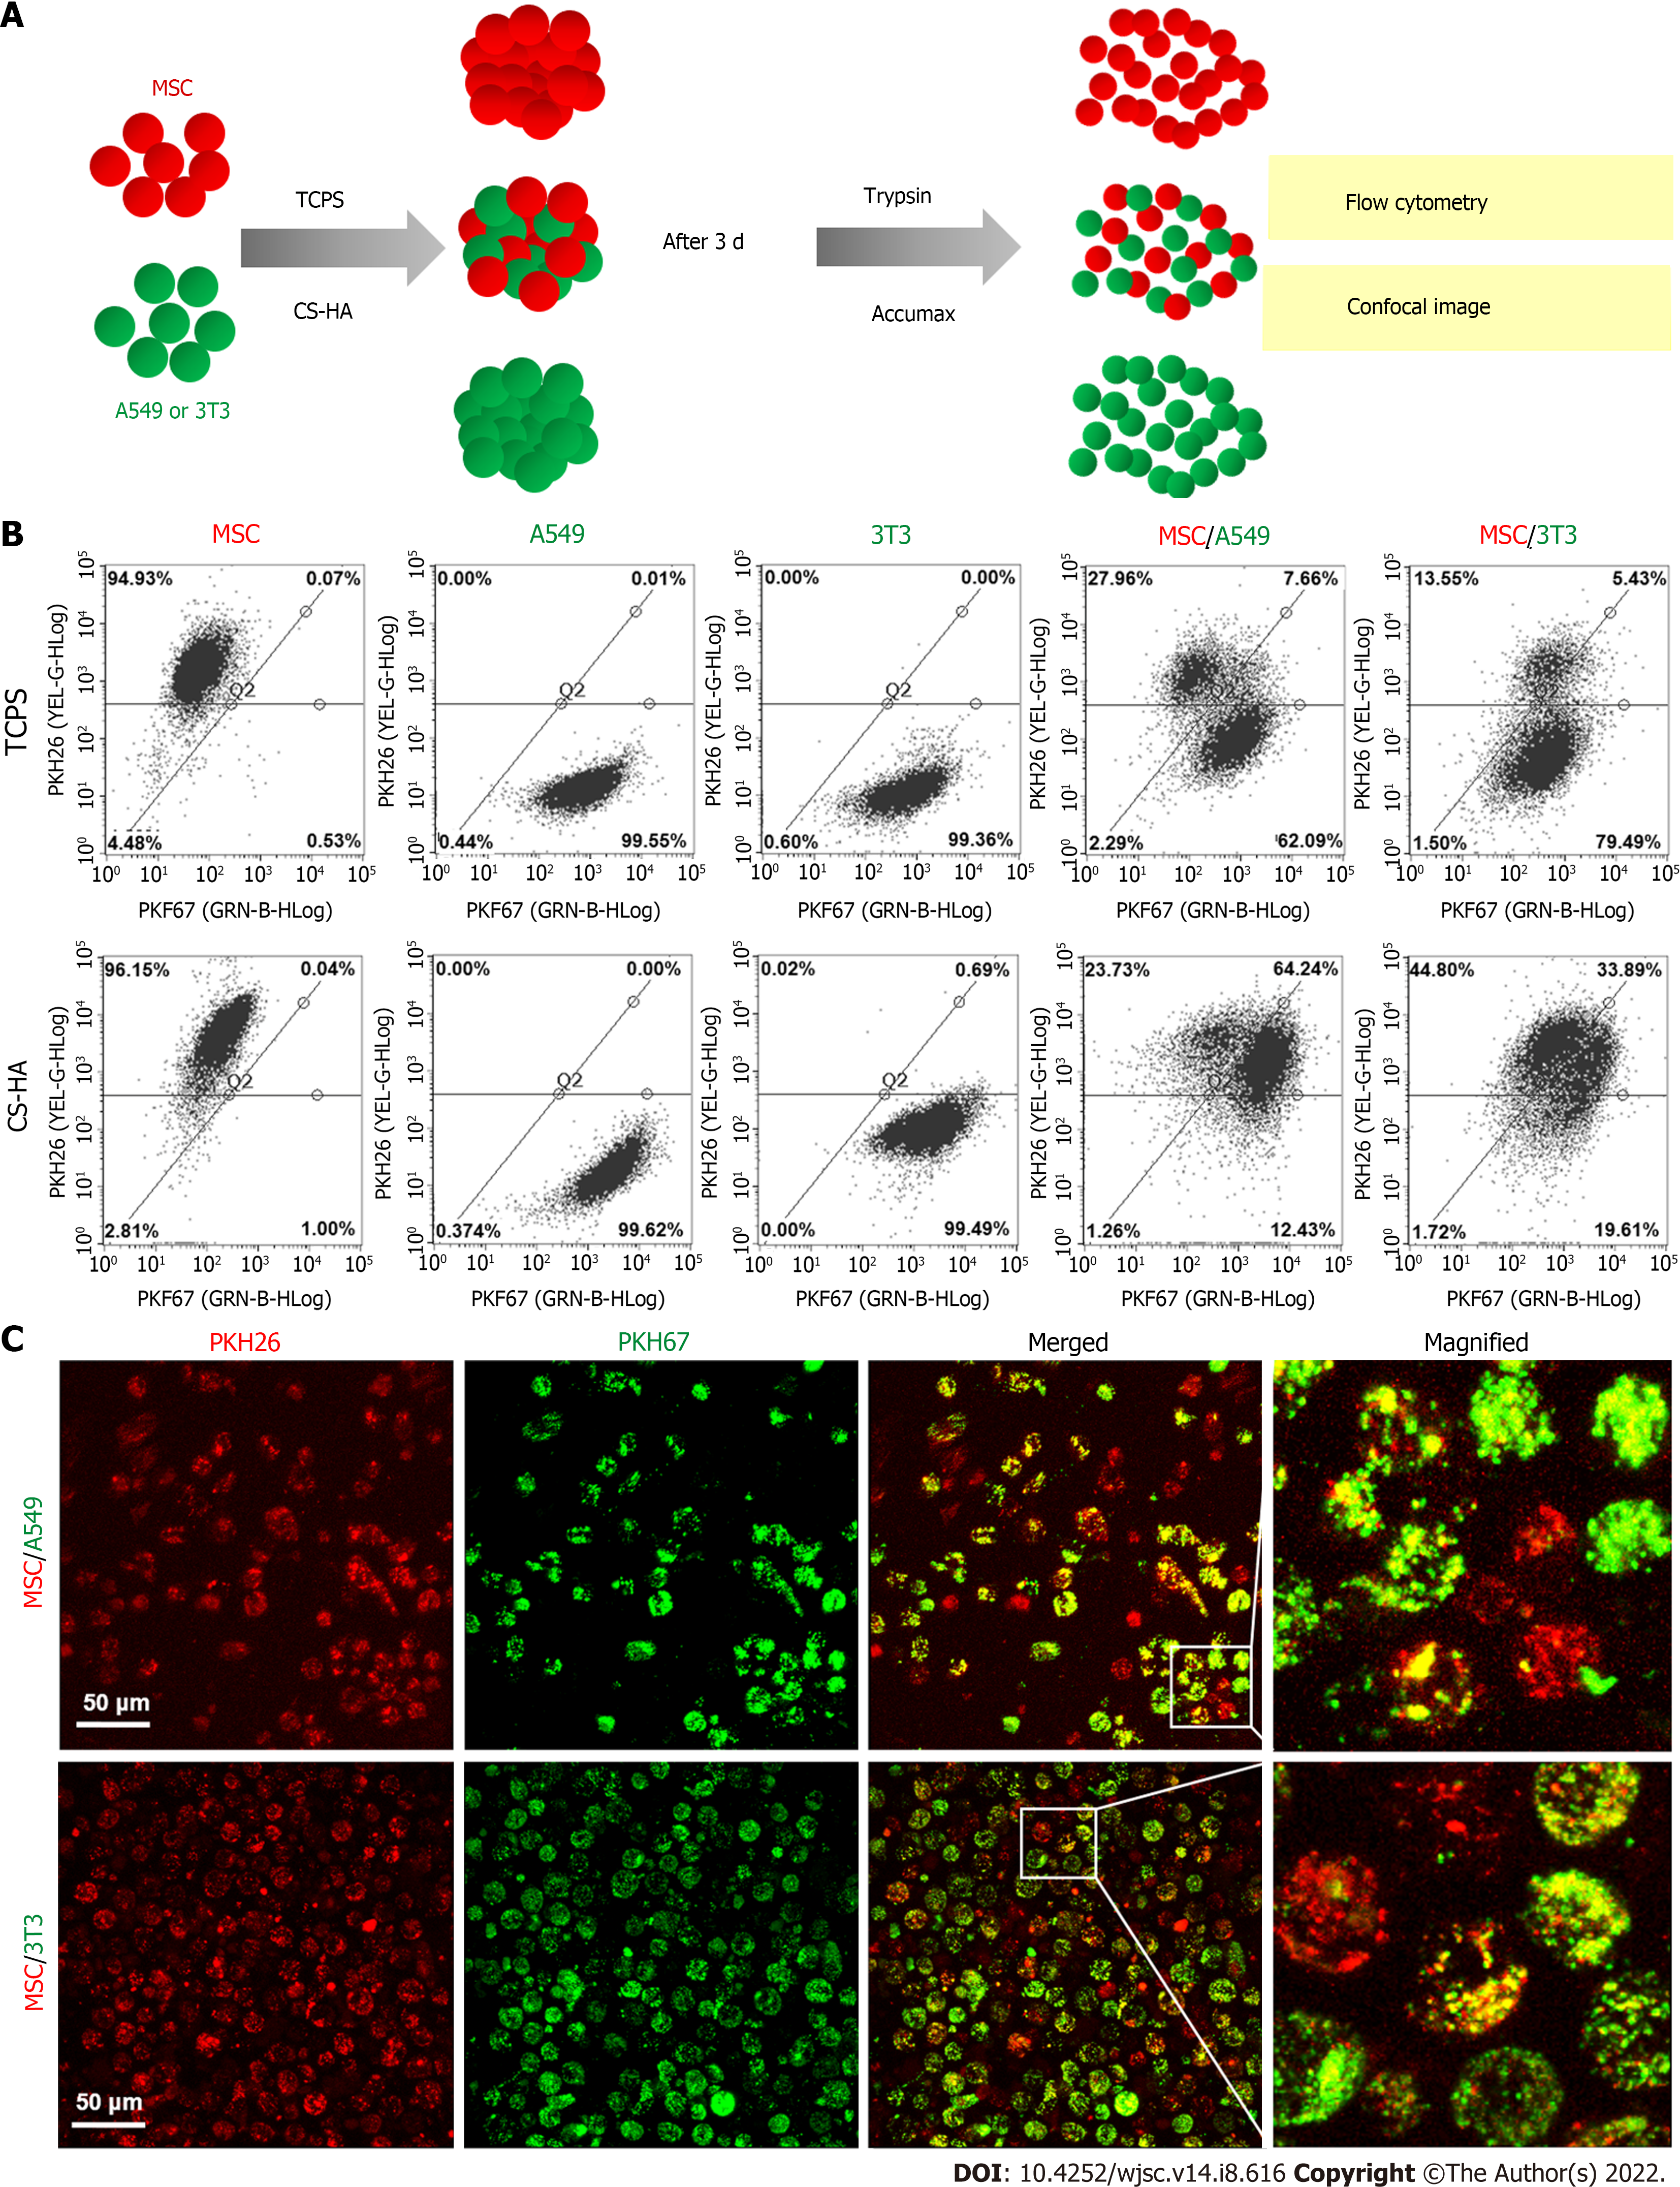
Figure 7 Membrane fluidity of cells for co-cultured cellular spheroids on tissue culture polystyrene or chitosan-hyaluronan substrates.
Membrane fluidity was determined by translocation of the membrane labeling fluorescent dyes. A: Illustration of experimental procedures for the determination of membrane fluidity. Fluorescent dye-labeled mesenchymal stem cells (MSCs) (PKH26, red), A549 (PKH67, green), or 3T3 (PKH67, green) cells were cultured on tissue culture polystyrene (TCPS) or chitosan-hyaluronan (CS-HA) substrates for 3 d. Then, the cells on TCPS were detached by trypsin and the co-spheroids on CS-HA were dissociated by Accumax. The single cell suspension was subjected to imaging and flow cytometry analysis to obtain the respective ratios of cells labeled with single and double fluorescent dyes; B: Respective ratios of the cells labeled with single and double fluorescent dyes determined by flow cytometry; C: The confocal image of single cells dissociated from MSC/A549 or MSC/3T3 co-spheroids by Accumax. Scale bar: 50 μm. TCPS: Tissue culture polystyrene; CS-HA: Chitosan-hyaluronan; MSC: Mesenchymal stem cells.
- Citation: Wong CW, Han HW, Hsu SH. Changes of cell membrane fluidity for mesenchymal stem cell spheroids on biomaterial surfaces. World J Stem Cells 2022; 14(8): 616-632
- URL: https://www.wjgnet.com/1948-0210/full/v14/i8/616.htm
- DOI: https://dx.doi.org/10.4252/wjsc.v14.i8.616


