Copyright
©The Author(s) 2022.
World J Stem Cells. May 26, 2022; 14(5): 330-346
Published online May 26, 2022. doi: 10.4252/wjsc.v14.i5.330
Published online May 26, 2022. doi: 10.4252/wjsc.v14.i5.330
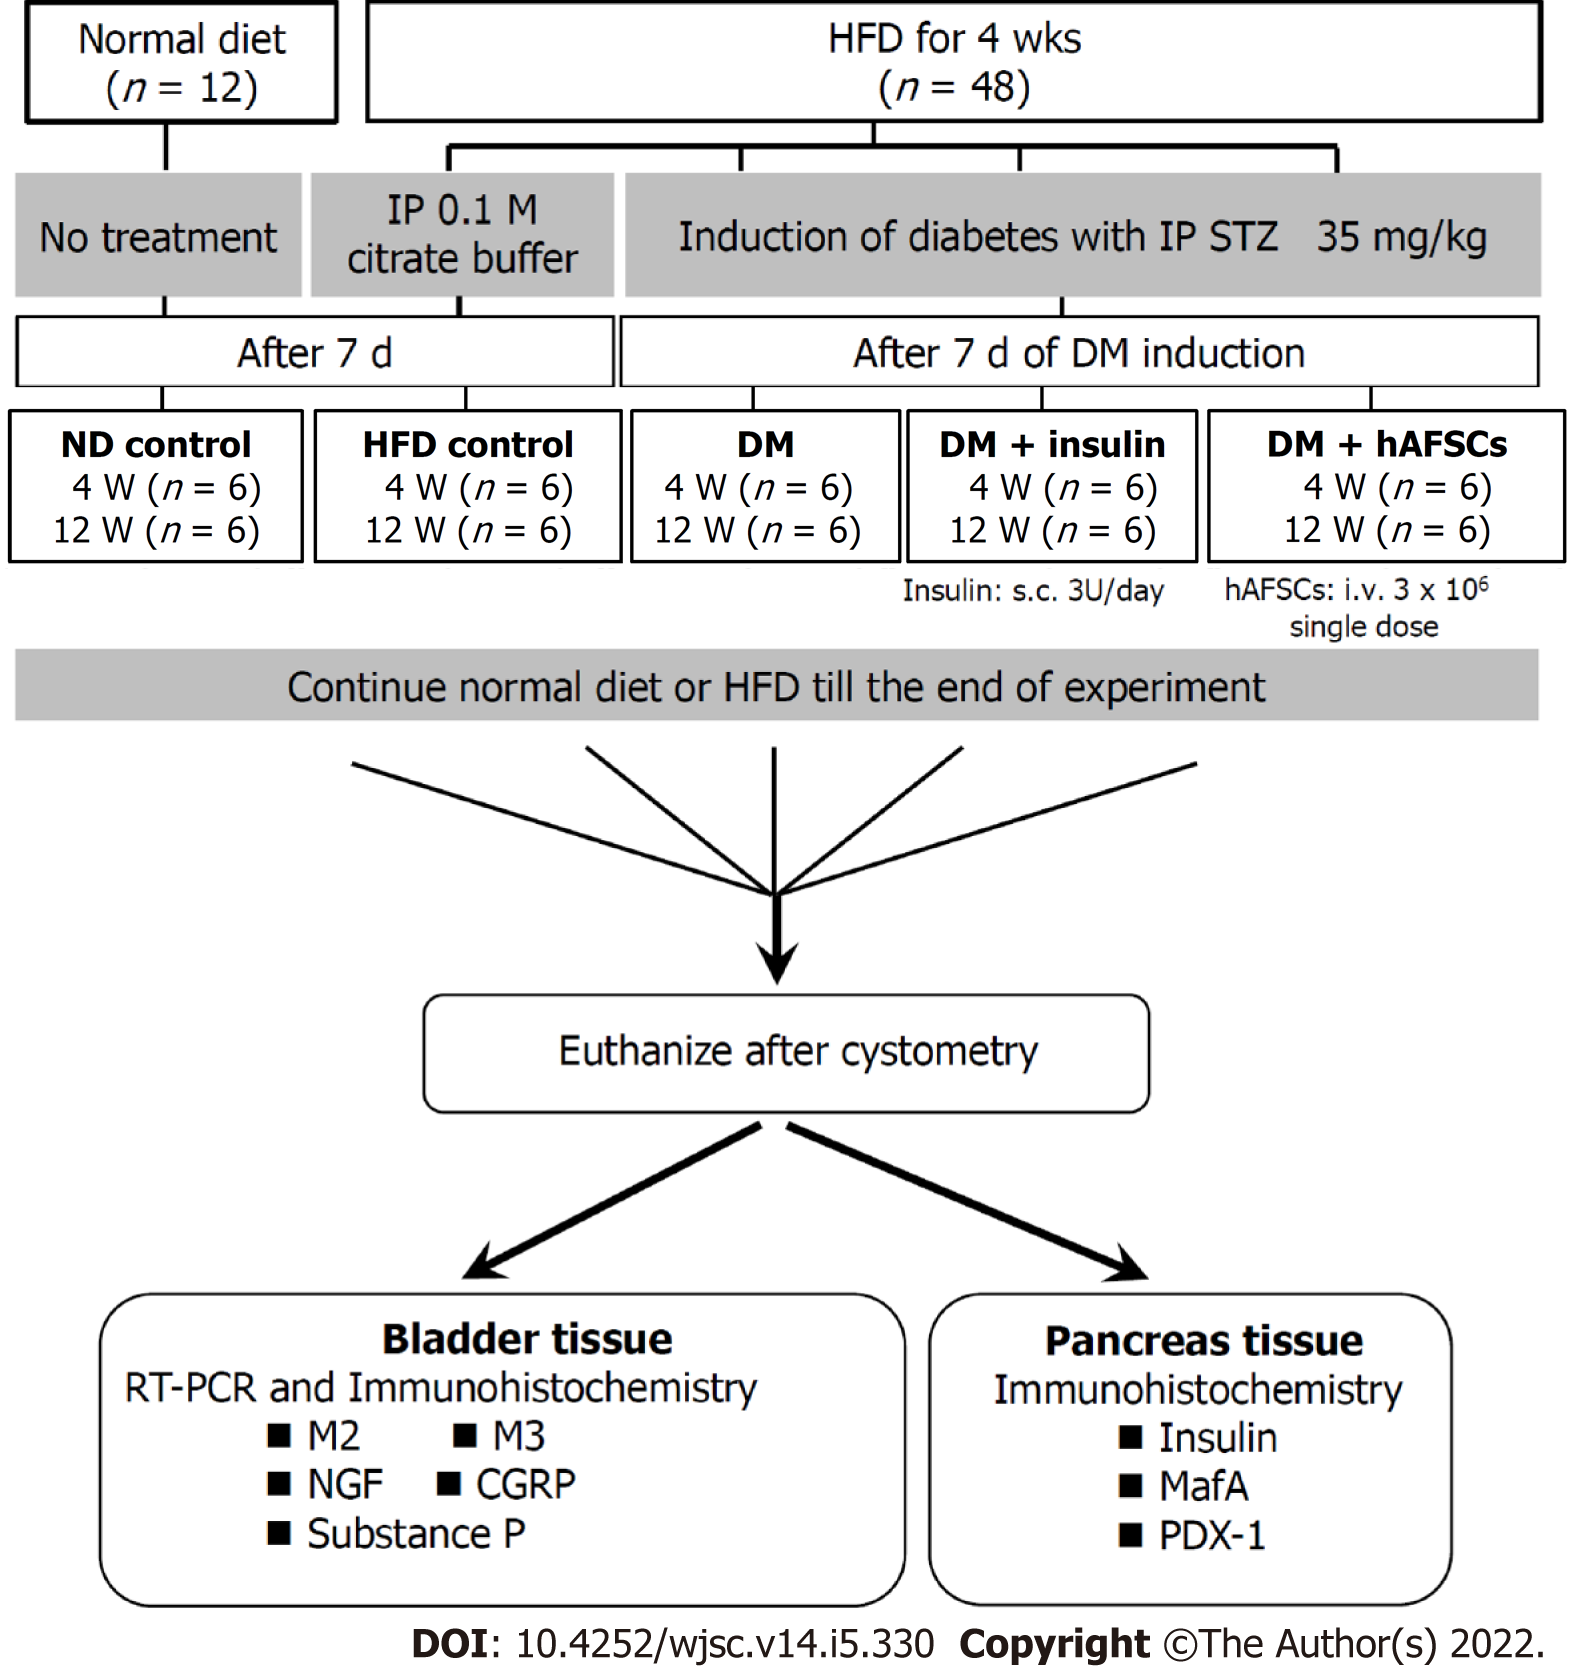
Figure 1 Schema of experimental procedure.
HFD: High-fat diet; IP: Intraperitoneal; STZ: Streptozotocin; ND: Normal diet; DM: Diabetes mellitus; hAFSCs: Human amniotic fluid stem cells; RT-PCR: Real-time polymerase chain reaction; M2: Muscarinic receptor 2; M3: Muscarinic receptor 3; NGF: Nerve growth factor; CGRP: Calcitonin gene-related peptide; PDX-1: Pancreatic-duodenal homeobox-1.
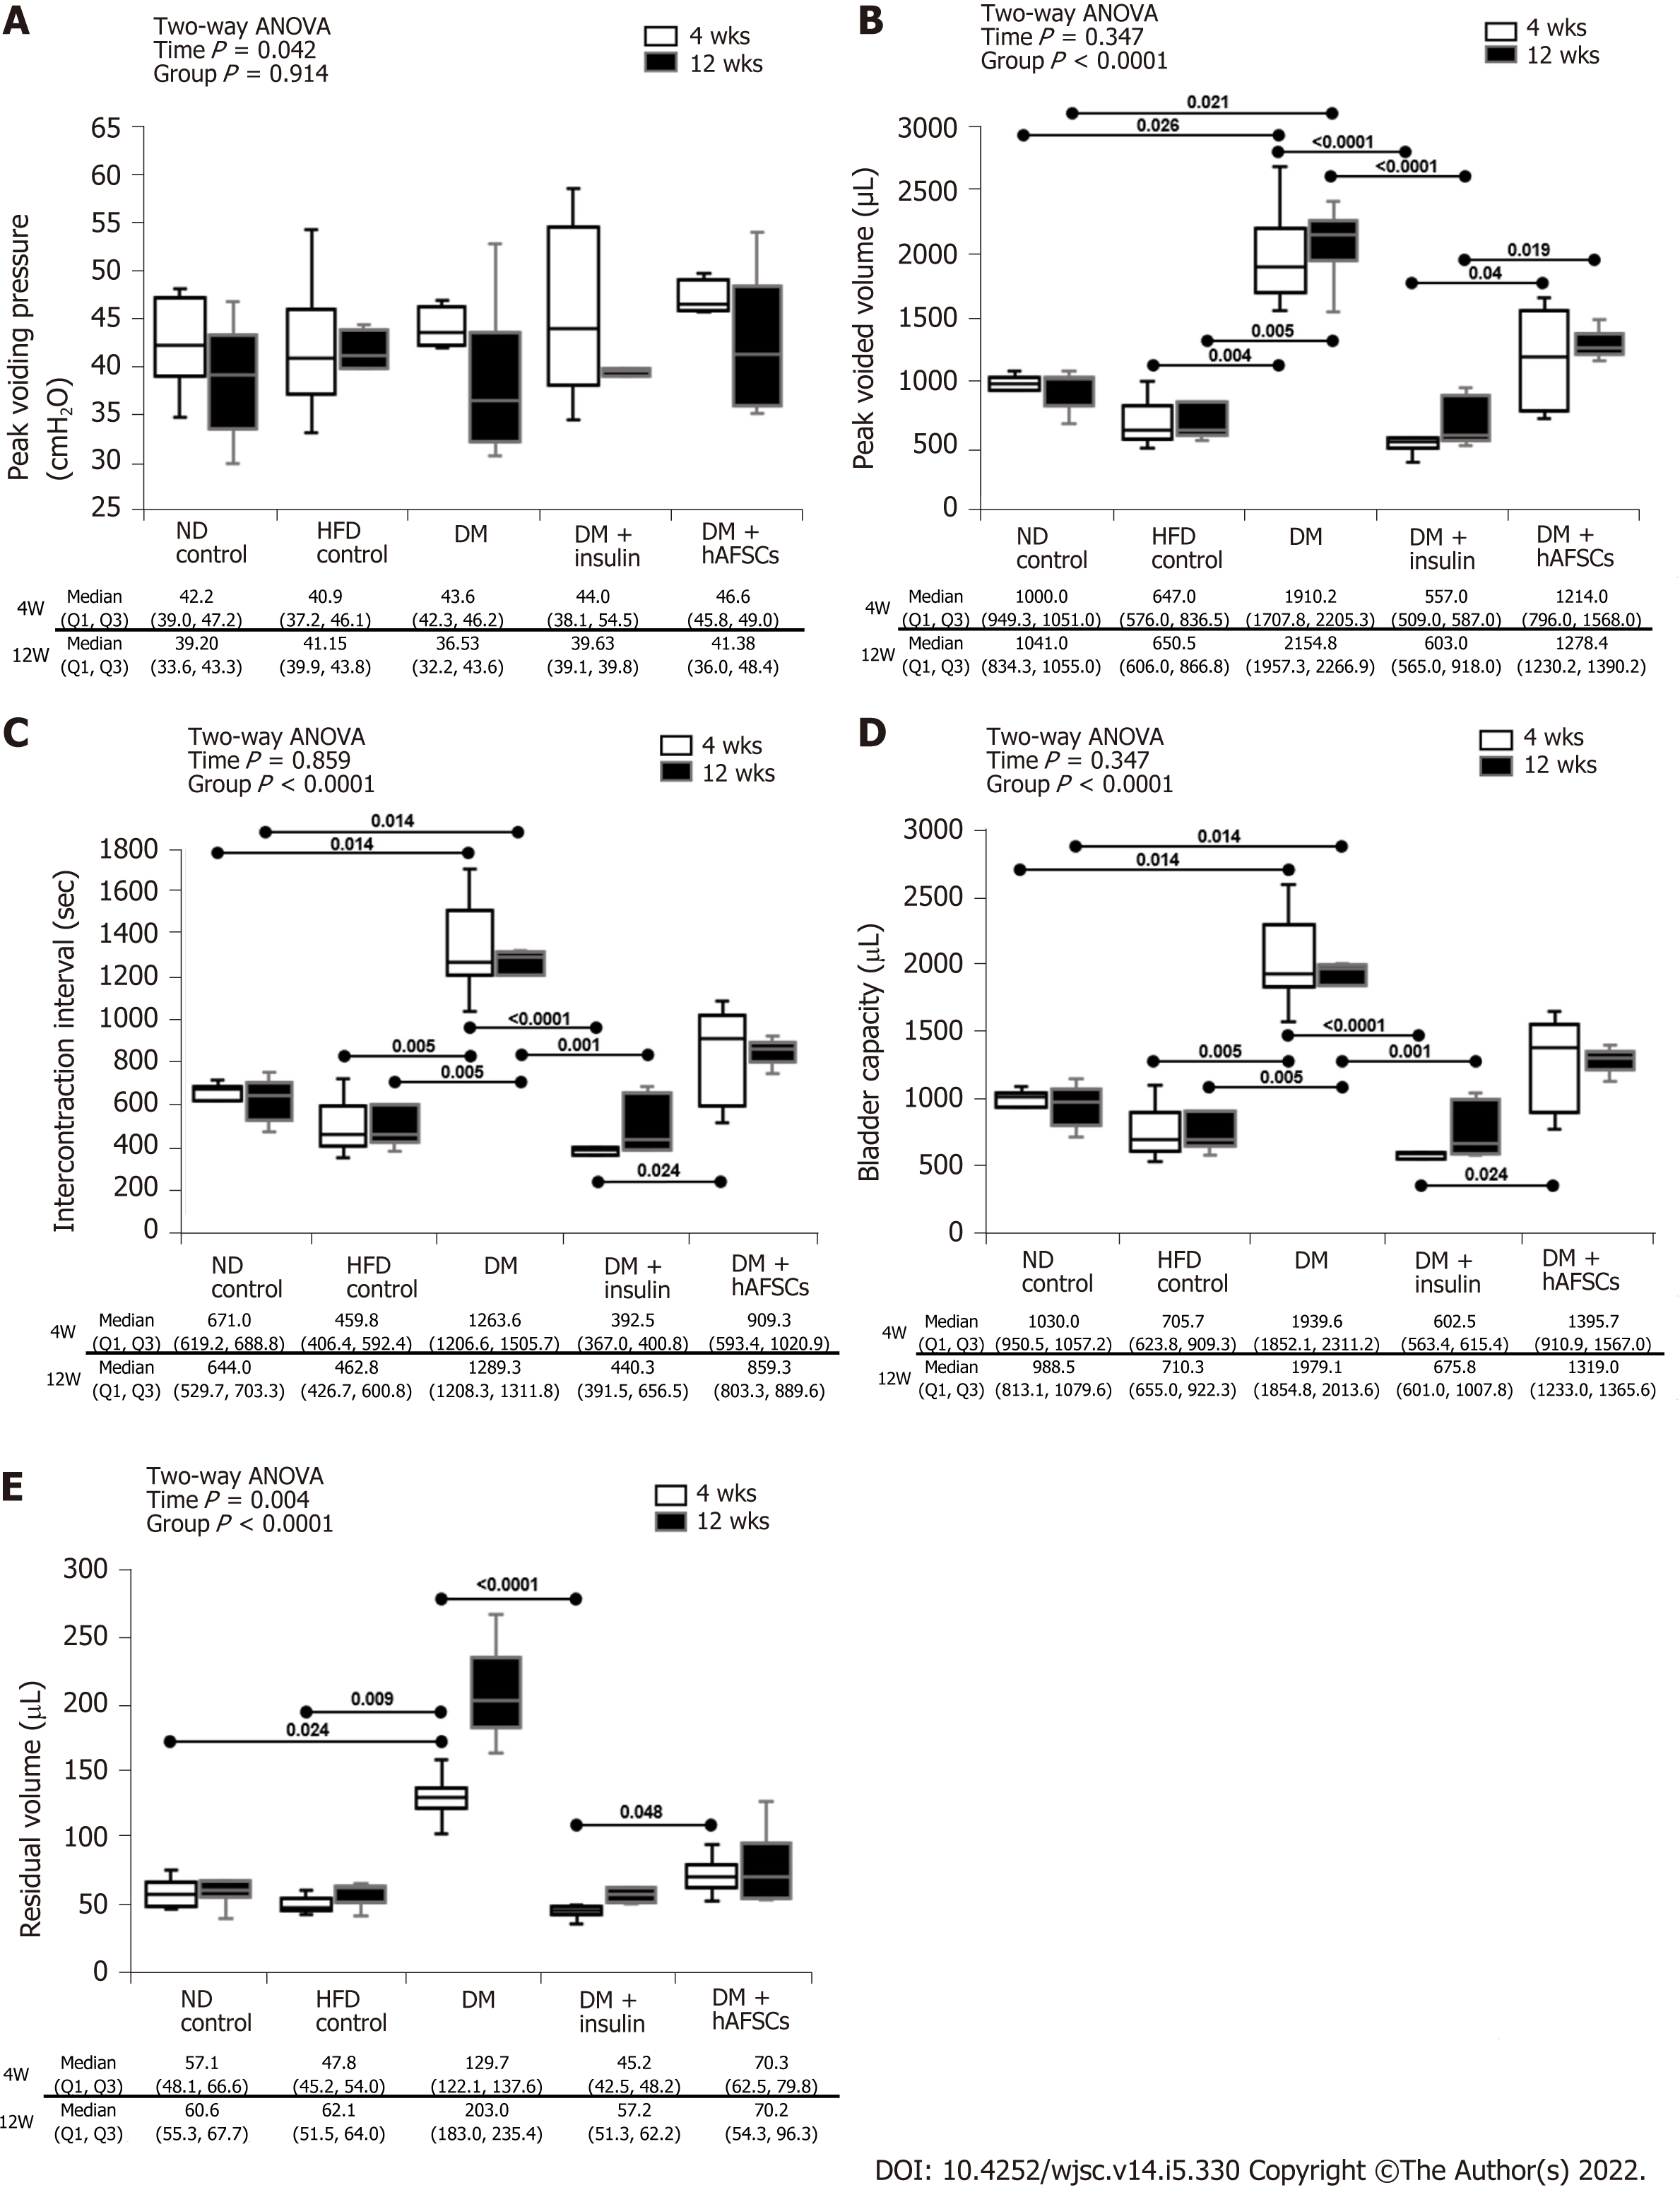
Figure 2 Cystometric results in different groups.
Compared with the controls, type 2 diabetes (DM) rats had significantly worse voided volume, intercontraction interval, bladder capacity, and residual volume after DM induction. These bladder dysfunctions can be improved after insulin treatment but not after human amniotic fluid stem cells (hAFSCs) therapy. The DM + hAFSCs rats had significantly higher peak voided volume, longer intercontraction interval, larger bladder capacity, and more residual volume than DM + insulin rats mainly at 4 wk (only peak voided volume also at 12 wk). n = 6. Statistics: Median with first and third quartile (Q1, Q3) for continuous variables. Two-way analysis of variance was used for initial analysis. Kruskal-Wallis test with post hoc Bonferroni test for intergroup analysis. Mann-Whitney U test for the comparison between 4 wk and 12 wk. P values are shown in each comparison. A: Peak voiding pressure; B: Peak voided volume; C: Intercontraction interval; D: Bladder capacity; E: Residual volume. ND: Normal diet; DM: Diabetes mellitus; hAFSCs: Human amniotic fluid stem cells; HFD: High-fat diet.
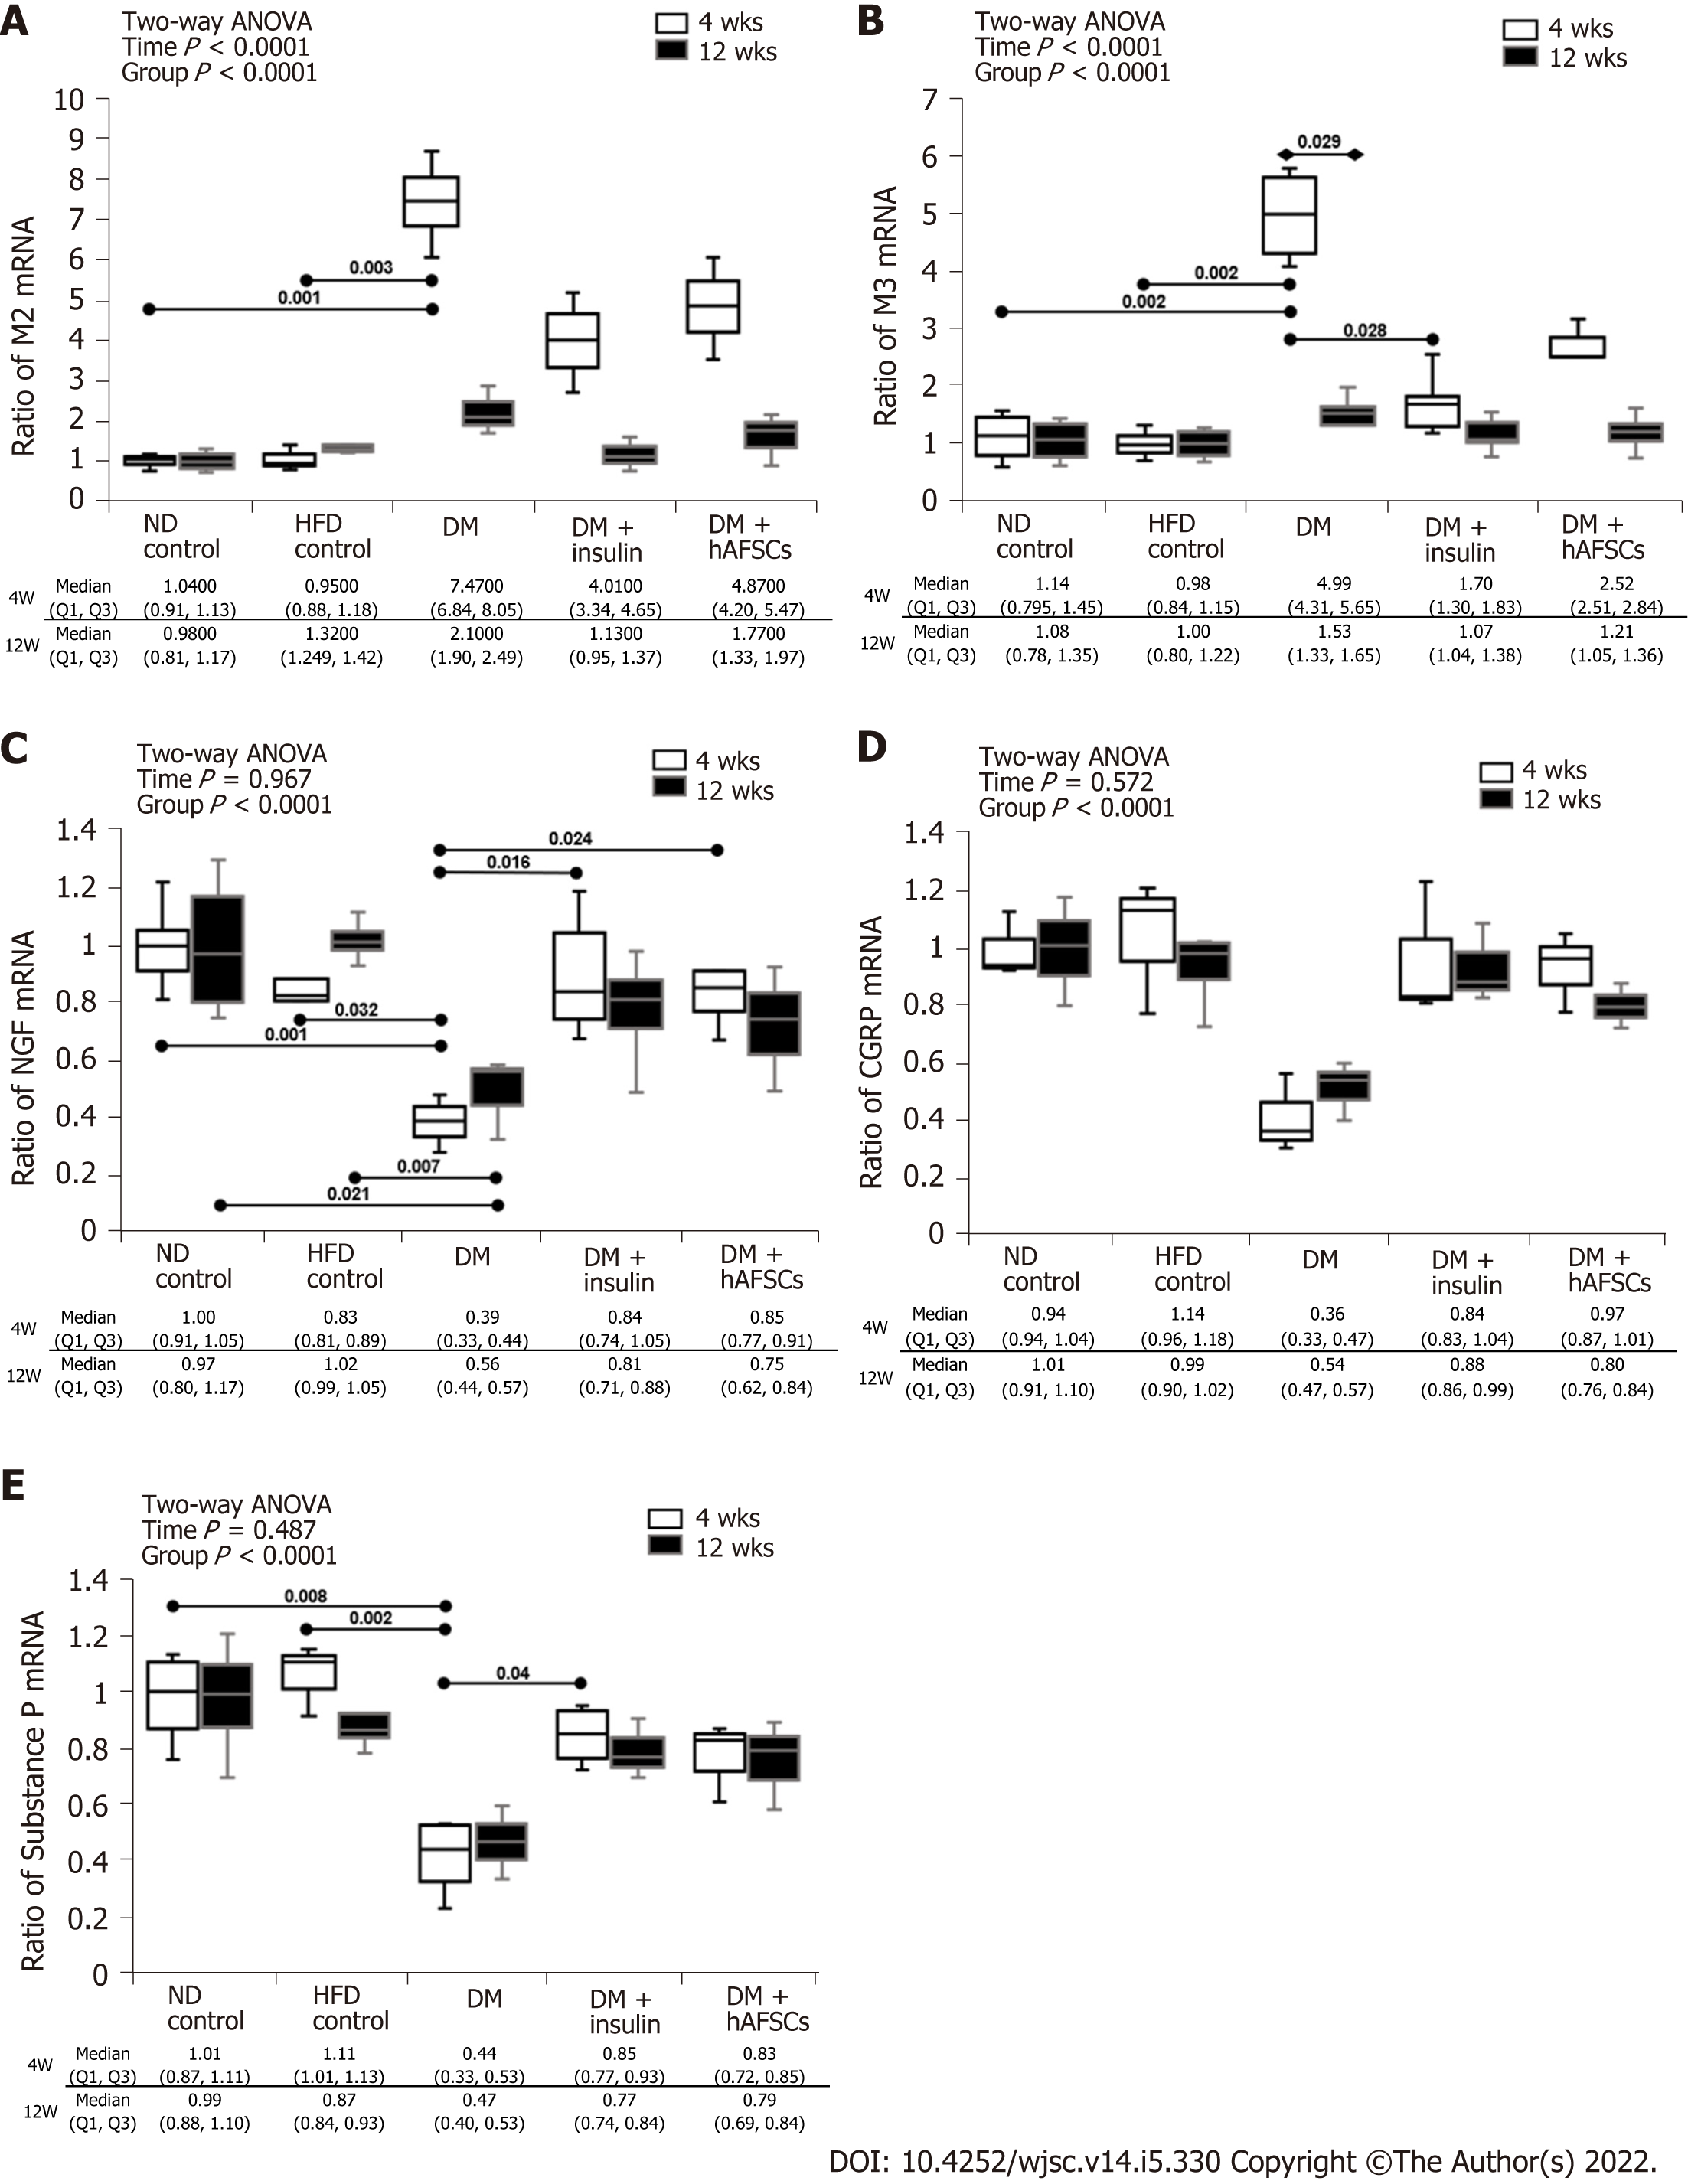
Figure 3 Relative mRNA expression.
In diabetes (DM) rats, the M3 mRNA expression was increased at 4 wk compared with 12 wk and the M2/M3 mRNA expression at 4 wk was increased compared with normal diet (ND)/high-fat diet (HFD) control groups. The M3 mRNA recovered at 4 wk after insulin treatment. The DM rats had significantly decreased mRNA expression of nerve growth factor (NGF) at 4 and 12 wk and substance P at 4 wk compared with ND/HFD controls. Insulin treatment can recover the mRNA expression of NGF and substance P, and hAFSCs treatment can recover the mRNA expression of NGF at 4 wk after DM induction. n = 6. Statistics: Median with first and third quartile (Q1, Q3) for continuous variables. Two-way analysis of variance was used for initial analysis. Kruskal-Wallis test with post hoc Bonferroni test for intergroup analysis. Mann-Whitney U test for the comparison between 4 wk and 12 wk. P values are shown in each comparison. A: M2-muscarinic receptor; B: M3-muscarinic receptor; C: Nerve growth factor; D: Calcitonin gene-related peptide; E: Substance P in the bladder of rats of different groups. ND: Normal diet; DM: Diabetes mellitus; hAFSCs: Human amniotic fluid stem cells; HFD: High-fat diet.
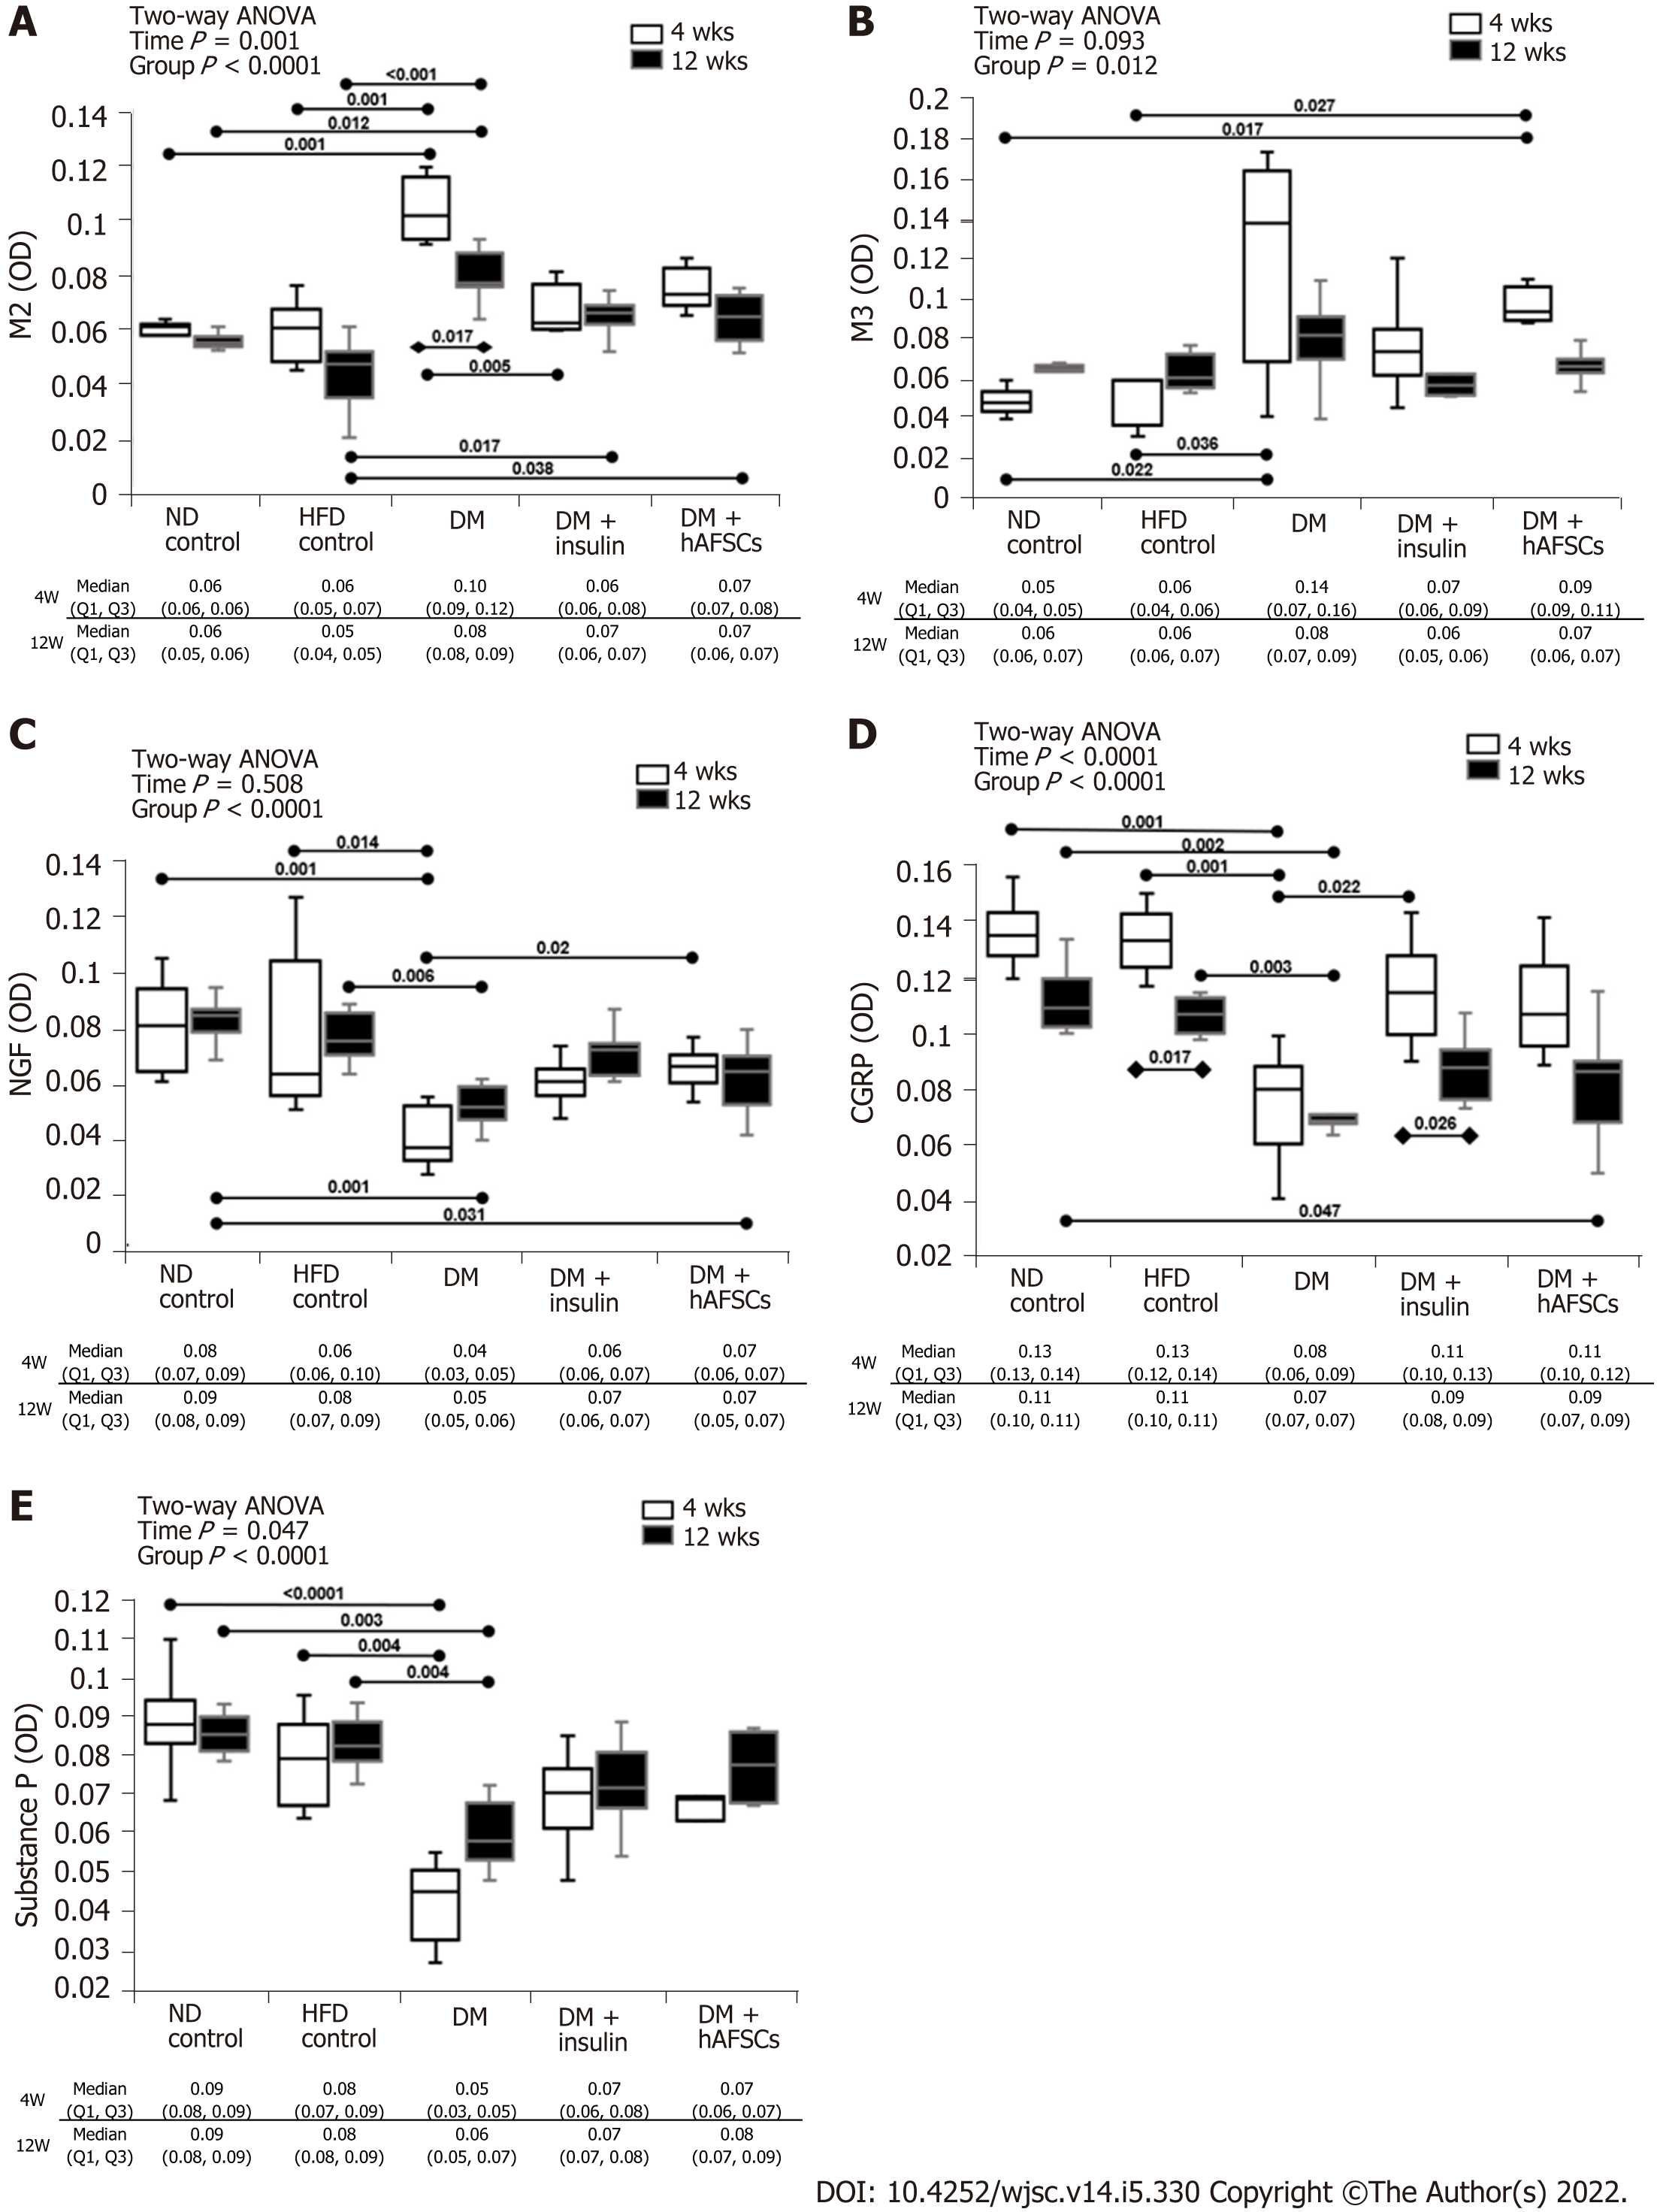
Figure 4 Immunoreactivities.
In diabetes (DM) rats, the M2 immunoreactivity was increased at 4 wk compared with 12 wk. The M2 immunoreactivity was increased at 4 and 12 wk and M3 immunoreactivity was increased at 4 wk compared with normal diet (ND)/high-fat diet (HFD) control groups. The M2 immunoreactivity recovered at 4 wk after insulin treatment. The DM rats had significantly reduced immunoreactivities to nerve growth factor (NGF), calcitonin gene-related peptide (CGRP), and substance P at 4 and 12 wk compared with ND/HFD control groups. Insulin treatment can recover CGRP immunoreactivity and human amniotic fluid stem cells treatment can recover NGF immunoreactivity at 4 wk after DM induction. n = 6. Statistics: Median with first and third quartile (Q1, Q3) for continuous variables. Two-way analysis of variance was used for initial analysis. Kruskal-Wallis test with post hoc Bonferroni test for intergroup analysis. Mann-Whitney U test for the comparison between 4 wk and 12 wk. P values are shown in each comparison. A: M2-muscarinic receptor; B: M3-muscarinic receptor; C: Nerve growth factor; D: Calcitonin gene-related peptide; E: Substance P in the bladder of rats of different groups. ND: Normal diet; DM: Diabetes mellitus; hAFSCs: Human amniotic fluid stem cells; HFD: High-fat diet.
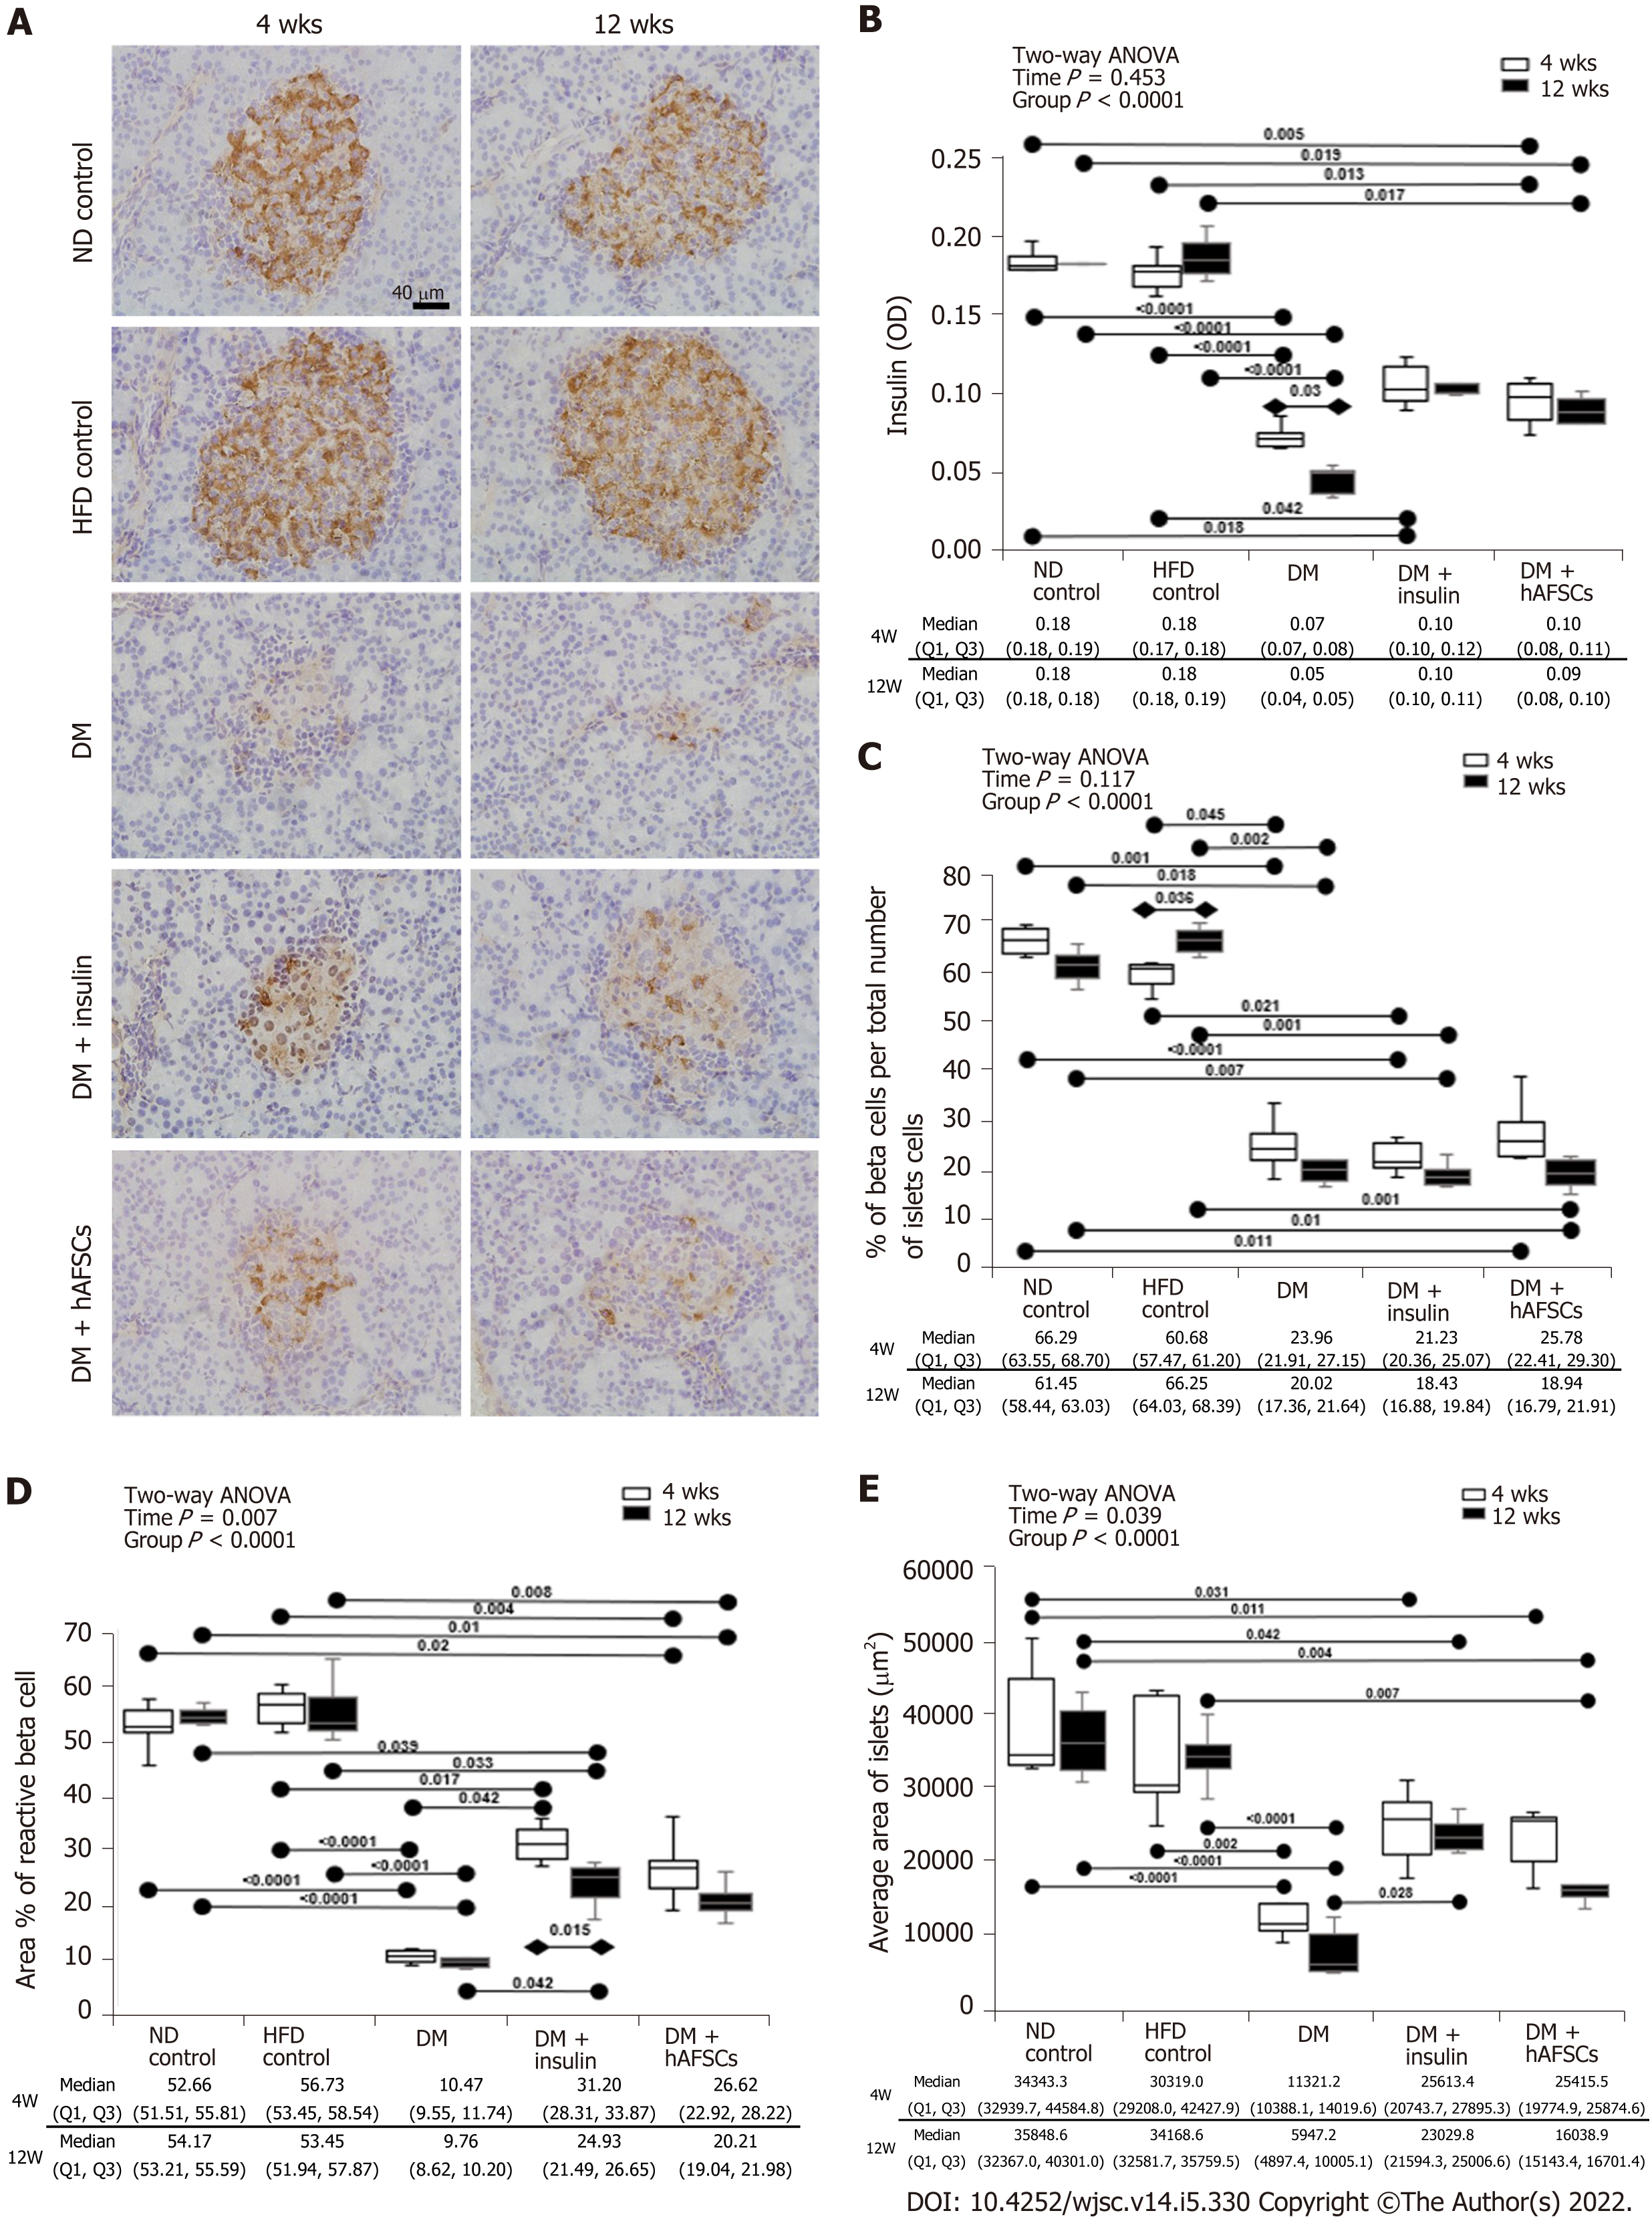
Figure 5 Insulin immunoreactivity in different groups.
Insulin immunoreactivity was decreased in the pancreatic islets of diabetes (DM) rat at 4 and 12 wk. There were also decreased beta cells per total number of islets cells, decreased area of reactive beta cell, and decreased average area of islets at 4 and 12 wk in DM rats. Insulin treatment can recover the area of reactive beta cells at 4 and 12 wk and the average area of islets at 12 wk. However, human amniotic fluid stem cells therapy did not show any effect after DM induction. n = 6. Statistics: Median with first and third quartile (Q1, Q3) for continuous variables. Two-way analysis of variance was used for initial analysis. Kruskal-Wallis test with post hoc Bonferroni test for intergroup analysis. Mann-Whitney U test for the comparison between 4 wk and 12 wk. P values are shown in each comparison. A: Insulin immunoreactivity in the pancreas; B: Immunoreactivity ratio of insulin using optical density; C: Percentage of beta cells per total number of islets cells; D: Area percentage of reactive beta cells; E: Average area of islets. ND: Normal diet; DM: Diabetes mellitus; hAFSCs: Human amniotic fluid stem cells; HFD: High-fat diet.
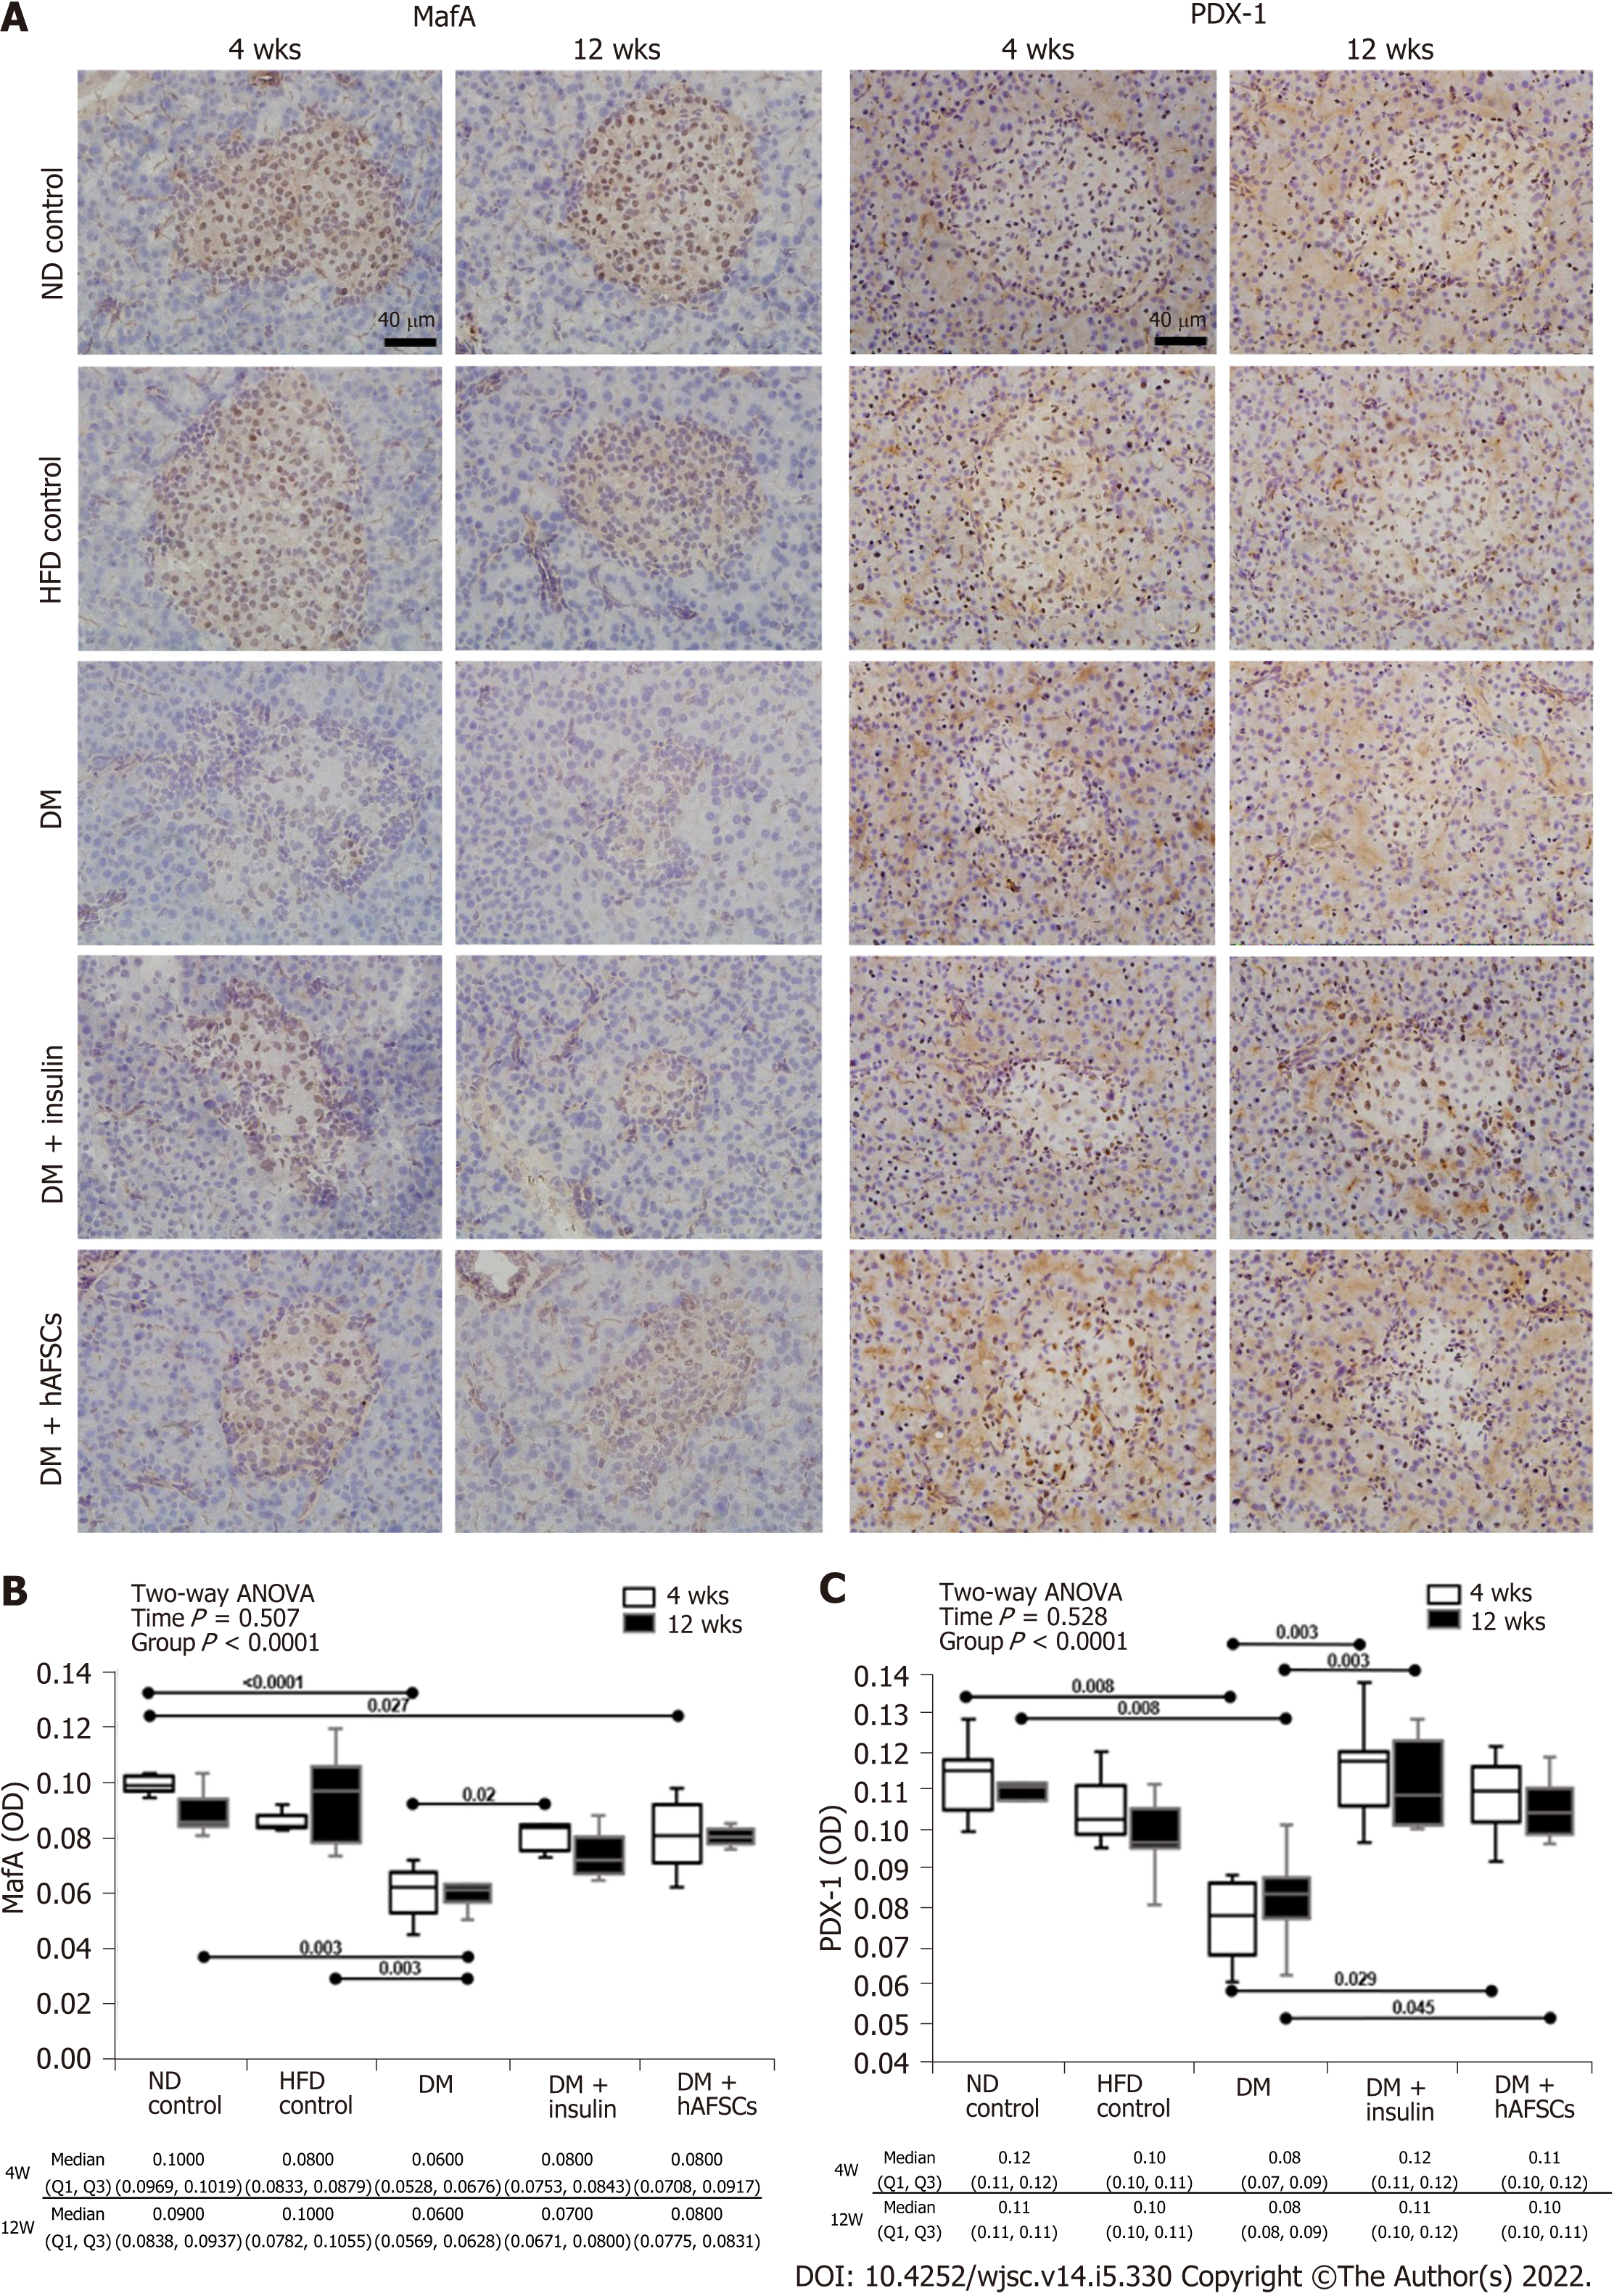
Figure 6 Immunoreactivity to Maf family of transcription factors and pancreatic transcription factor in the bladder of rats of different groups.
The immunoreactivity to MafA and pancreatic transcription factor (PDX-1) in the pancreatic islets was decreased at 4 and/or 12 wk after DM induction. Insulin treatment can recover MafA immunoreactivity at 4 wk and PDX-1 immunoreactivity at 4 and 12 wk. However, human amniotic fluid stem cells treatment can only recover PDX-1 immunoreactivity at 4 and 12 wk after diabetes induction. n = 6. Statistics: Median with first and third quartile (Q1, Q3) for continuous variables. Two-way analysis of variance was used for initial analysis. Kruskal-Wallis test with post hoc Bonferroni test for intergroup analysis. Mann-Whitney U test for the comparison between 4 wk and 12 wk. P values are shown in each comparison. A: Maf and pancreatic transcription factor (PDX-1) immunoreactivity in the pancreas; B: Immunoreactivity ratio of Maf using optical density; C: Immunoreactivity ratio of PDX-1 using optical density. ND: Normal diet; DM: Diabetes mellitus; hAFSCs: Human amniotic fluid stem cells; HFD: High-fat diet; PDX-1: Pancreatic transcription factor 1.
- Citation: Liang CC, Shaw SW, Huang YH, Lee TH. Human amniotic fluid stem cell therapy can help regain bladder function in type 2 diabetic rats. World J Stem Cells 2022; 14(5): 330-346
- URL: https://www.wjgnet.com/1948-0210/full/v14/i5/330.htm
- DOI: https://dx.doi.org/10.4252/wjsc.v14.i5.330


