Copyright
©The Author(s) 2020.
World J Stem Cells. Jul 26, 2020; 12(7): 633-658
Published online Jul 26, 2020. doi: 10.4252/wjsc.v12.i7.633
Published online Jul 26, 2020. doi: 10.4252/wjsc.v12.i7.633
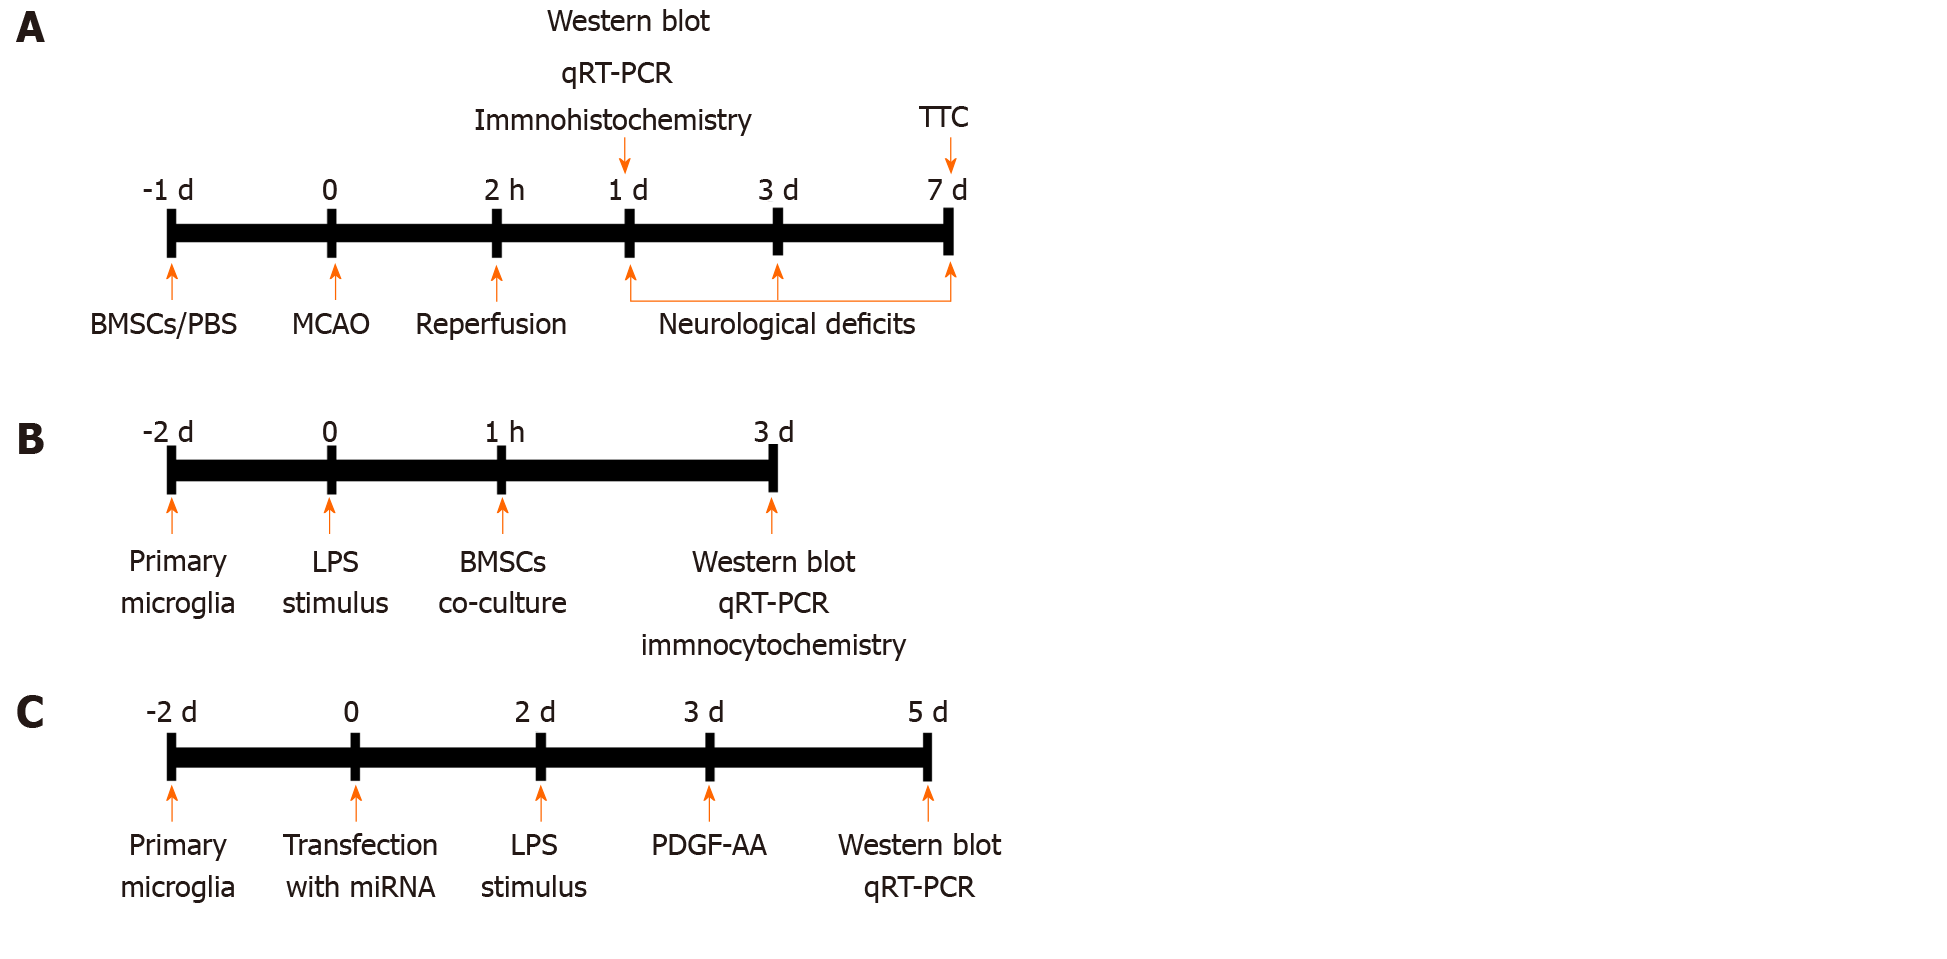
Figure 1 Experimental design.
A: In vivo experiments. Bone marrow mesenchymal stem cells (BMSCs) or PBS were infused into the right striatum 1 d before MCAO. Animals were killed at 1 d for analysis by Western blot, qRT-PCR, and immunohistochemistry. Neurological function tests were evaluated at 1, 3, and 7 d post-stroke. Rats were killed at 7 d for TTC staining and measurement of infarct volume. B and C: In vitro experiments. Primary microglial cells were cultured for 2 d and exposed to 100 ng/mL LPS followed by indirect (Transwell) BMSCs coculture. After 2 d, cocultures were analyzed by Western blot, qRT-PCR, and immunocytochemistry (B). Cultured HAPI cells were transfected with miR-mimics, anti-miR, or corresponding negative control oligonucleotides for 24 h. PDGF-AA was added to the culture medium of HAPI cells pretreated with 100 ng/mL LPS for 24 h. After 2 d, cells were collected for Western blot and qRT-PCR (C). BMSCs: Bone marrow mesenchymal stem cells; PBS: Phosphate-buffered saline; MCAO: Middle cerebral artery occlusion; qRT-PCR: Real-time quantitative reverse transcription-polymerase chain reaction; TTC: 2,3,5-triphenylterazolium chloride; LPS: Lipopolysaccharide; PDGF-AA: Platelet-derived growth factor-AA.
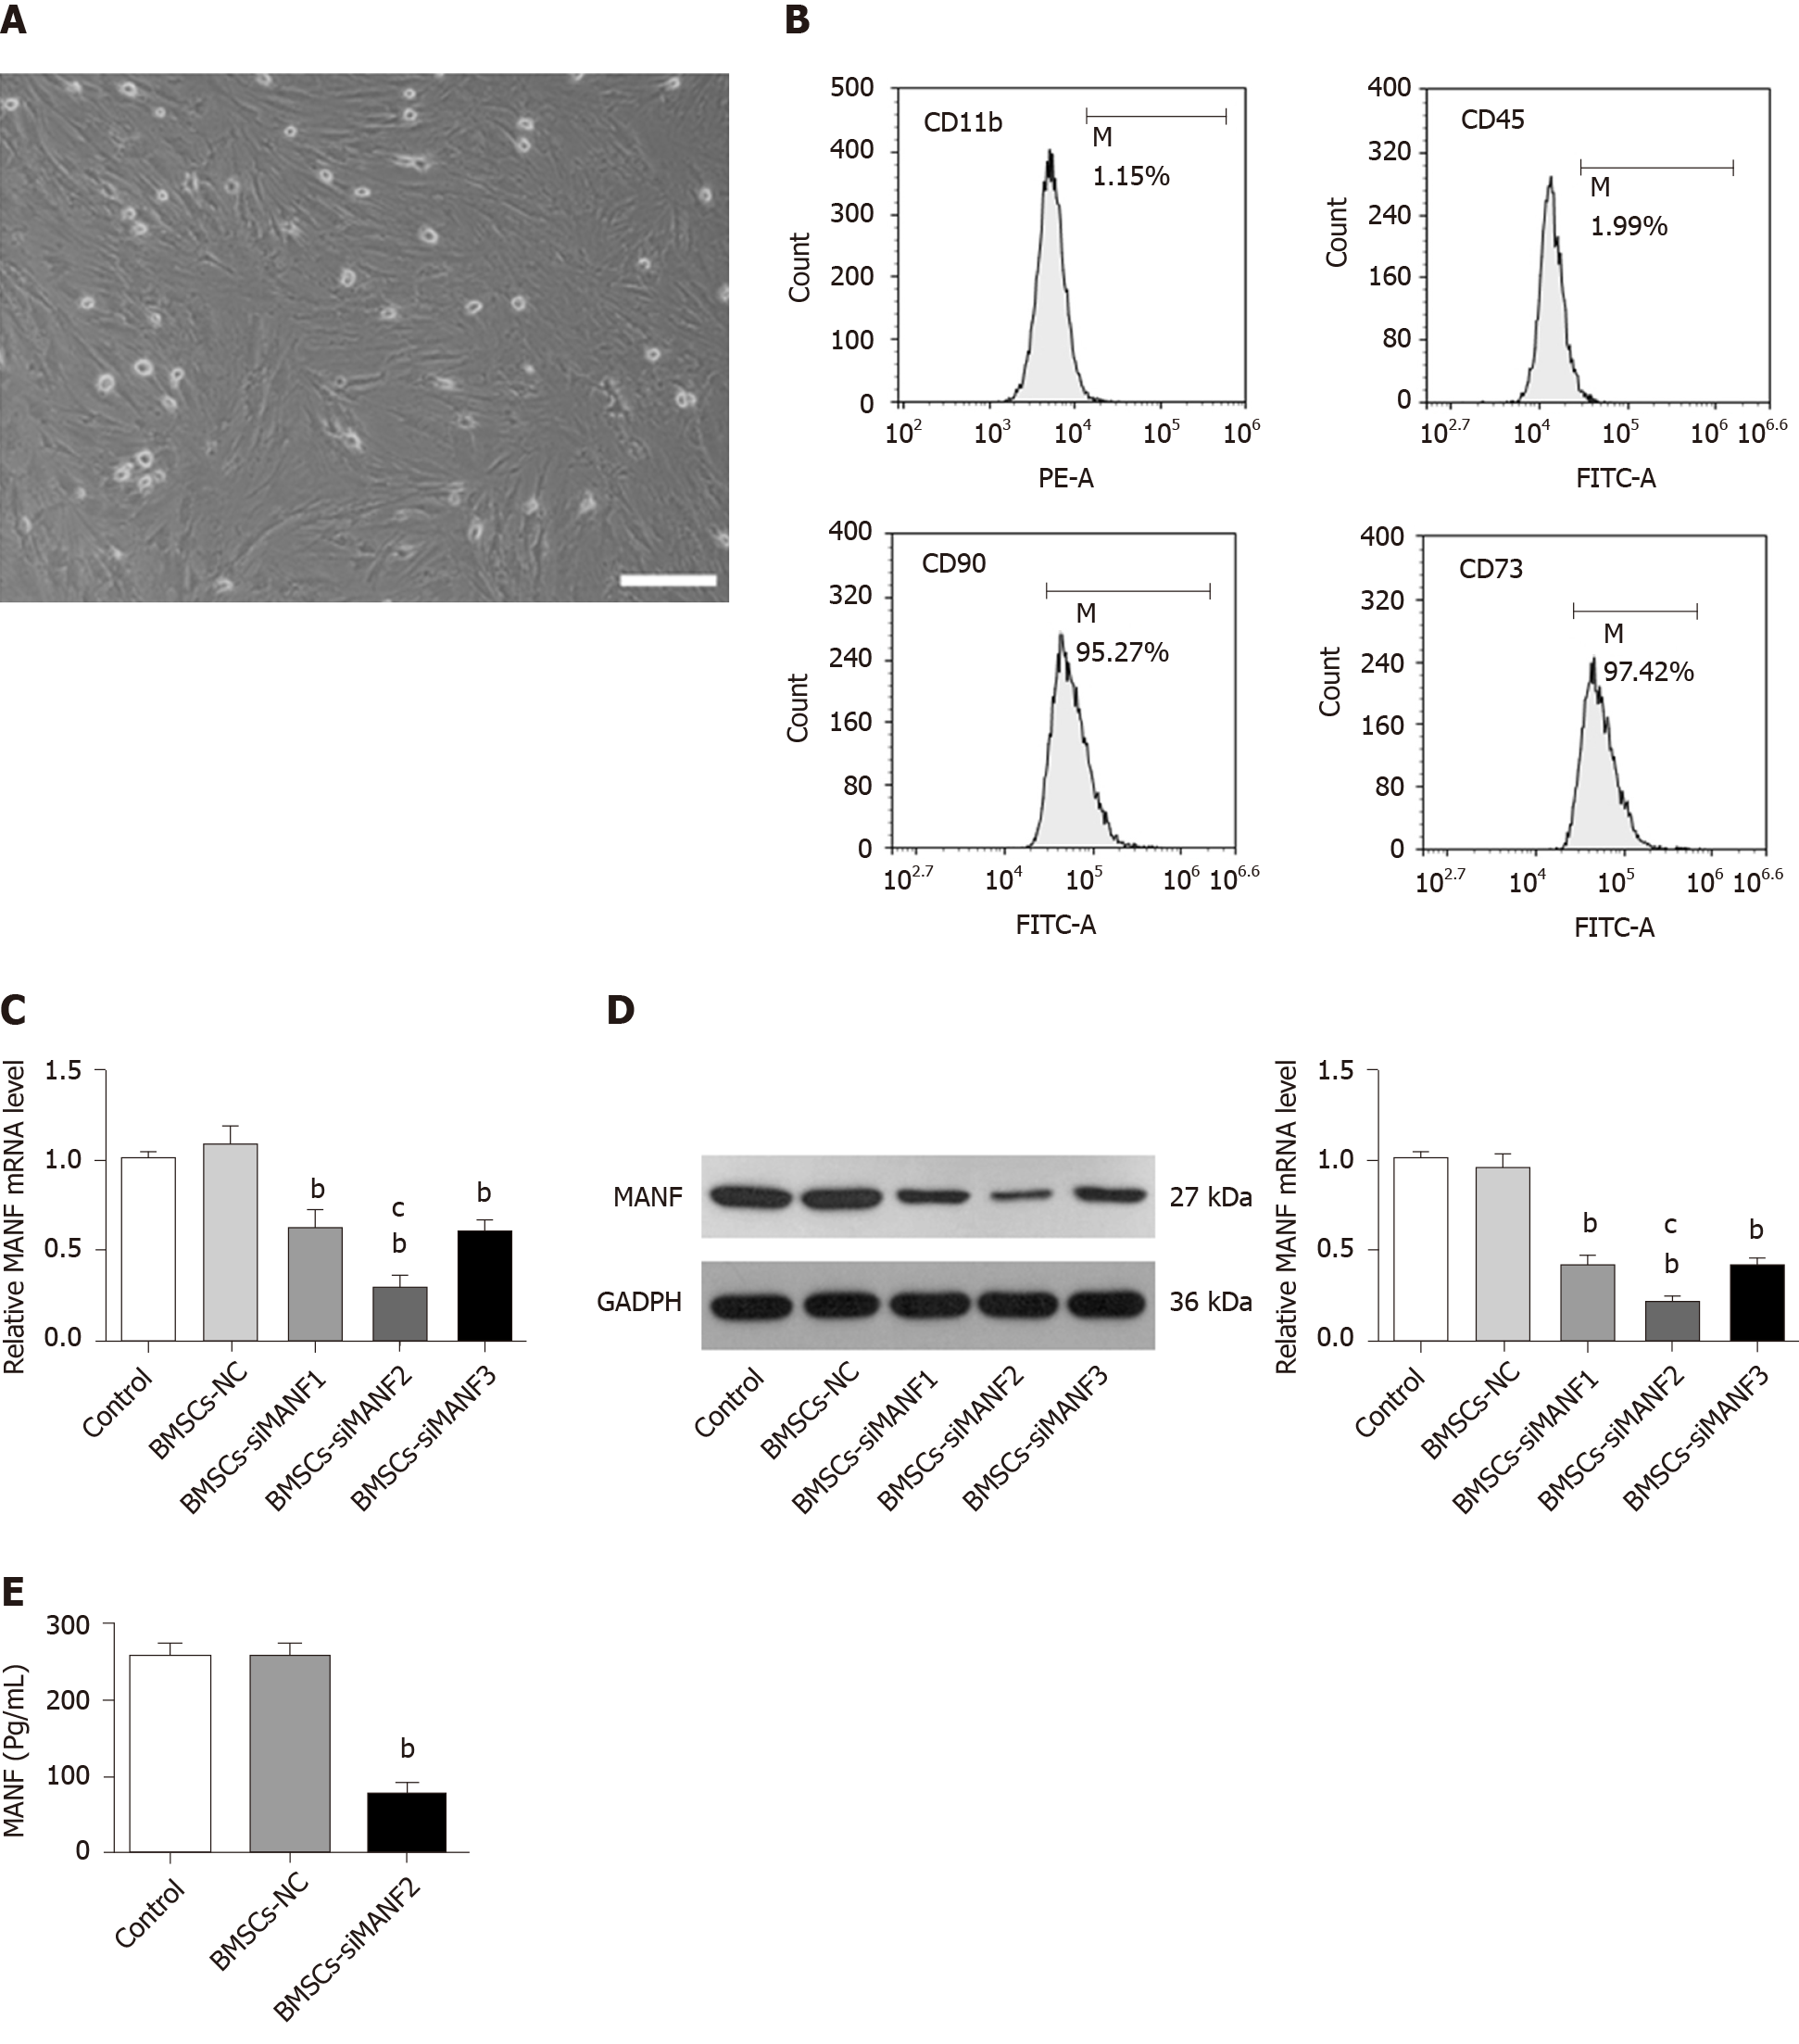
Figure 2 Construction of genetically modified bone marrow mesenchymal stem cells.
A: Cultured bone marrow mesenchymal stem cells (BMSCs) were homogeneous in size and morphology. Scale bar = 500 μm; B: Flow cytometry for detection of BMSCs surface markers; C and D: qRT-PCR (C) and Western blot analysis (D) of MANF levels in BMSCs transfected with MANF-siRNA or NC. E: ELISA of MANF in culture medium of BMSCs. bP < 0.01 vs Control and BMSCs-NC groups; cP < 0.05 vs BMSCs-siMNAF1 and BMSCs-siMANF3 groups. The values are expressed as the mean ± SD (n=6). MANF: Mesencephalic astrocyte–derived neurotrophic factor; GAPDH: Glyceraldehyde-3-phosphate dehydrogenase; BMSCs: Bone marrow mesenchymal stem cells; BMSCs-NC: Negative control-transfected BMSCs; BMSCs-siMANF: MANF siRNA-transfected BMSCs.
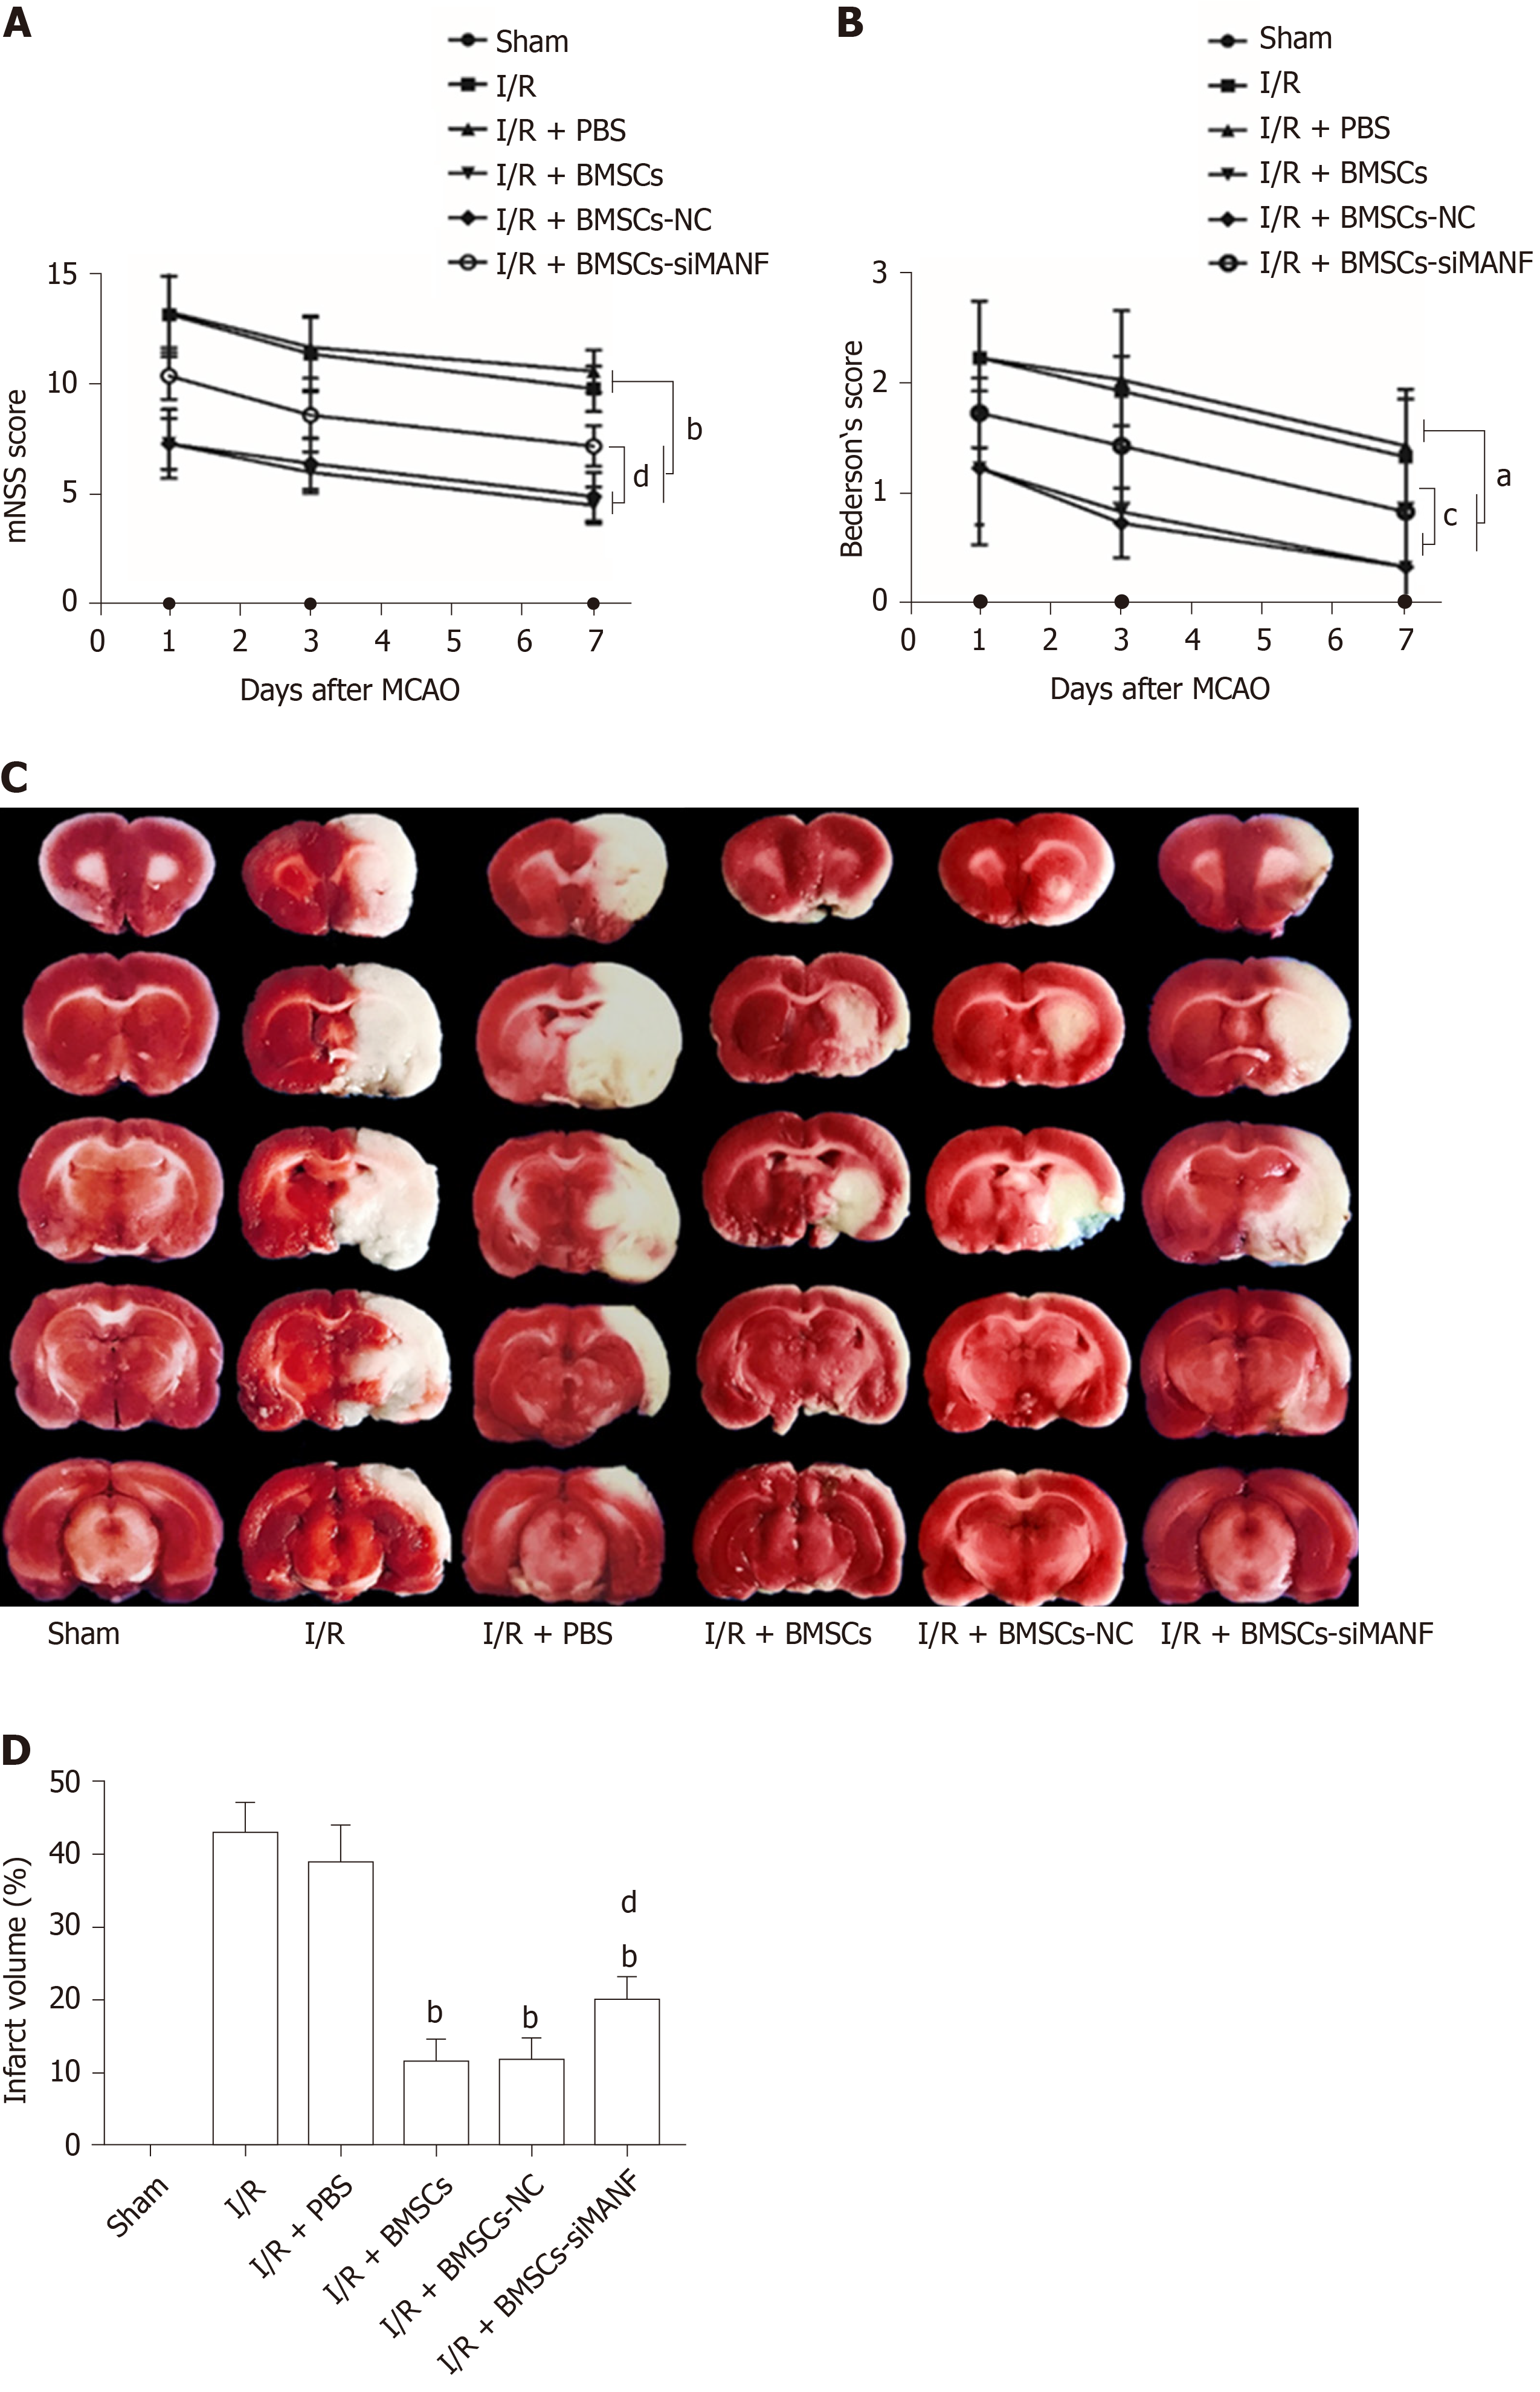
Figure 3 Effects of mesencephalic astrocyte–derived neurotrophic factor on post-stroke recovery and infarction volume in cerebral I/R rats treated with bone marrow mesenchymal stem cells.
A and B: mNSS (A) and Bederson’s (B) score evaluation of the behavior of rats on days 1, 3, and 7 after MCAO surgery; C and D: TTC staining (C) and quantitative analysis (D) of lesion volume on day 7 post-stroke. aP < 0.05, bP < 0.01 vs I/R and I/R + PBS groups; cP < 0.05, dP < 0.01 vs I/R + BMSCs and I/R + BMSCs-NC groups. The values are expressed as the mean ± SD (n =10). MANF: Mesencephalic astrocyte–derived neurotrophic factor; mNSS: Modified neurological severity scores; I/R: Ischemia/reperfusion; MCAO: Middle cerebral artery occlusion; PBS: Phosphate-buffered saline; BMSCs: Bone marrow mesenchymal stem cells; BMSCs-NC: Negative control-transfected BMSCs; BMSCs-siMANF: MANF siRNA-transfected BMSCs.
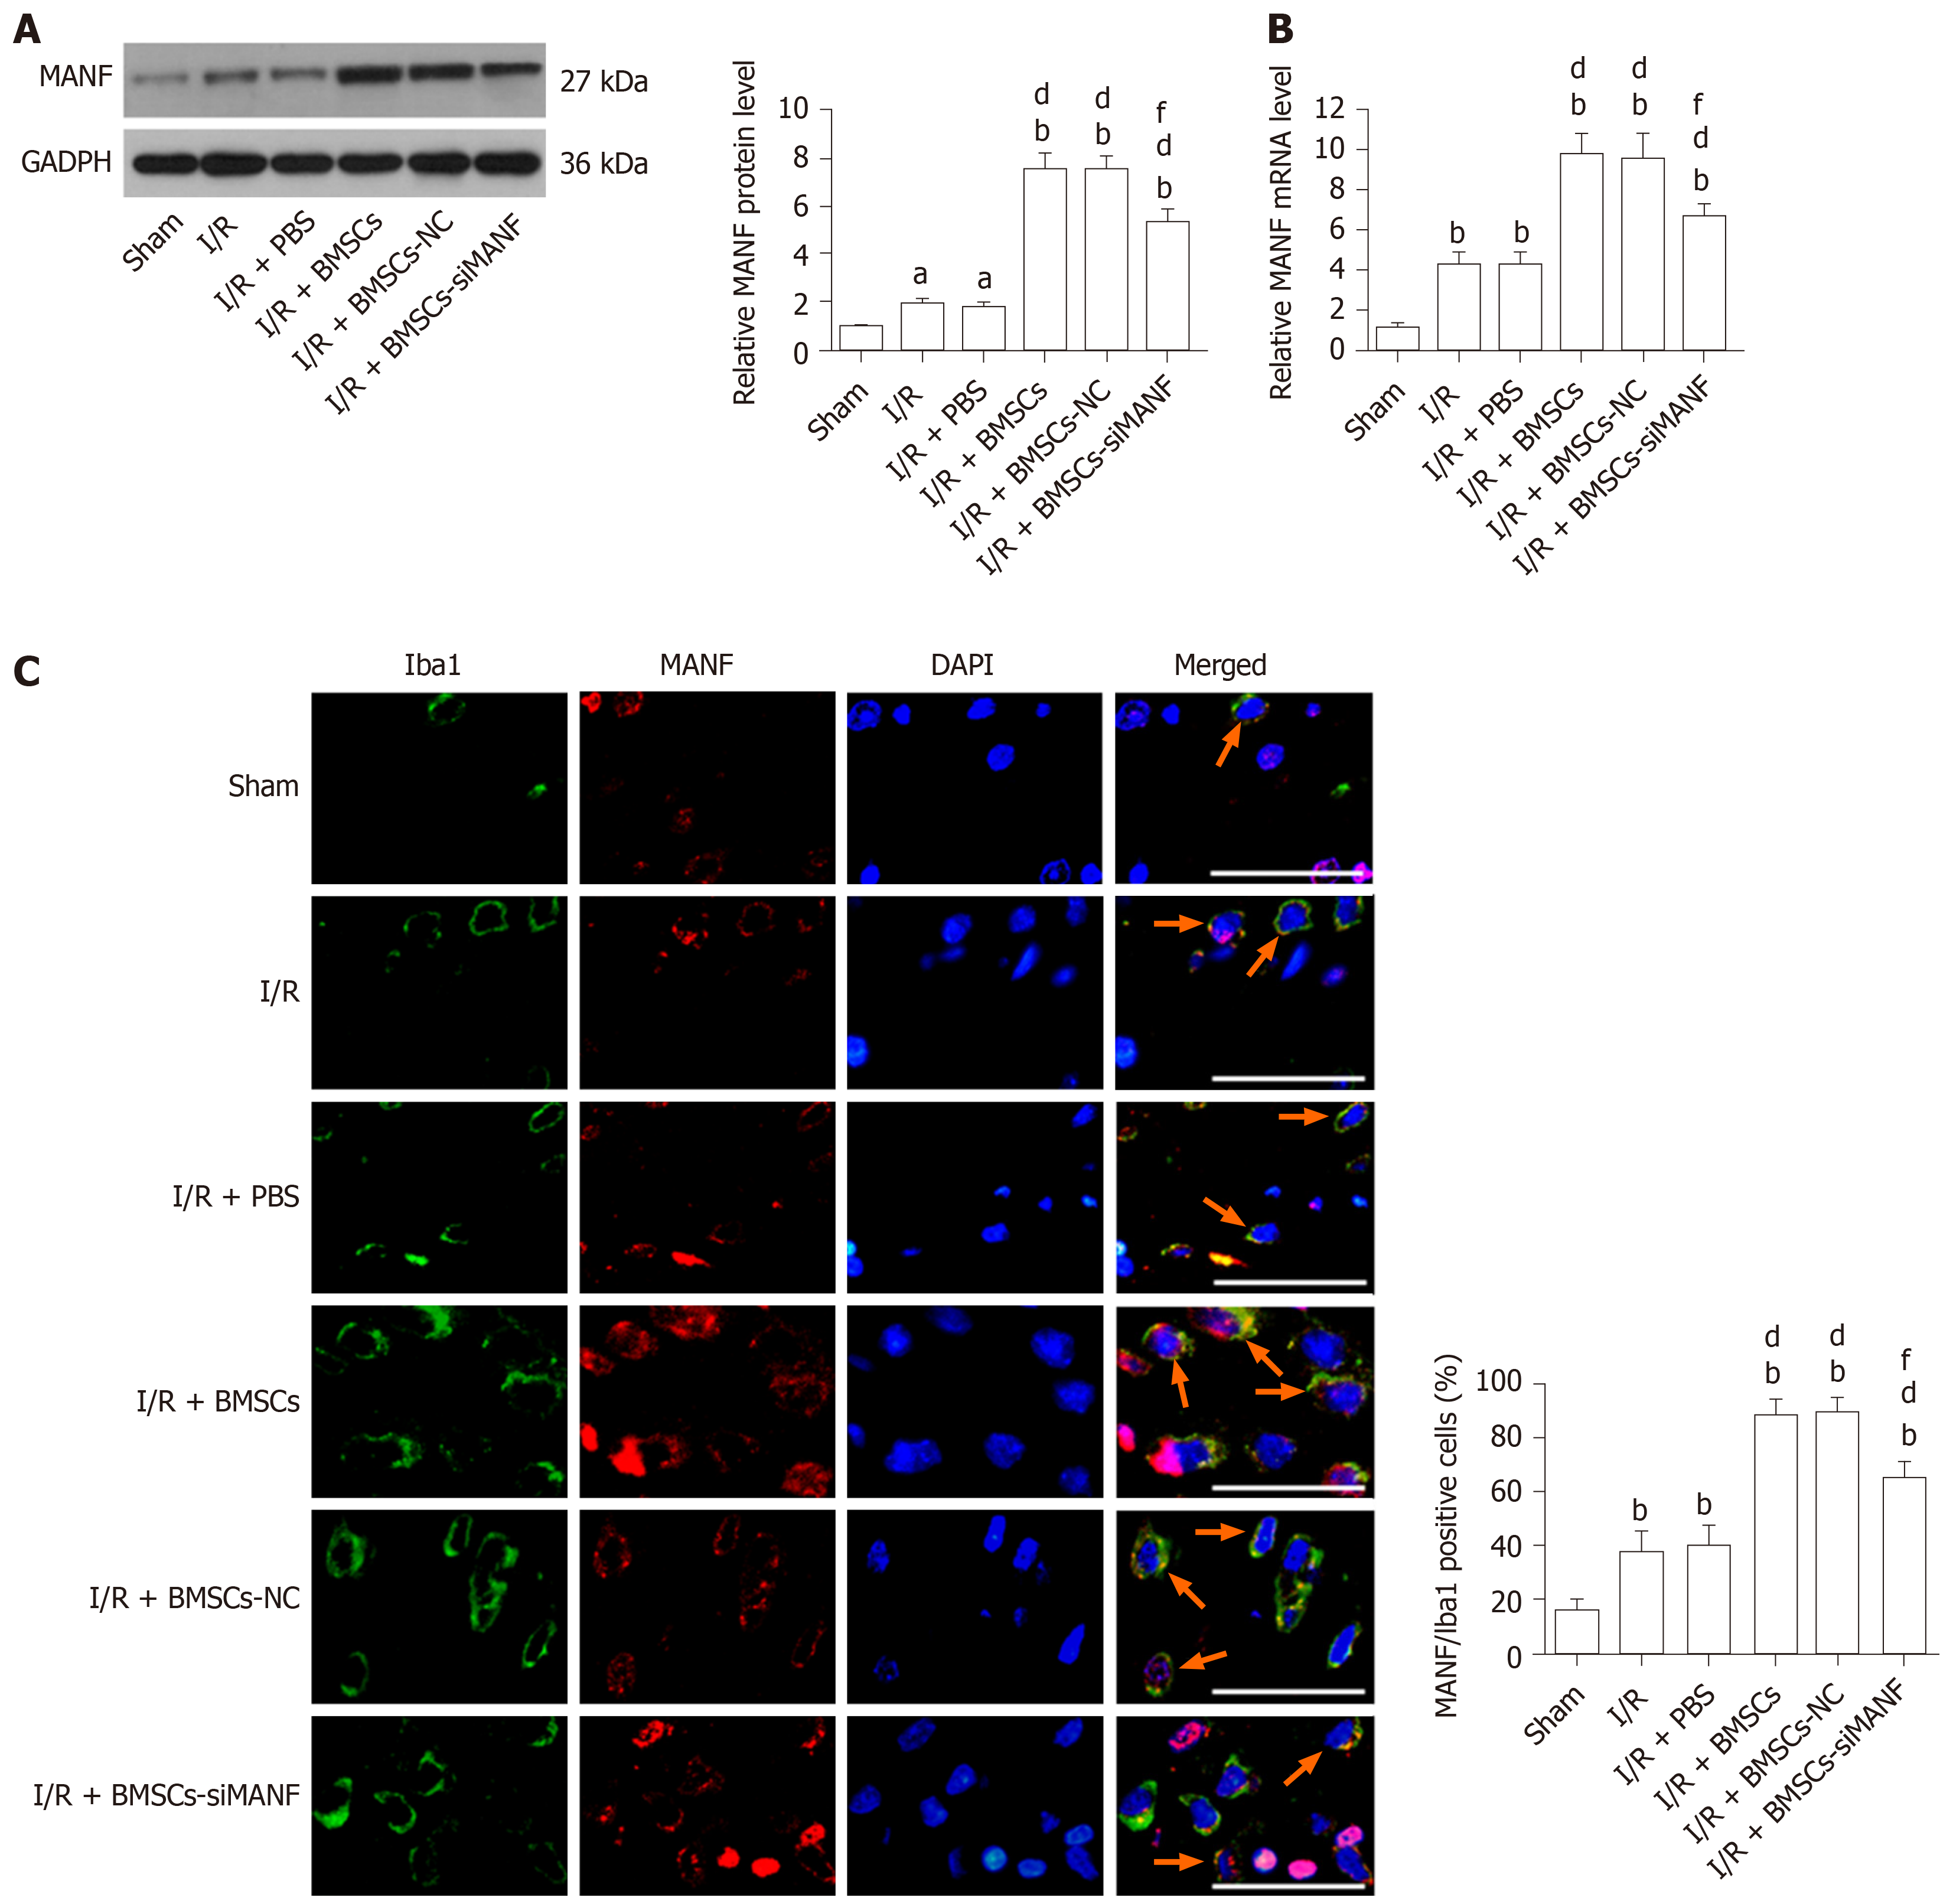
Figure 4 Mesencephalic astrocyte–derived neurotrophic factor expression in microglia/macrophages in cerebral ischemia.
A and B: Western blot (A) and qRT-PCR analysis (B) of MANF expression at 24 h after cerebral I/R injury; C: Immunohistochemical analysis of MANF expression in the microglia/macrophages of the injured brains. Representative images of immunohistochemical staining for the microglia/macrophage marker Iba1 (green) and MANF (red), with DAPI (blue) as a nuclear counterstain, are shown. aP < 0.05, bP < 0.01 vs Sham group; dP < 0.01 vs I/R and I/R + PBS groups; fP < 0.01 vs I/R + BMSCs and I/R + BMSCs-NC groups. Scale bar = 50 μm. Arrows point to the MANF+/Iba1+ cells. The values are expressed as the mean ± SD (n = 6). MANF: Mesencephalic astrocyte–derived neurotrophic factor; GAPDH: Glyceraldehyde-3-phosphate dehydrogenase; I/R: Ischemia/reperfusion; PBS: Phosphate-buffered saline; BMSCs: Bone marrow mesenchymal stem cells; BMSCs-NC: Negative control-transfected BMSCs; BMSCs-siMANF: MANF siRNA-transfected BMSCs; Iba1: Ionized calcium-binding adapter molecule; DAPI: 4'6-diamidino-2-phenylindole.
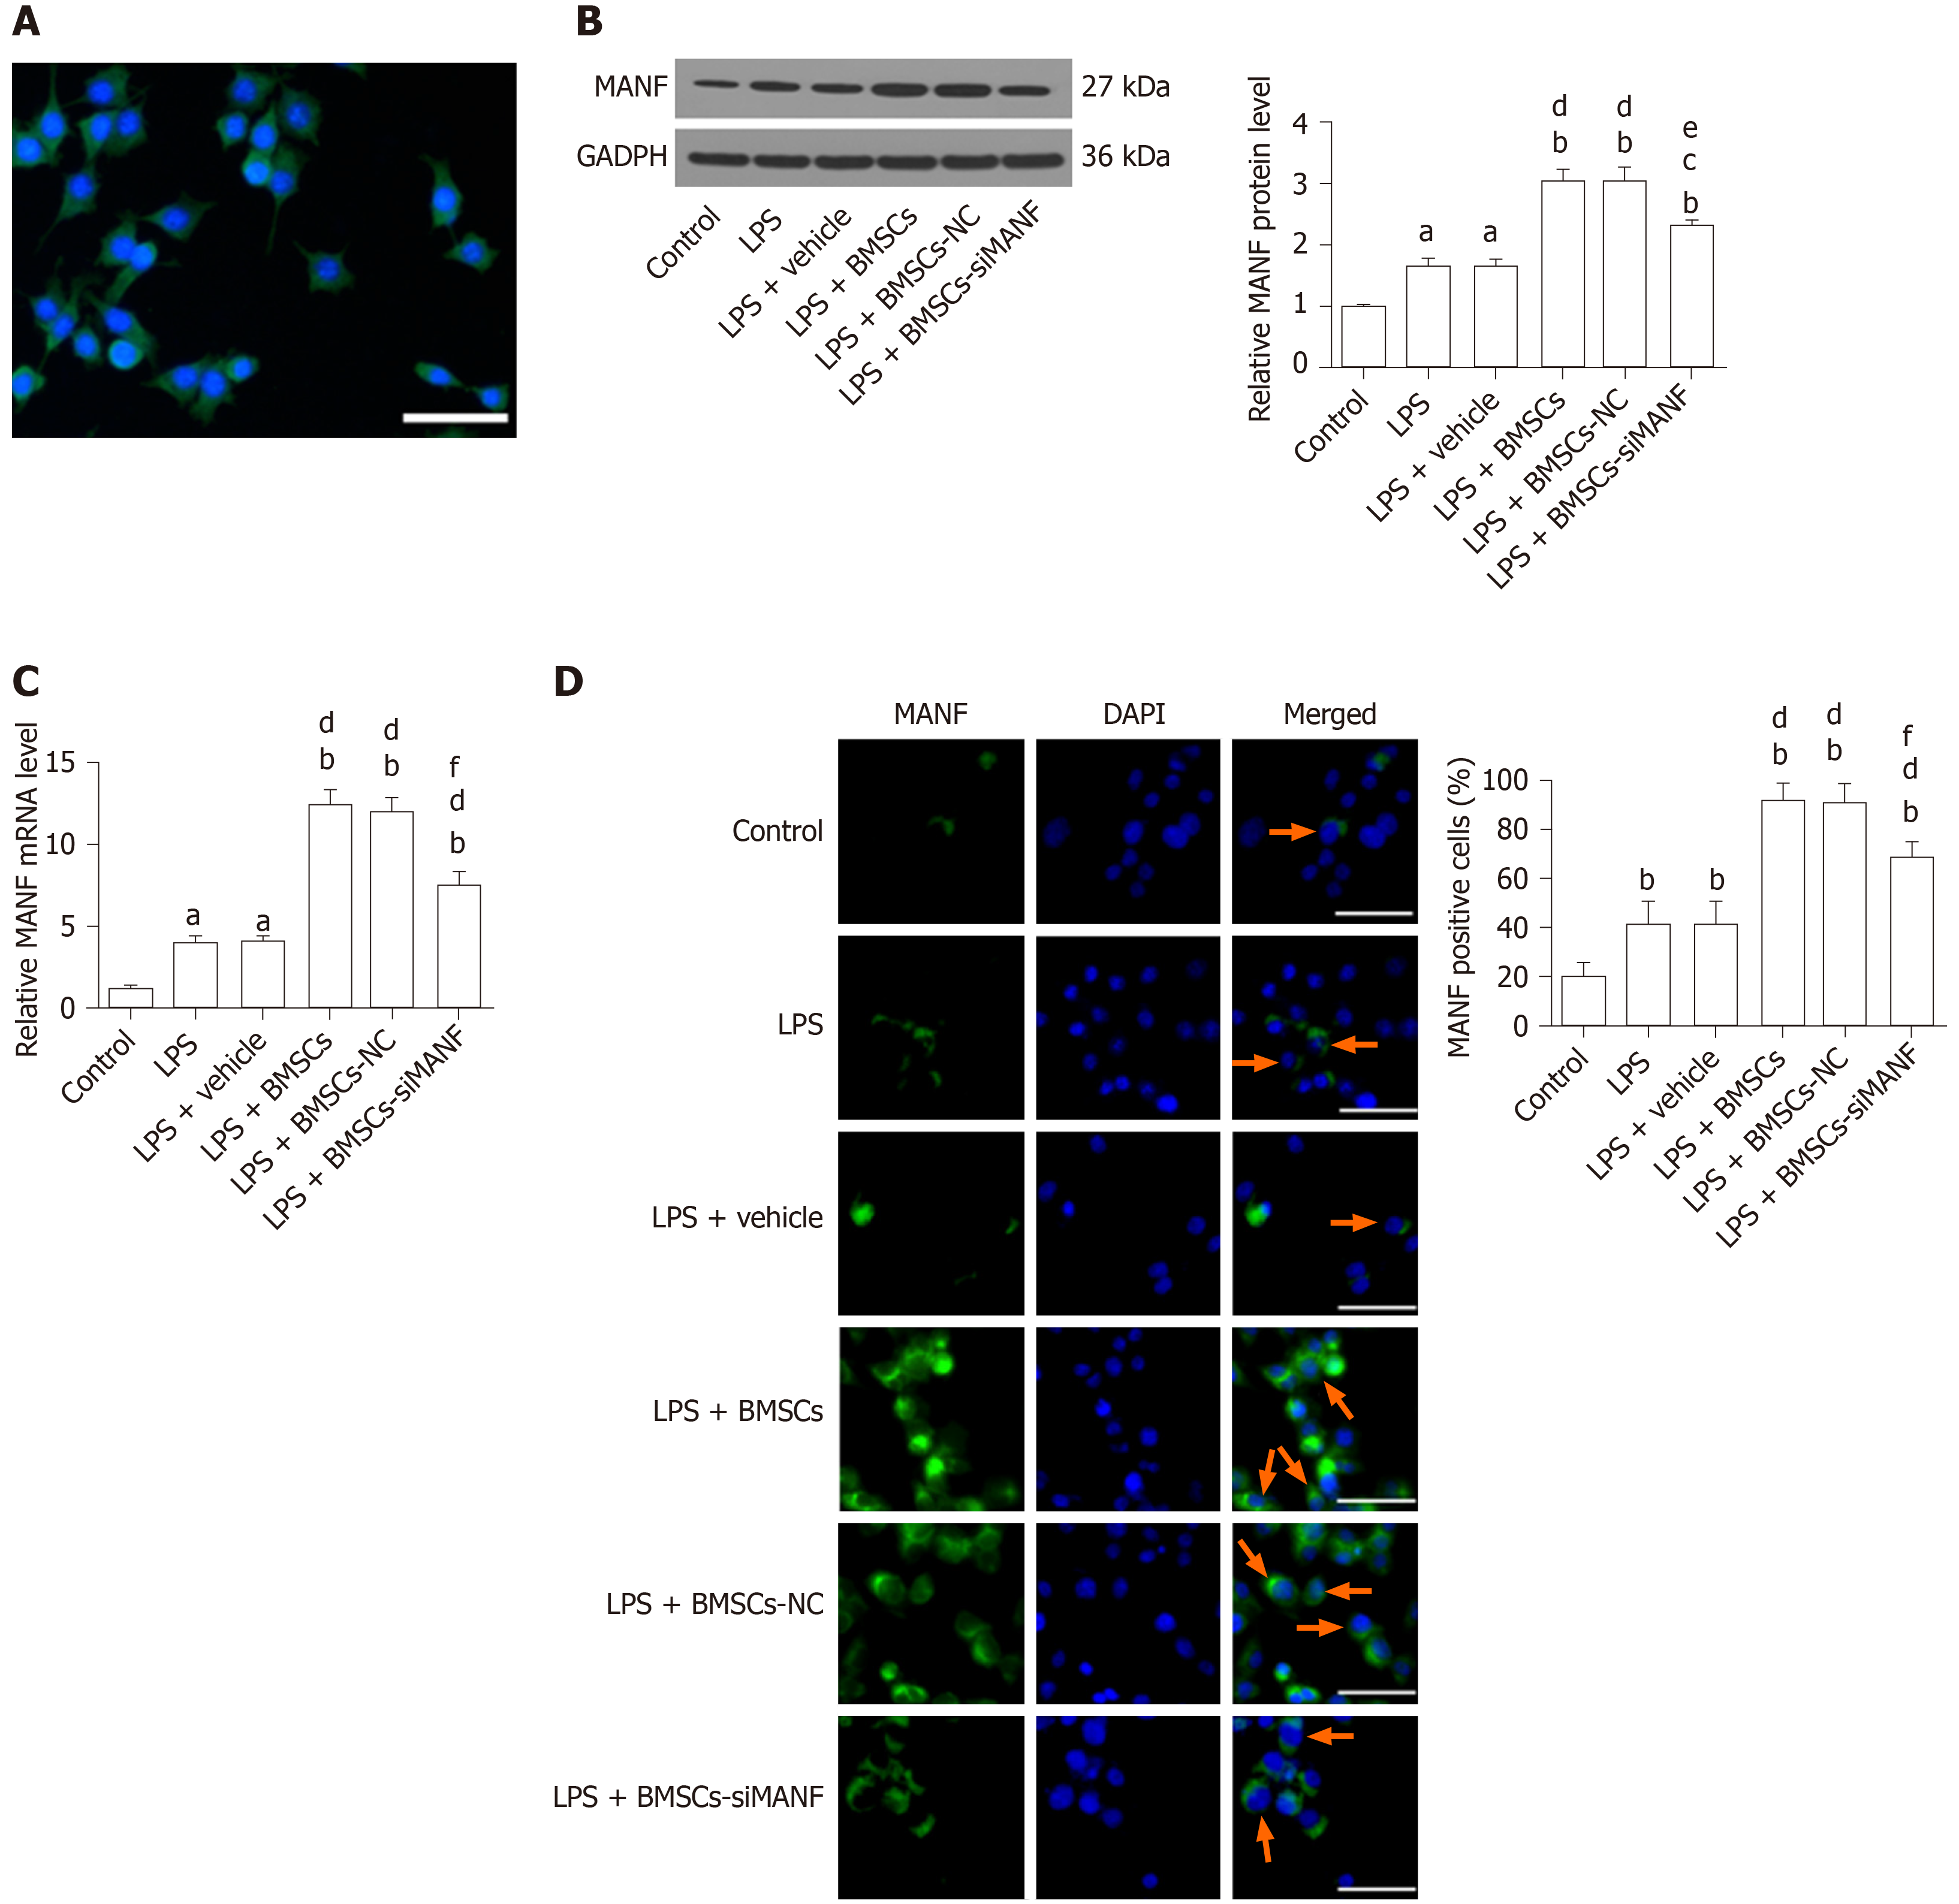
Figure 5 Mesencephalic astrocyte–derived neurotrophic factor expression in lipopolysaccharide-stimulated microglia.
A: Representative immunocytochemical staining for Iba1 (green) and co-staining for DAPI (blue) as a nuclear counterstain. Scale bar = 50 μm; B–D: Western blot (B), qRT-PCR (C), and immunocytochemistry analysis (D) of MANF expression in microglia pretreated with 100 ng/mL LPS for 24 h with or without BMSCs. Representative images of MANF (green), with DAPI (blue) as a nuclear counterstain, are shown. aP < 0.05, bP < 0.01 vs Control group; cP < 0.05, dP < 0.01 vs LPS and LPS + vehicle groups; eP < 0.05, fP < 0.01 vs LPS + BMSCs and LPS + BMSCs-NC groups. Scale bar = 50 μm. Arrows point to the MANF+ cells. The values are expressed as the mean ± SD (n = 6). MANF: Mesencephalic astrocyte–derived neurotrophic factor; GAPDH: Glyceraldehyde-3-phosphate dehydrogenase; LPS: Lipopolysaccharide; BMSCs: Bone marrow mesenchymal stem cells; BMSCs-NC: Negative control-transfected BMSCs; BMSCs-siMANF: MANF siRNA-transfected BMSCs; DAPI: 4'6-diamidino-2-phenylindole.
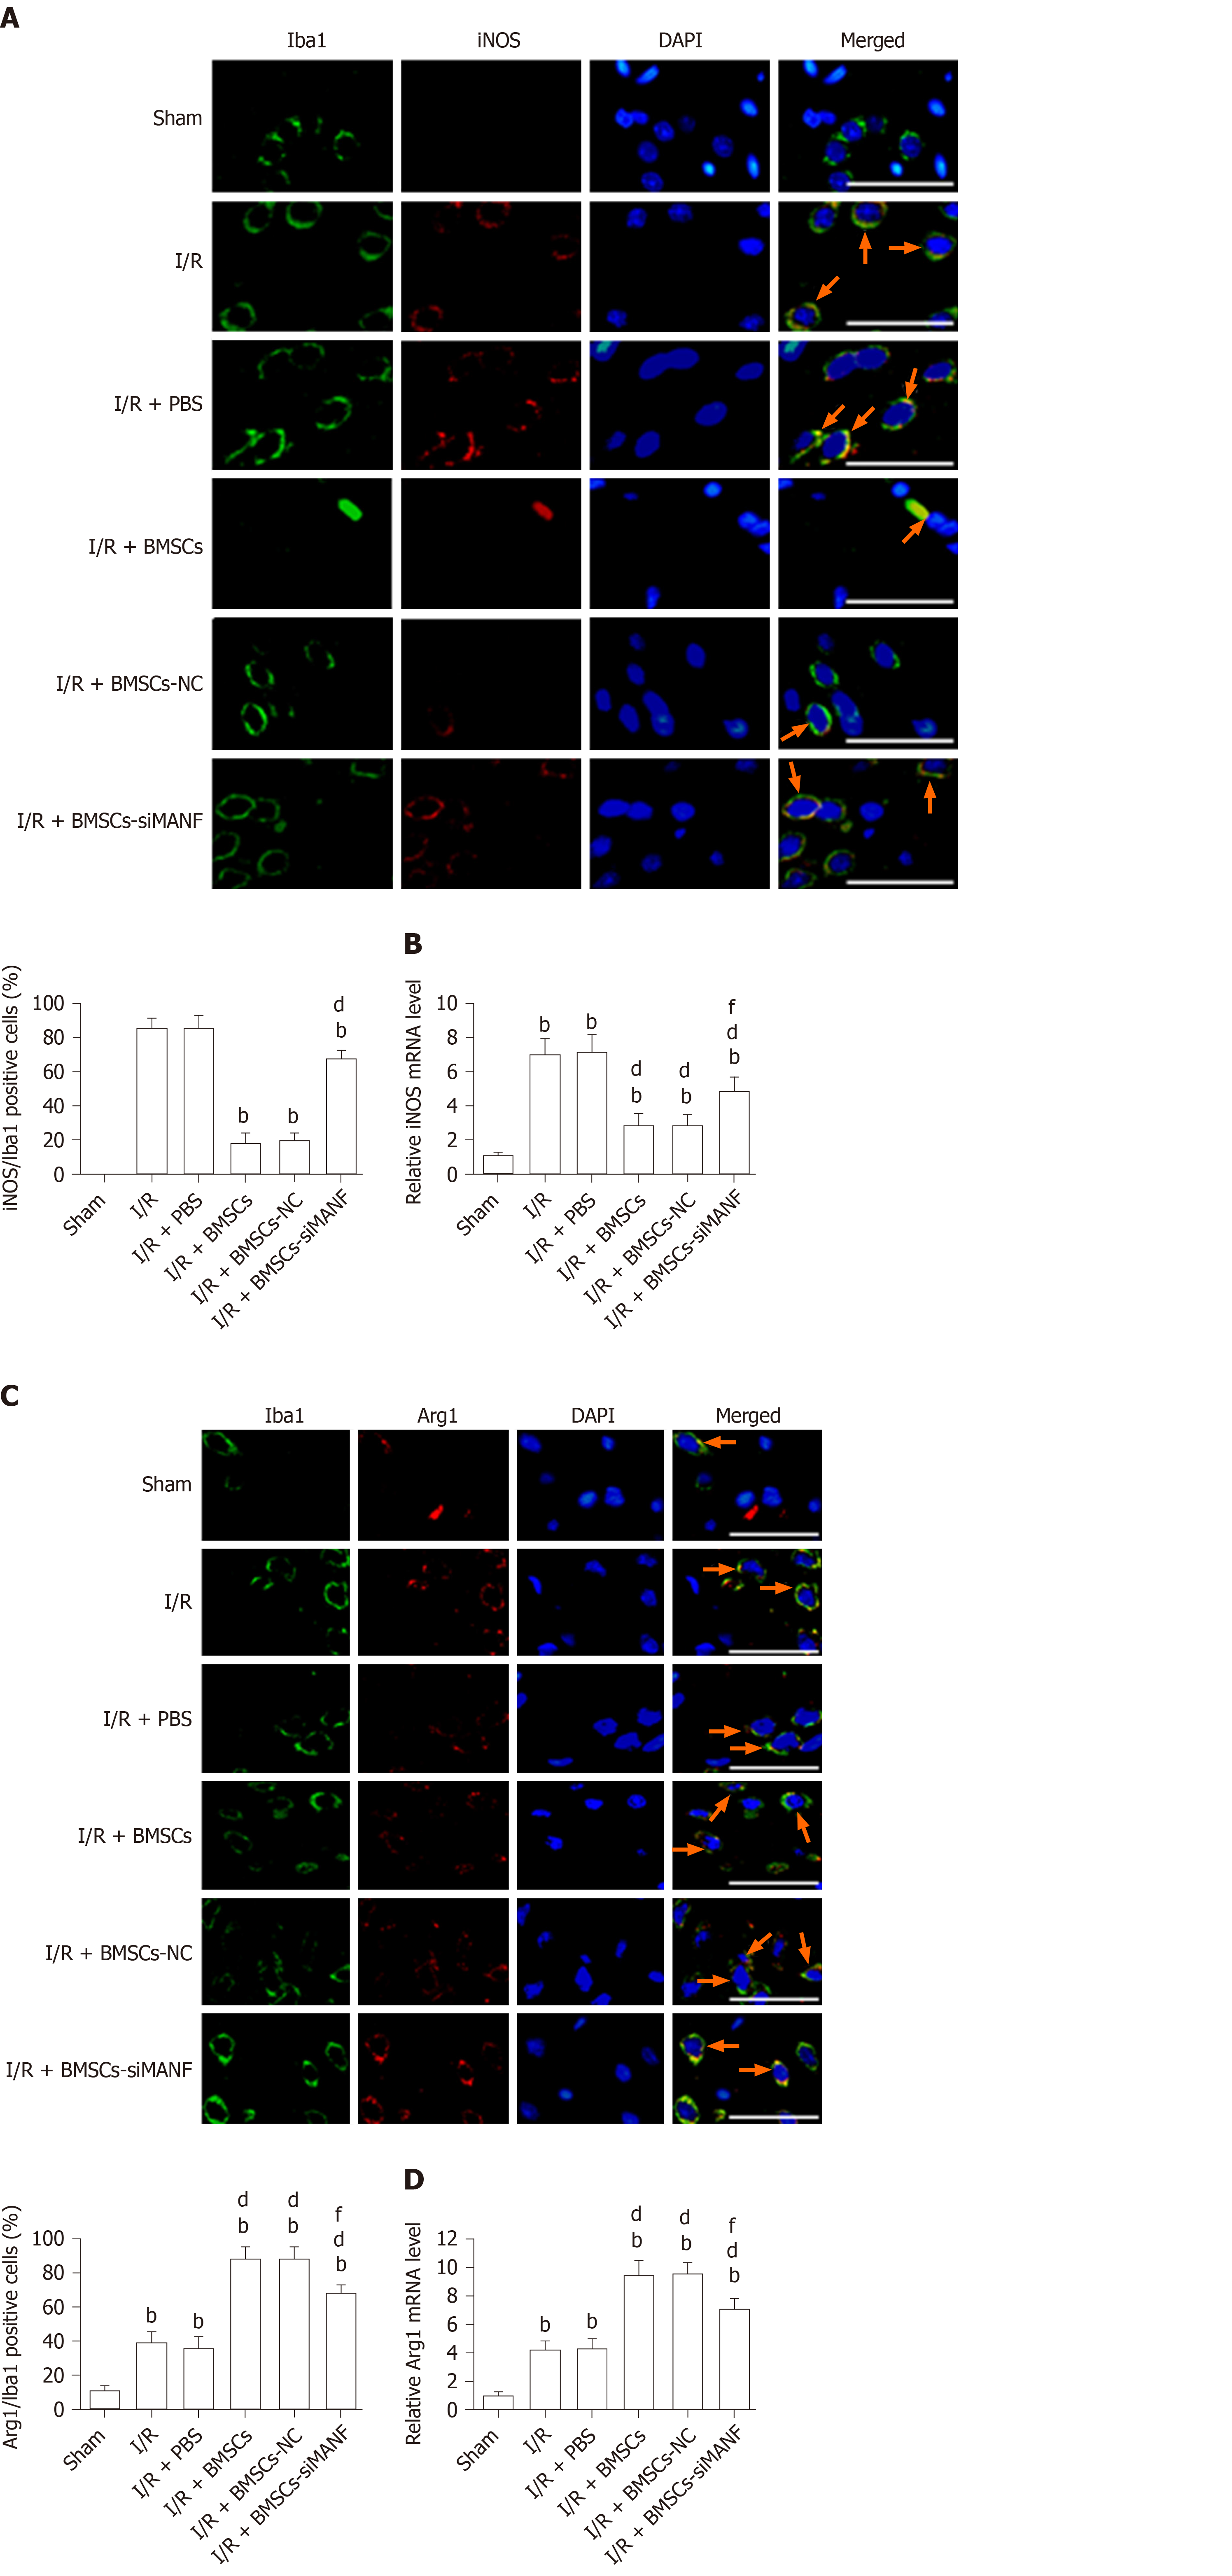
Figure 6 In vivo analysis of M1 and M2 polarization markers after cerebral I/R injury with bone marrow mesenchymal stem cell treatment.
A: Immunohistochemistry analysis of iNOS expression in the microglia/macrophages of the ischemic brain after 24 h of MCAO. Representative images of the indicated brain double stained with Iba1 (green) and iNOS (red), with DAPI (blue) as a nuclear counterstain, are shown. bP < 0.01 vs I/R and I/R + PBS groups; dP < 0.01 vs I/R + BMSCs and I/R + BMSCs-NC groups. Scale bar = 50 μm. Arrows point to the iNOS+/Iba1+ cells; B: qRT-PCR analysis of iNOS expression in acute ischemic stroke rat brains; C: Immunohistochemical analysis of Arg1 expression in the microglia/macrophages of ischemic brains. Representative images of the indicated brain double stained with Iba1 (green) and Arg1 (red), with DAPI (blue) as a nuclear counterstain, are shown. Scale bar = 50 μm. Arrows point to the Arg1+/Iba1+ cells; D: qRT-PCR analysis of Arg1 expression in rat brains at 24 h after MCAO. bP < 0.01 vs Sham group; dP < 0.01 vs I/R and I/R + PBS groups; fP < 0.01 vs I/R + BMSCs and I/R + BMSCs-NC groups. The values are expressed as the mean ± SD (n = 6). I/R: Ischemia/reperfusion; PBS: Phosphate-buffered saline; BMSCs: Bone marrow mesenchymal stem cells; BMSCs-NC: Negative control-transfected BMSCs; BMSCs-siMANF: MANF siRNA-transfected BMSCs; iNOS: Inducible nitric oxide synthase; Arg-1: Arginase-1; Iba1: Ionized calcium-binding adapter molecule; DAPI: 4'6-diamidino-2-phenylindole.
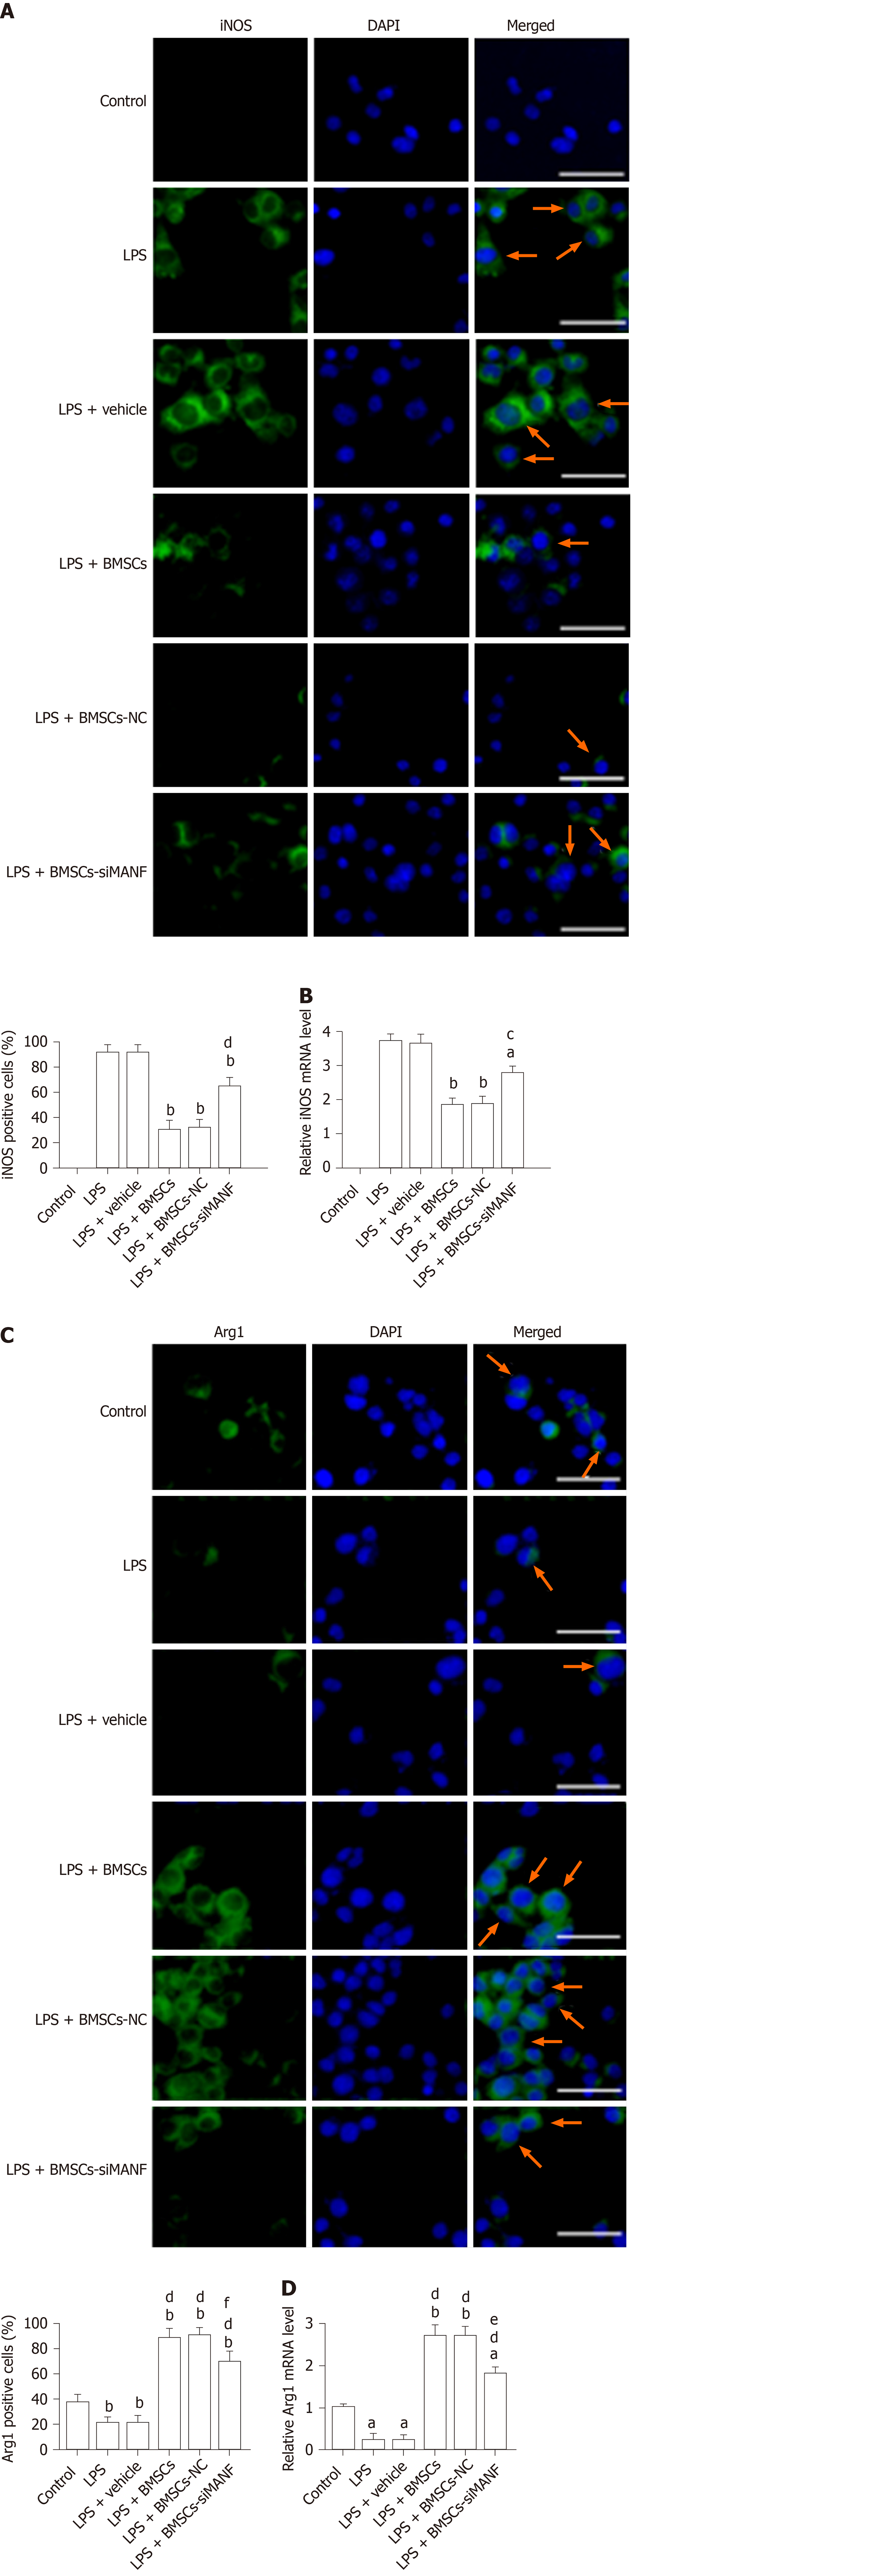
Figure 7 In vitro analysis of M1 and M2 polarization markers following exposure to lipopolysaccharide and bone marrow mesenchymal stem cells.
A and B: Immunocytochemistry (A) and qRT-PCR analysis (B) of iNOS expression in microglia. Representative images of immunofluorescence staining for iNOS (green), with DAPI (blue) as a nuclear counterstain, are shown. aP < 0.05, bP < 0.01 vs LPS and LPS + vehicle groups; cP < 0.05, dP < 0.01 vs LPS + BMSCs and LPS+BMSCs-NC groups. Scale bar = 50 μm. Arrows point to the iNOS+ cells; C and D: Immunocytochemistry (C) and qRT-PCR analysis (D) of Arg1 expression in LPS-stimulated microglia in the presence or absence of BMSCs. Representative images of immunofluorescence staining for Arg1 (green), with DAPI (blue) as a nuclear counterstain, are shown. aP < 0.05, bP < 0.01, vs Control group; dP < 0.001 vs LPS and LPS + vehicle groups; eP < 0.05, fP < 0.01 vs LPS + BMSCs and LPS+BMSCs-NC groups. Scale bar = 50 μm. Arrows point to the Arg1+ cells. The values are expressed as the mean ± SD (n = 6). LPS: Lipopolysaccharide; BMSCs: Bone marrow mesenchymal stem cells; BMSCs-NC: Negative control-transfected BMSCs; BMSCs-siMANF: MANF siRNA-transfected BMSCs; iNOS: Inducible nitric oxide synthase; Arg-1: Arginase-1; DAPI: 4'6-diamidino-2-phenylindole.
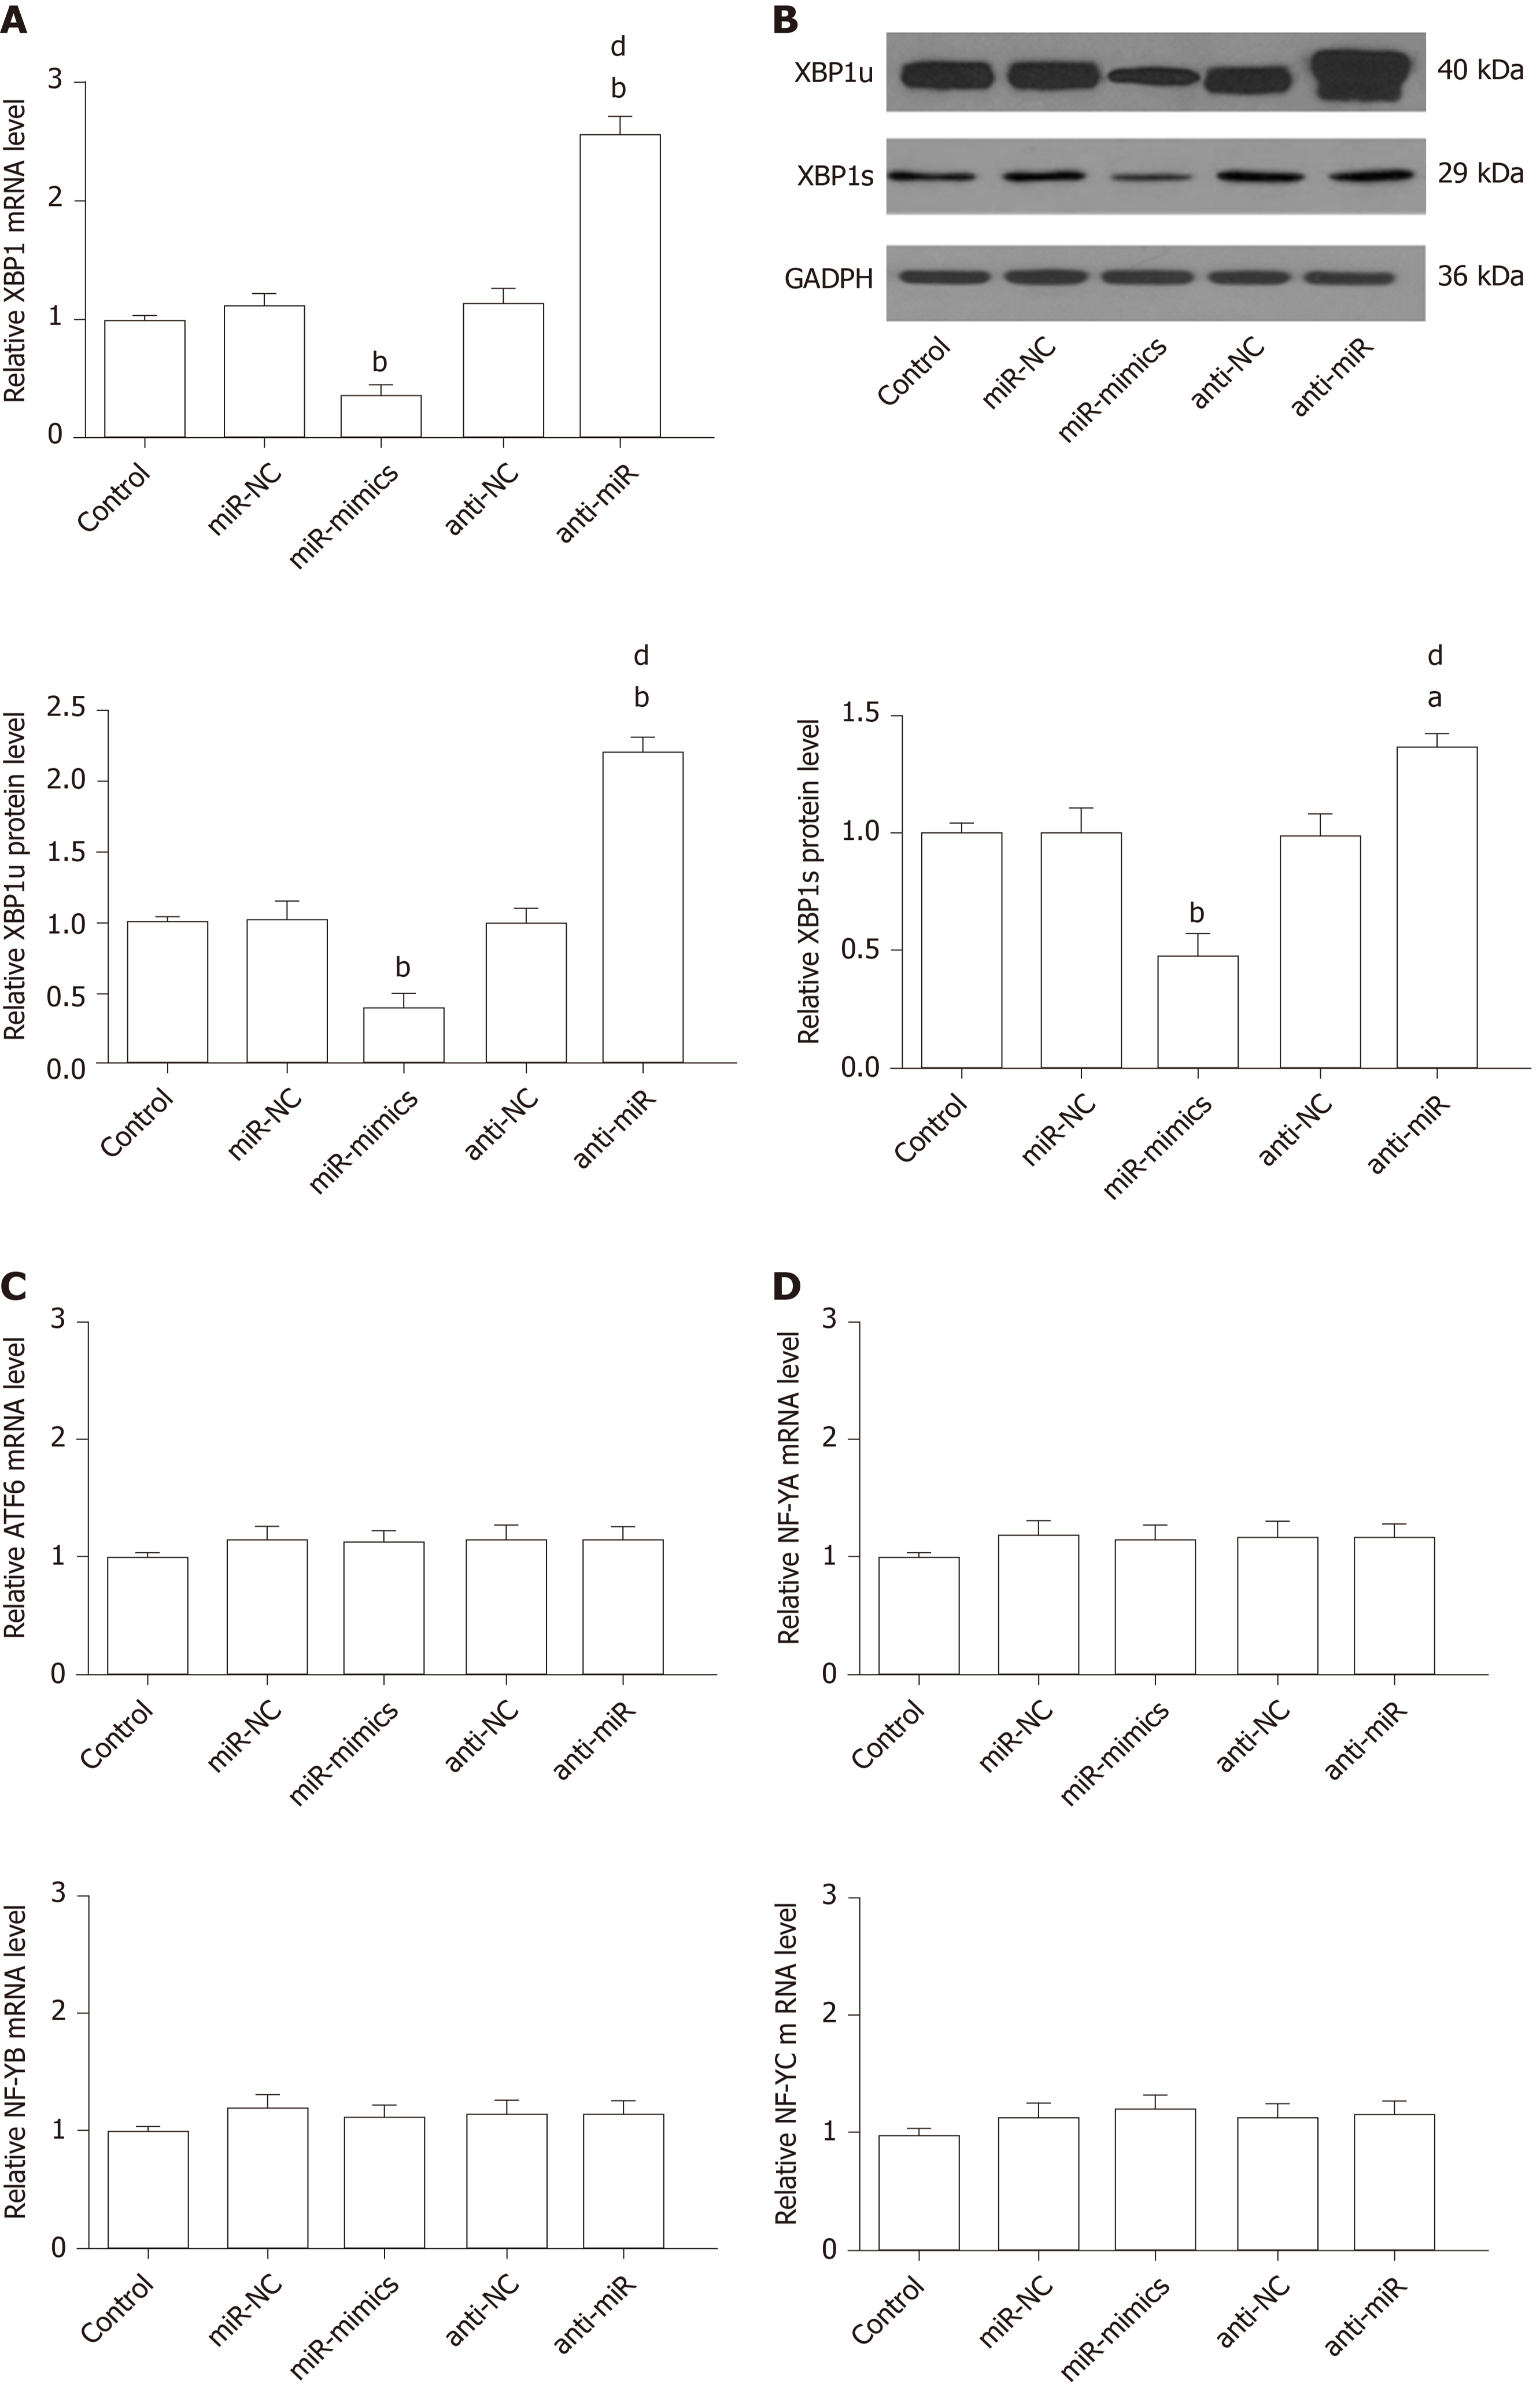
Figure 8 miR-30a* inhibits X-box binding protein 1 expression without regulating the levels of activating transcription factor 6 and NF-YA–C in HAPI cells.
A and B: qRT-PCR (A) and Western blot analysis (B) of XBP1 expression in HAPI cells transfected with miR-mimics, anti-miR, or corresponding NC oligonucleotides; C and D: qRT-PCR analysis of ATF6 (C) and NF-YA–C (D) expression in HAPI cells after transfection of miR-mimics, anti-miR, or corresponding NC oligonucleotides. aP < 0.05, bP < 0.01 vs Control, miR-NC and anti-NC groups; dP < 0.01 vs miR-mimics group. The values are expressed as the mean ± SD (n = 6). XBP1: X-box binding protein 1; GAPDH: Glyceraldehyde-3-phosphate dehydrogenase; ATF6: Activating transcription factor 6; NF-Y (A,B,C): Nuclear factor-Y (A,B,C); miR-NC: miR-30a*-negative control-transfected microglia; miR-mimics: miR-30a*-mimics-transfected microglia; anti-NC: anti-miR-30a*-negative control-transfected microglia; anti-miR: miR-30a*-inhibitor-transfected microglia.
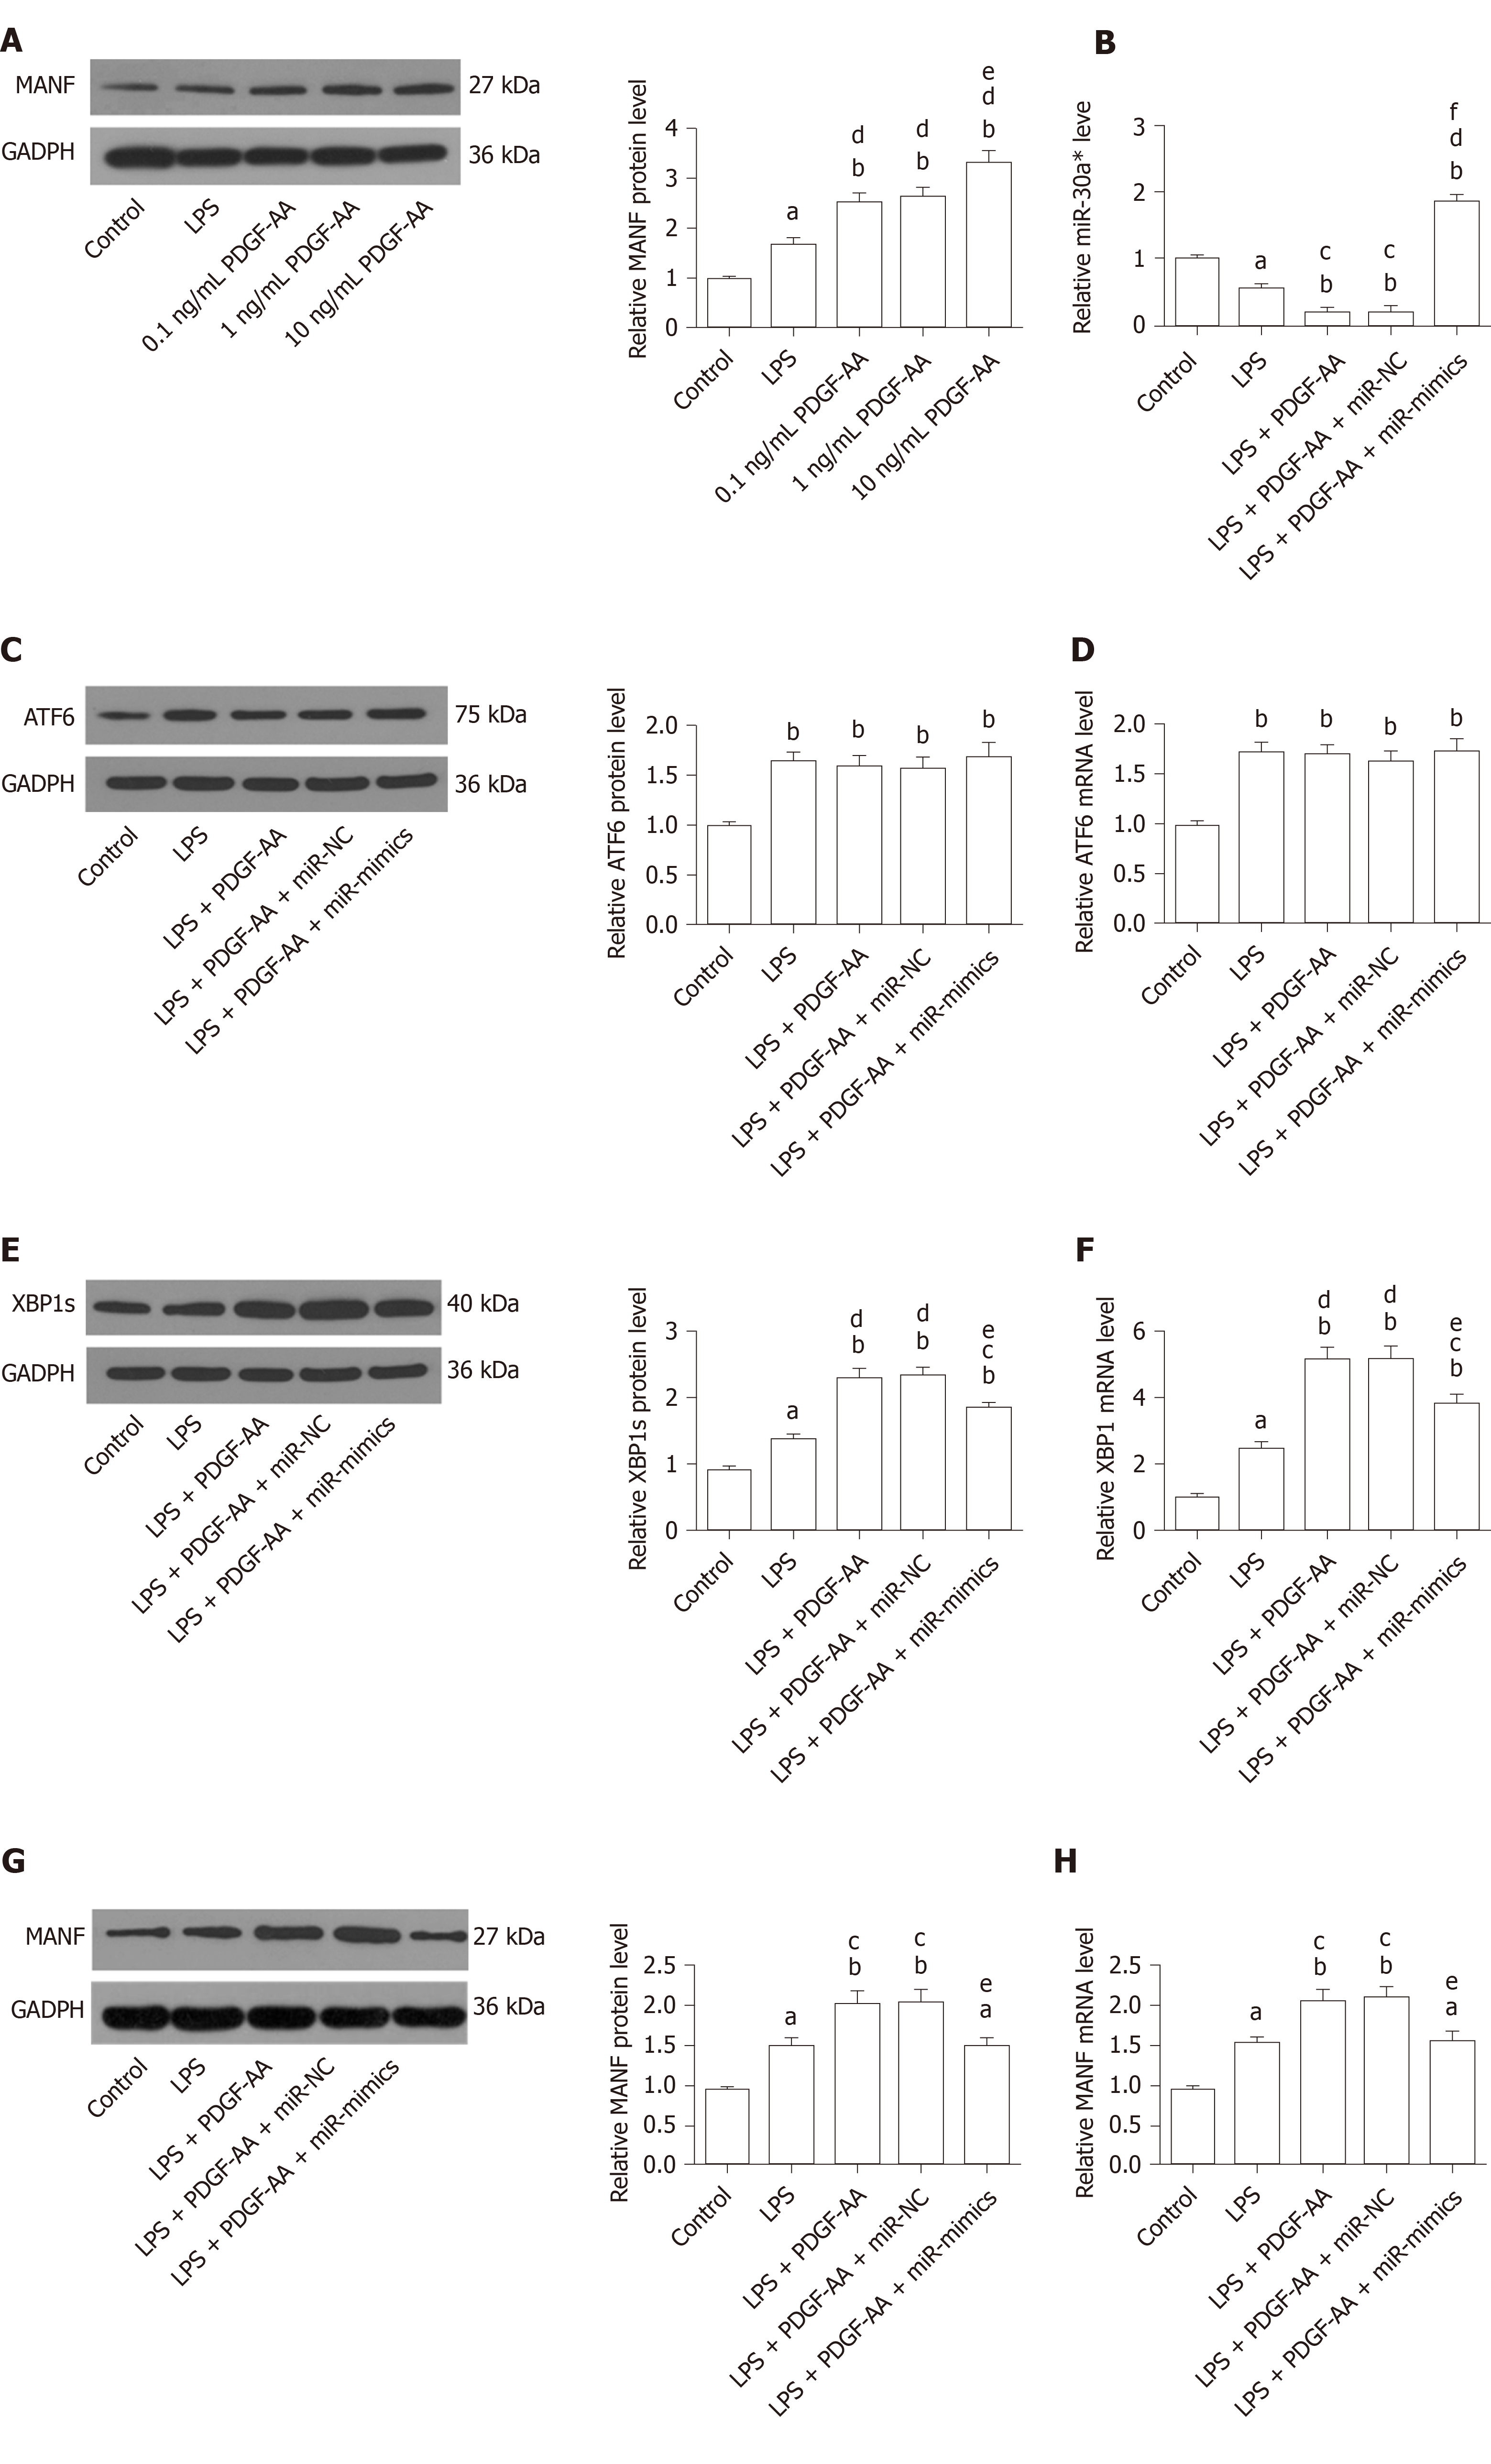
Figure 9 Platelet-derived growth factor-AA-mediated induction of mesencephalic astrocyte–derived neurotrophic factor involves miR-30a*/X-box binding protein 1 signaling in HAPI cells stimulated by lipopolysaccharide.
A: Western blot analysis of PDGF-AA-induced MANF expression in activated HAPI cells. aP < 0.05, bP < 0.01 vs Control group; dP < 0.01 vs LPS group; eP < 0.05 vs 0.1 ng/mL and 1 ng/mL PDGF-AA groups; B: qRT-PCR analysis of miR-30a* expression in untreated or 10 ng/mL PDGF-AA-treated activated HAPI cells transfected with or without miR-mimics or miR-NC; C and D: Western blot (C) and qRT-PCR analysis (D) of ATF6 expression in untreated or 10 ng/mL PDGF-AA-treated activated HAPI cells transfected with or without miR-mimics or miR-NC; E and F: Western blot (E) and qRT-PCR analysis (F) of XBP1 expression in untreated or 10 ng/mL PDGF-AA-treated activated HAPI cells transfected with or without miR-mimics or miR-NC; G and H: Western blot (G) and qRT-PCR analysis (H) of MANF expression in untreated or 10 ng/mL PDGF-AA-treated activated HAPI cells transfected with or without miR-mimics or miR-NC. aP < 0.05, bP < 0.01 vs Control group; cP < 0.05, dP < 0.01 vs LPS group; eP < 0.05, fP < 0.01 vs LPS + PDGF-AA and LPS + PDGF-AA + miR-NC groups. The values are expressed as the mean ± SD (n = 6). MANF: Mesencephalic astrocyte–derived neurotrophic factor; PDGF-AA: Platelet-derived growth factor-AA; XBP1: X-box binding protein 1; ATF6: Activating transcription factor 6; GAPDH: Glyceraldehyde-3-phosphate dehydrogenase; LPS: Lipopolysaccharide; miR-NC: miR-30a*-negative control-transfected microglia; miR-mimics: miR-30a*-mimics-transfected microglia.
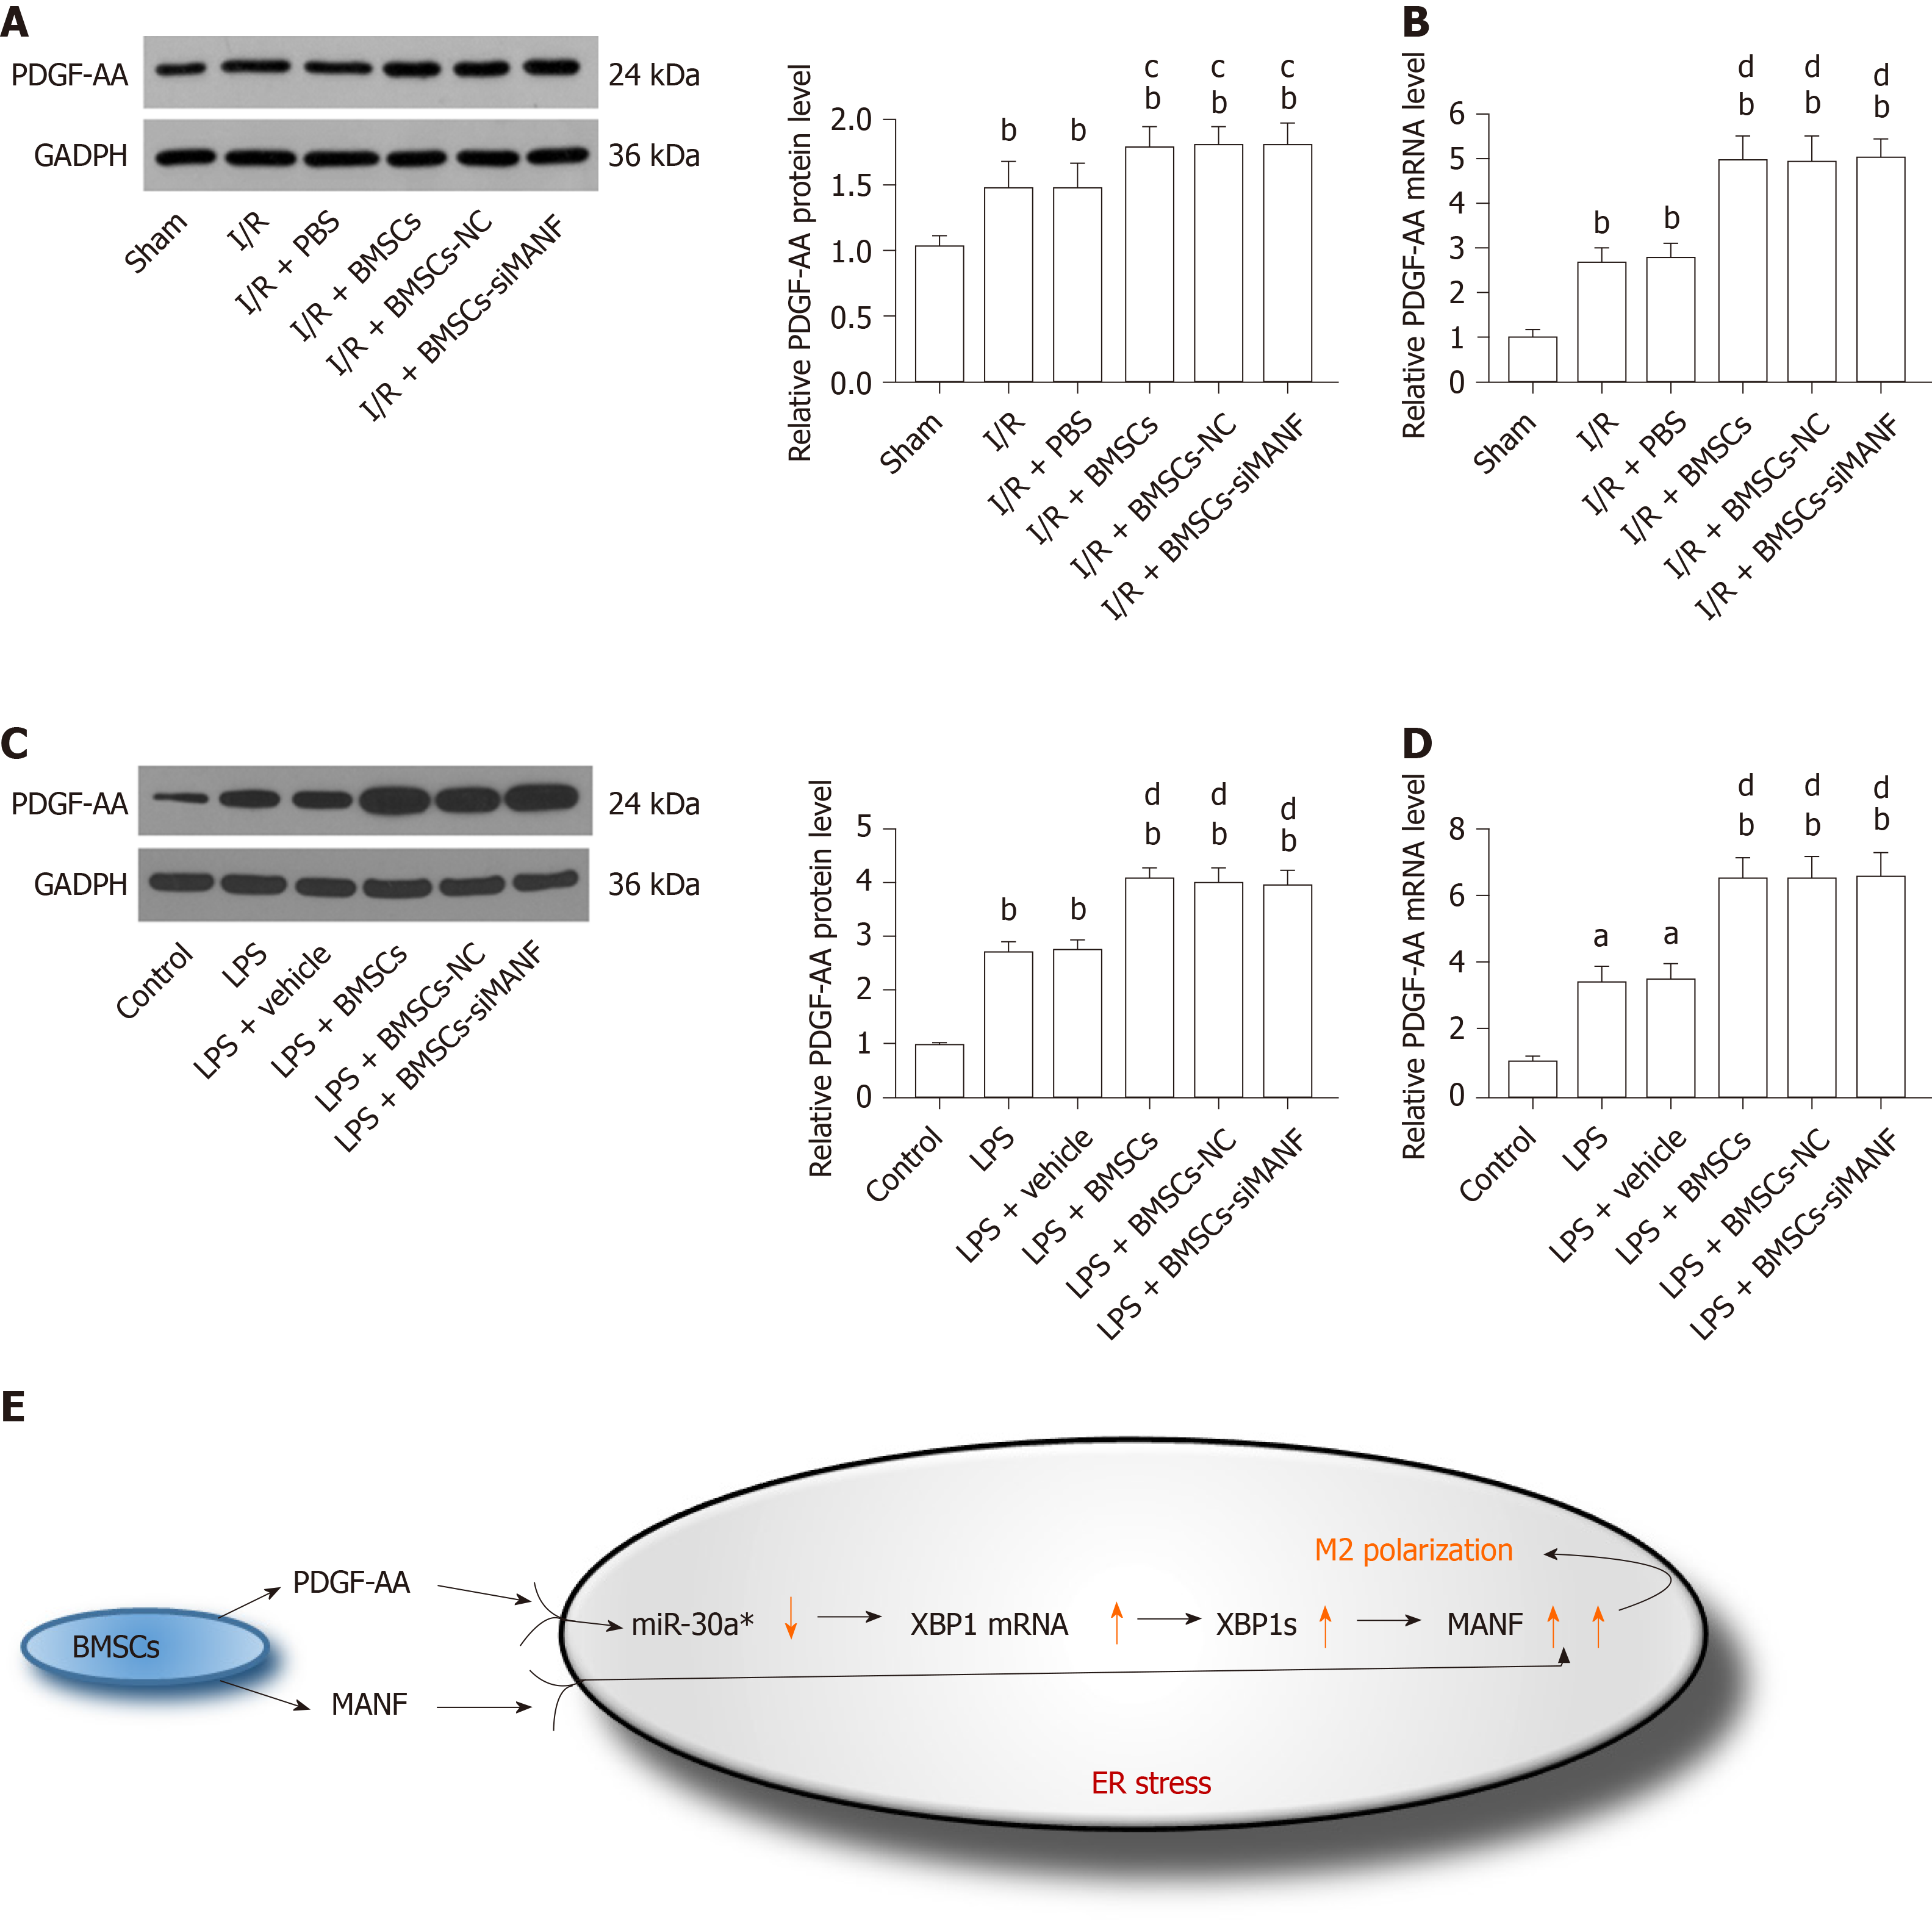
Figure 10 In vivo and in vitro analysis of platelet-derived growth factor-AA expression.
A and B: Western blot (A) and qRT-PCR analysis (B) of PDGF-AA expression in the injured brains. bP < 0.01 vs Sham group; cP < 0.05, dP < 0.01 vs I/R and I/R + PBS groups; C and D: Western blot (C) and qRT-PCR analysis (D) of PDGF-AA in LPS-stimulated microglia in the presence or absence of BMSCs. aP < 0.05, bP < 0.01 vs Control group; dP < 0.01 vs LPS and LPS + vehicle groups. The values are expressed as the mean ± SD (n = 6); E: Proposed mechanism for synergistic regulation of PDGF-AA/miR-30a*/XBP1/MANF pathway and MANF paracrine signaling during BMSCs-induced M2 polarization. PDGF-AA: Platelet-derived growth factor-AA; GAPDH: Glyceraldehyde-3-phosphate dehydrogenase; I/R: Ischemia/reperfusion; LPS: Lipopolysaccharide; PBS: Phosphate-buffered saline; BMSCs: Bone marrow mesenchymal stem cells; BMSCs-NC: Negative control-transfected BMSCs; BMSCs-siMANF: MANF siRNA-transfected BMSCs; XBP1: X-box binding protein 1; MANF: Mesencephalic astrocyte–derived neurotrophic factor; ER: Endoplasmic reticulum.
- Citation: Yang F, Li WB, Qu YW, Gao JX, Tang YS, Wang DJ, Pan YJ. Bone marrow mesenchymal stem cells induce M2 microglia polarization through PDGF-AA/MANF signaling. World J Stem Cells 2020; 12(7): 633-658
- URL: https://www.wjgnet.com/1948-0210/full/v12/i7/633.htm
- DOI: https://dx.doi.org/10.4252/wjsc.v12.i7.633


