Copyright
©The Author(s) 2020.
World J Stem Cells. Feb 26, 2020; 12(2): 152-167
Published online Feb 26, 2020. doi: 10.4252/wjsc.v12.i2.152
Published online Feb 26, 2020. doi: 10.4252/wjsc.v12.i2.152
Figure 1 Human umbilical cord mesenchymal stem cellsCCR2 load the C-C chemokine receptor type 2 receptor into their exosomes.
A, B: Flow cytometry analysis of the C-C chemokine receptor type 2 (CCR2) receptor on human umbilical cord mesenchymal stem cells (HUC-MSCs)Ctrl and HUC-MSCsCCR2, n = 3, cP < 0.001; C: CCR2 mRNA expression in HUC-MSCsCtrlvs HUC-MSCsCCR2, n = 3, cP < 0.001; D: Western blotting analysis for the quantification of the CCR2 expression in HUC-MSCsCtrlvs HUC-MSCsCCR2, n = 3; E, F: Analysis of the exosomal morphology and diameter distribution of ExoCtrl and ExoCCR2 using transmission electron microscopy and the qNano® system, respectively, n = 3; G: Western blotting analysis for the detection of the exosomal specific markers CD9, CD63, and CD81 in ExoCtrl and ExoCCR2, n = 3; H: Western blotting analysis for the quantification of the exosomal CCR2 expression in the ExoCtrl and ExoCCR2 samples, n = 3; I: Schematic diagram describing the extraction of the exosomes from the medium; J: Detection of the CCL2-binding ability of the exosomes by ELISA, n = 3, cP < 0.001.
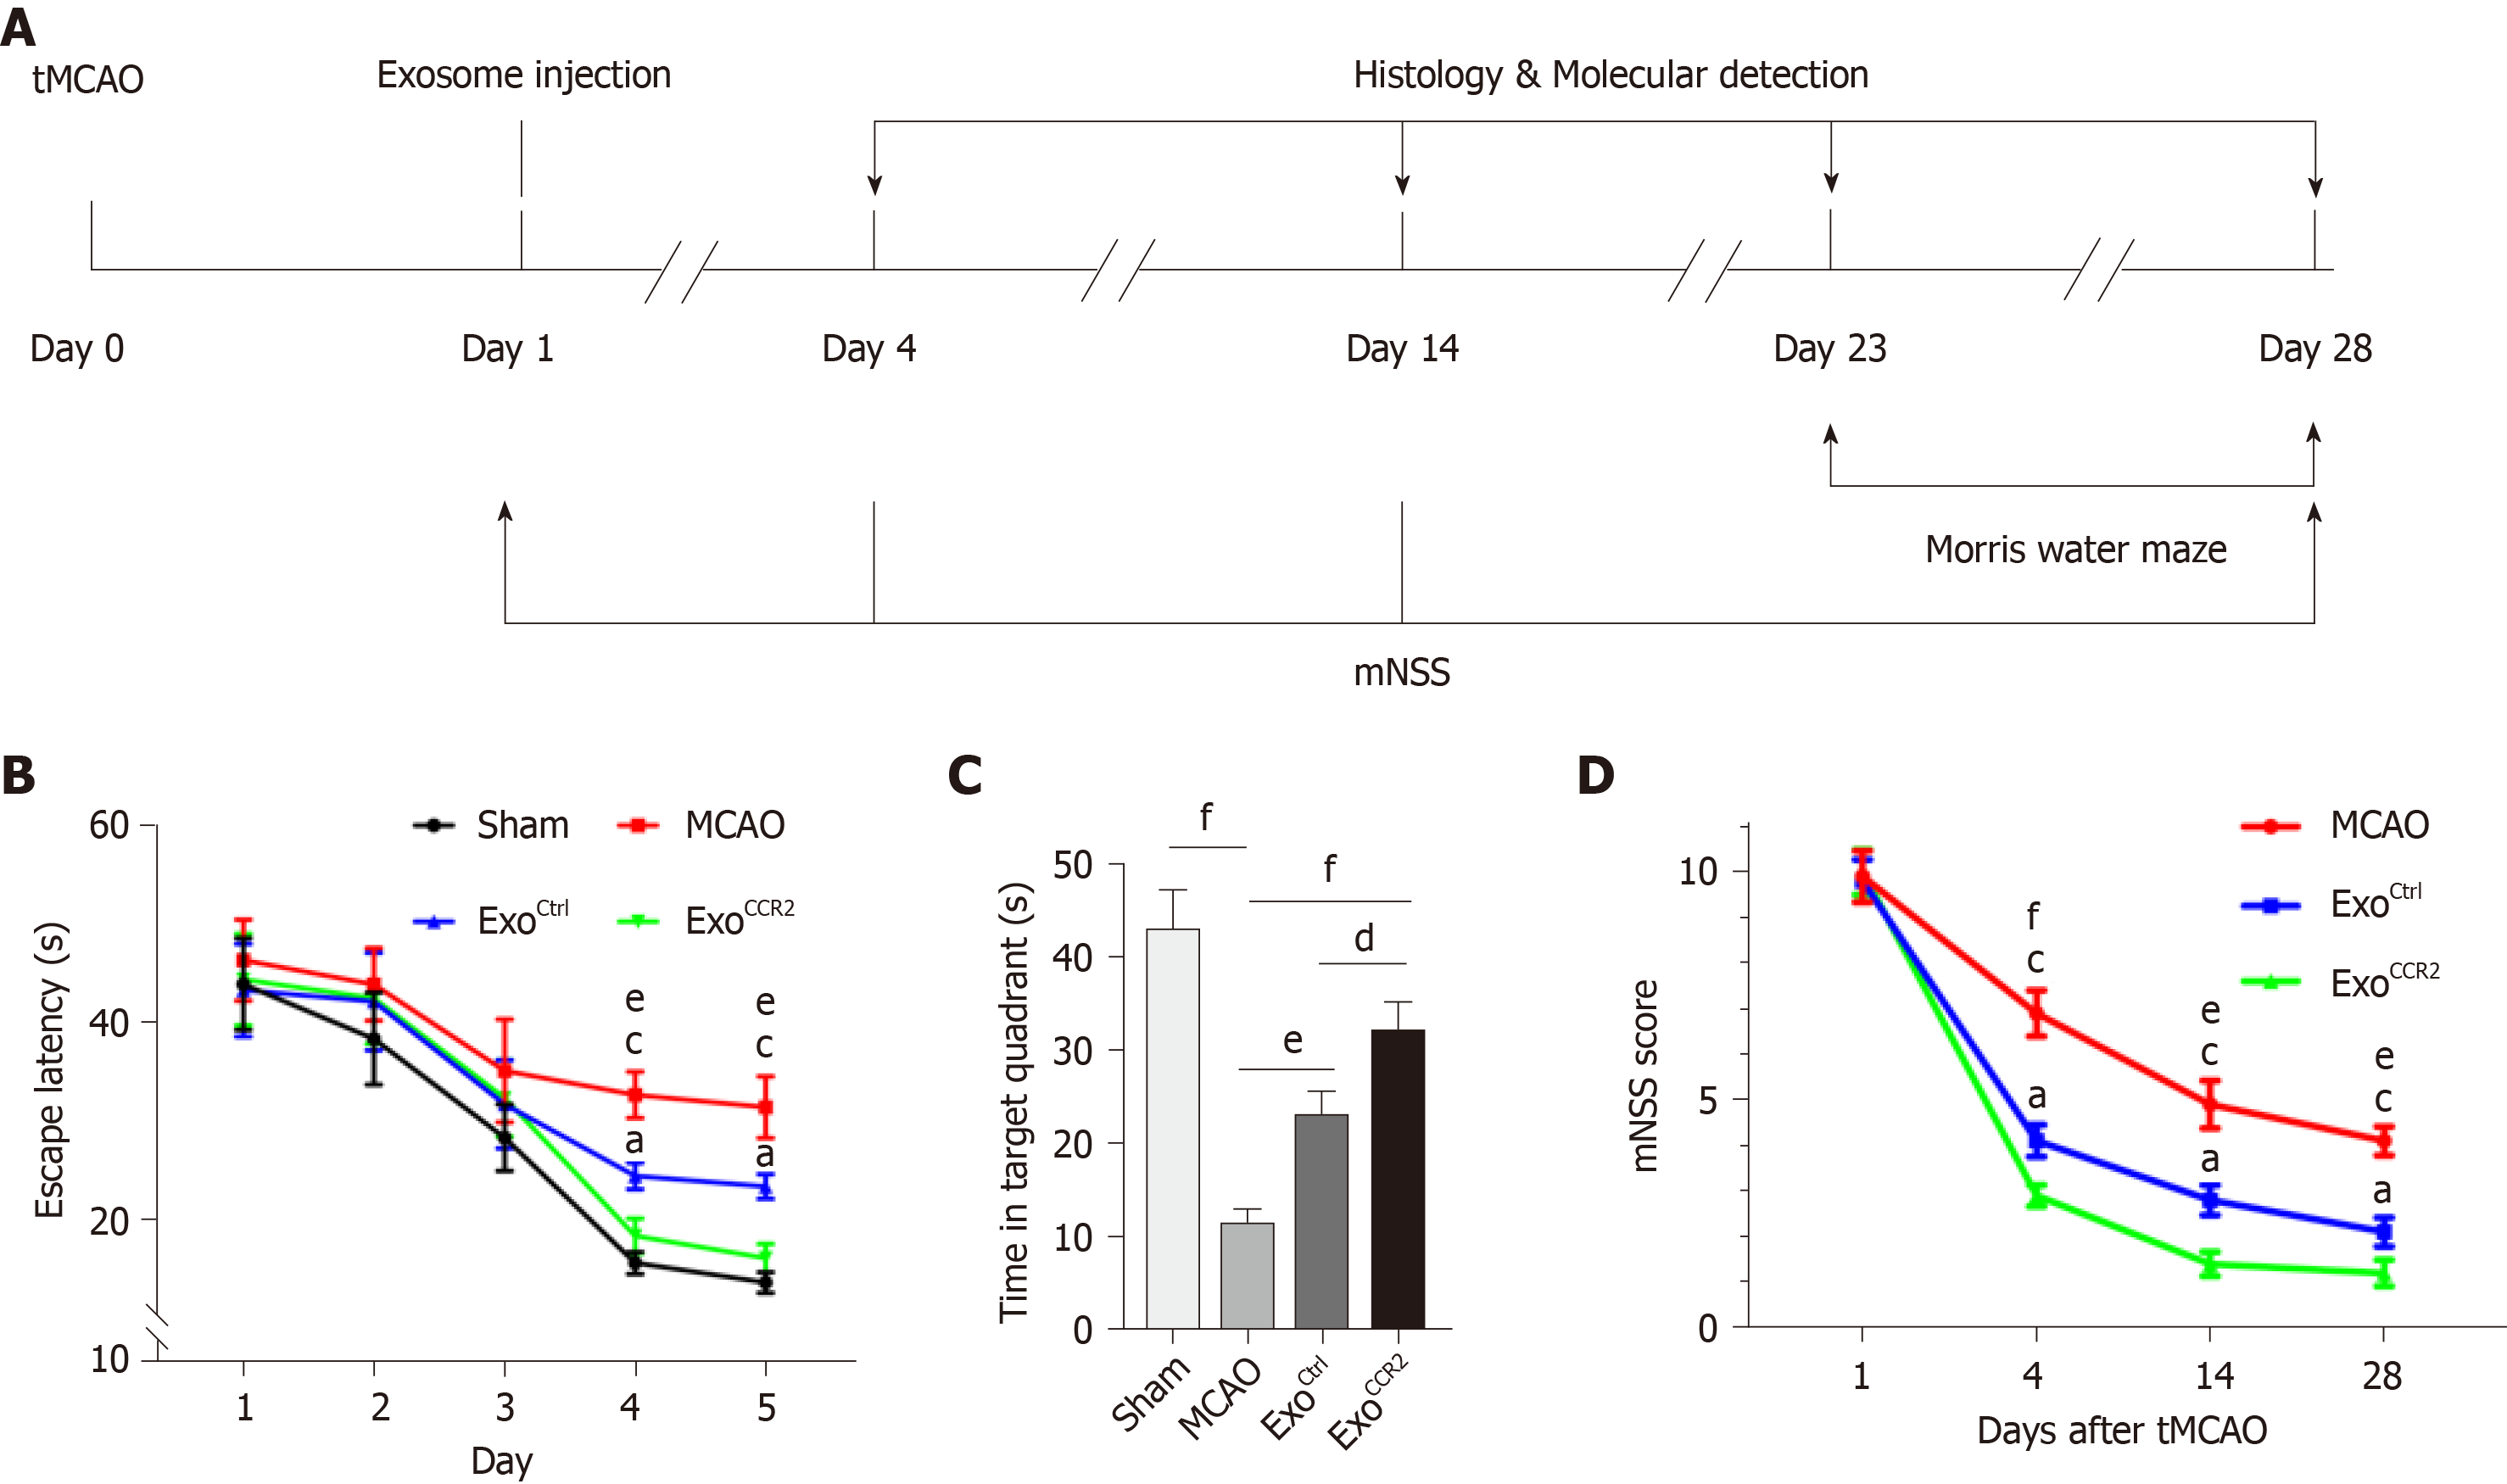
Figure 2 ExoCCR2 improved the spatial learning and memory at day 28 after transient middle cerebral occlusion compared to ExoCtrl.
A: Experimental schedule to observe the effects of exosomes on rats with transient middle cerebral occlusion (tMCAO); B: Effect of exosomes on the mean escape latency to find the platform in each group. n = 10, eP < 0.01, ExoCtrl vs tMCAO, cP < 0.001, ExoCCR2 vs tMCAO, aP < 0.05, ExoCCR2 vs ExoCtrl; C: Effect of exosomes on the time spent in the target quadrant in case of rats from each group. n = 10. dP < 0.05, eP < 0.01, fP < 0.001; D: Effect of exosomes on the mNSS values of rats from each group. n = 10. eP < 0.01, ExoCtrl vs tMCAO, fP < 0.001, ExoCtrl vs tMCAO, cP < 0.001, ExoCCR2 vs tMCAO, aP < 0.05, ExoCCR2 vs ExoCtrl.
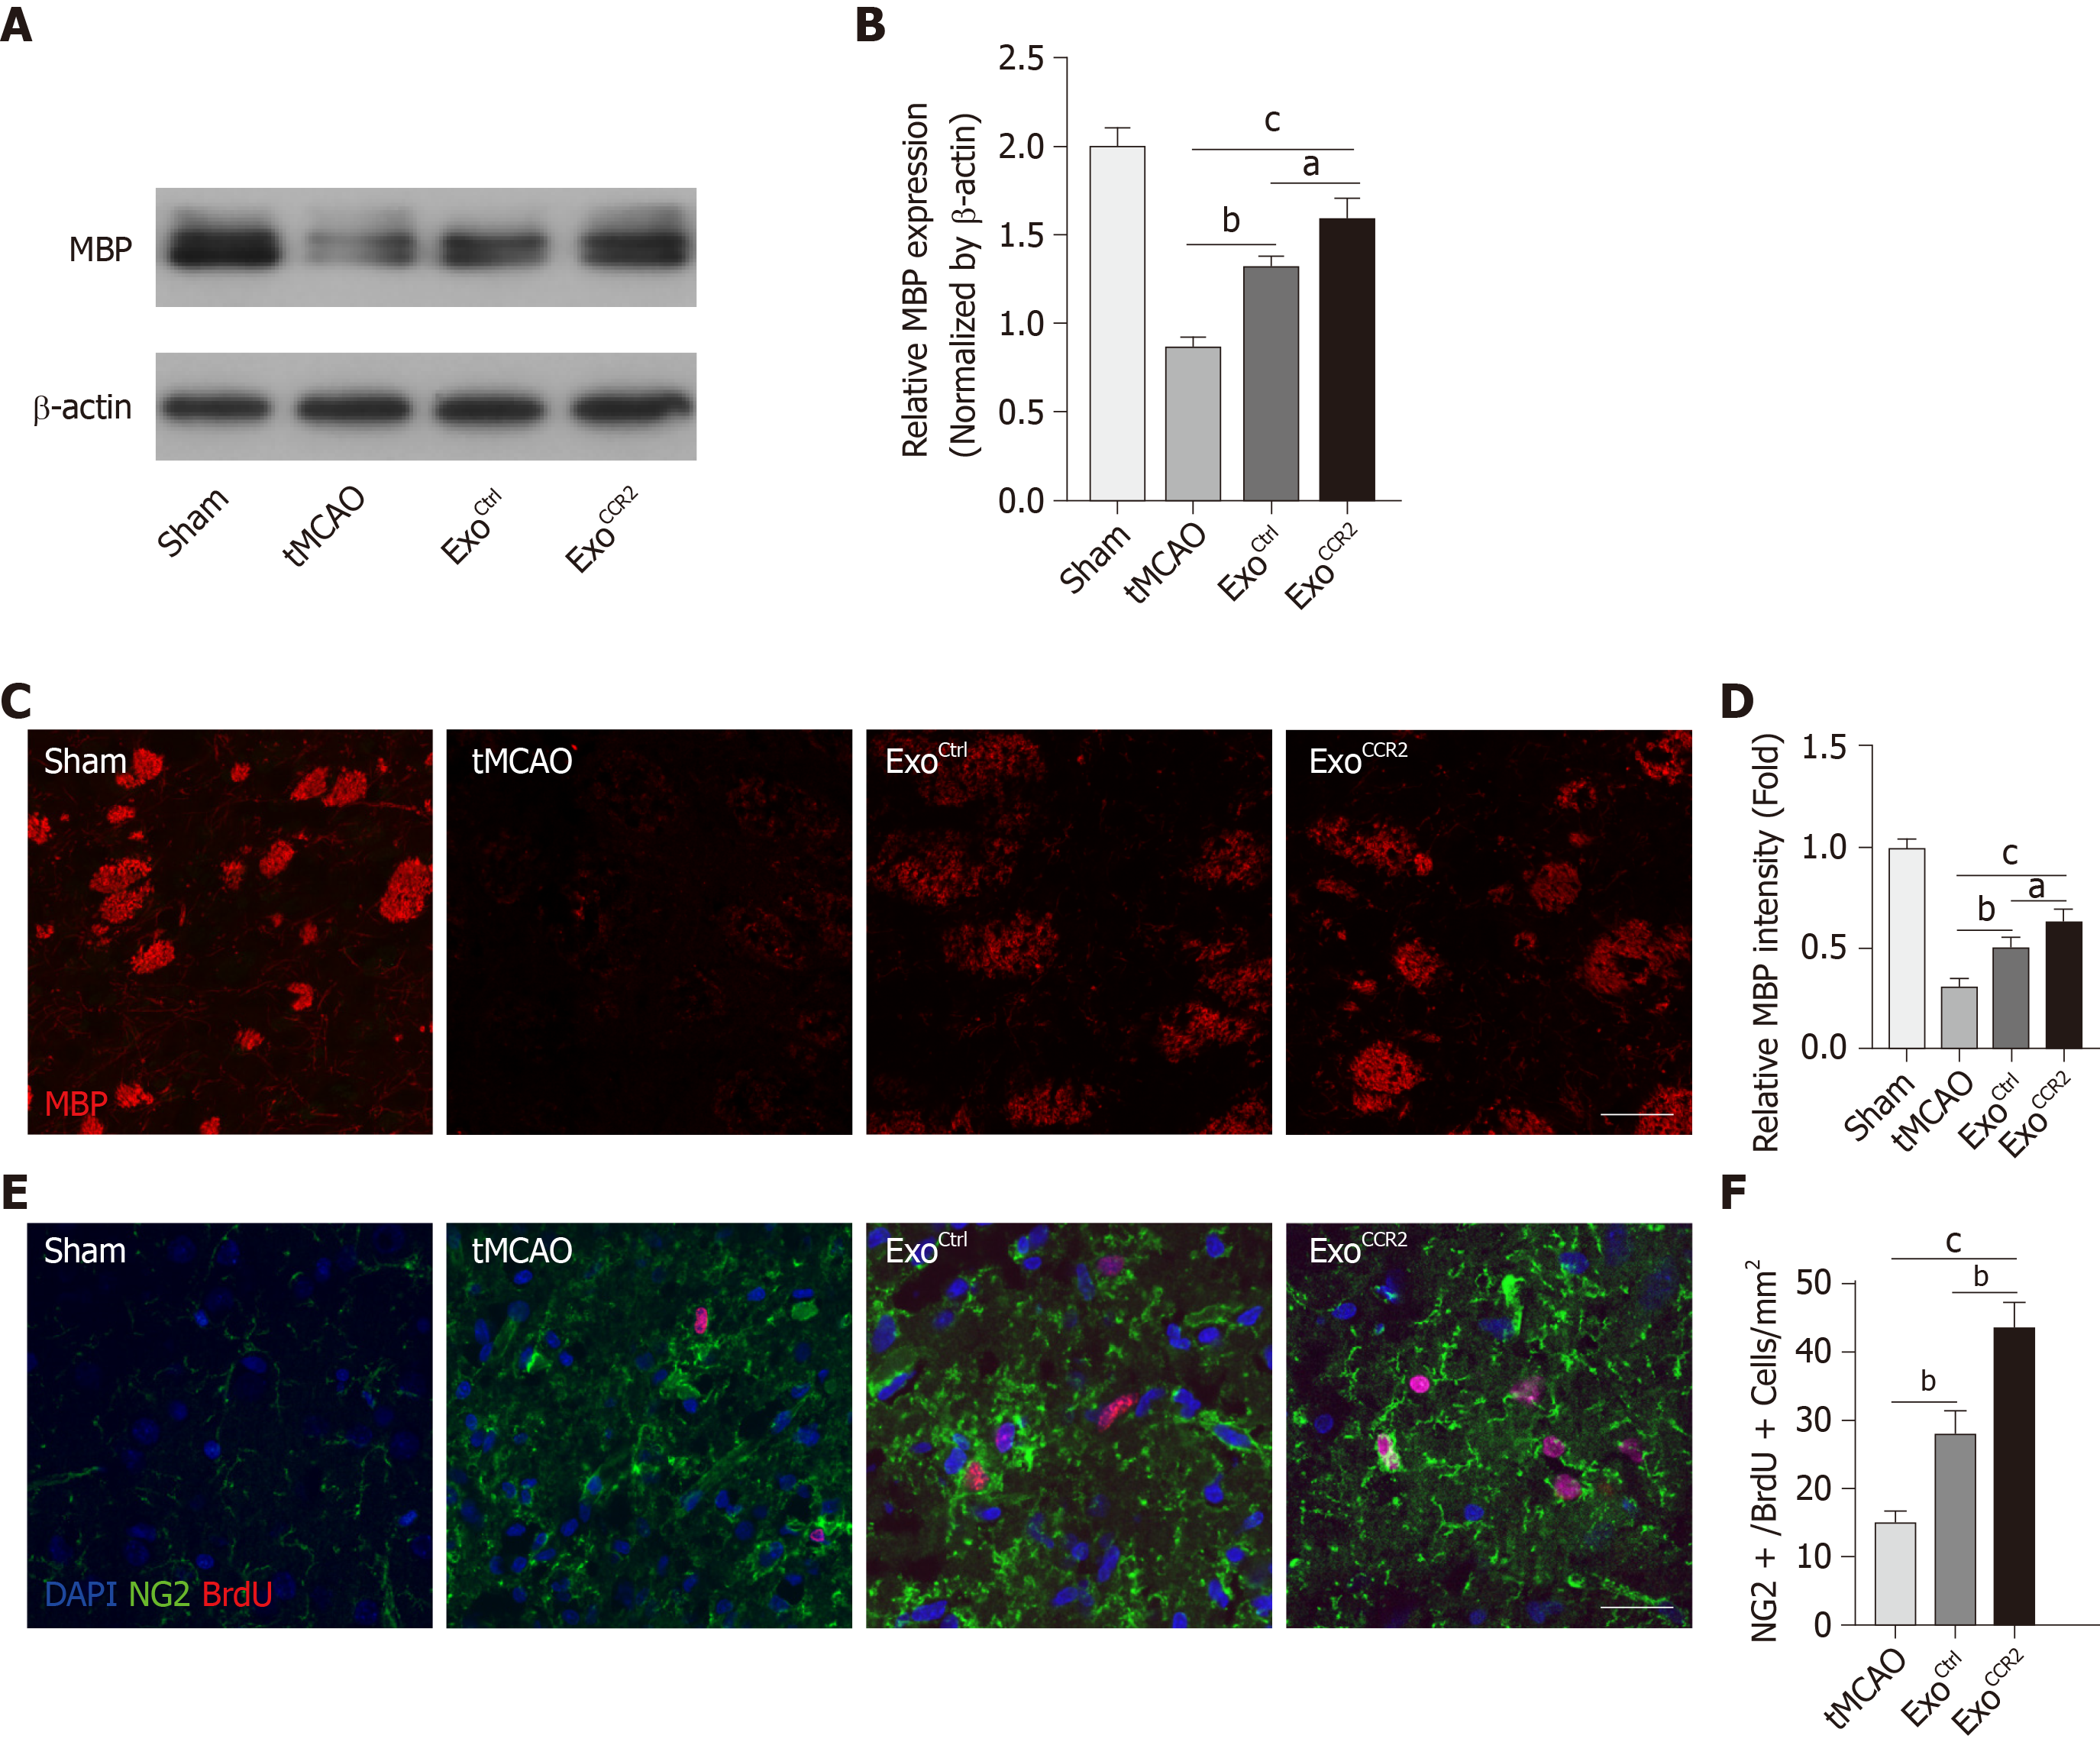
Figure 3 ExoCCR2 exerts superior beneficial effects on remyelination and oligodendrogenesis at day 28 after transient middle cerebral occlusion compared to ExoCtrl.
A, B: Western blotting analysis of the MBP expression in samples from rats in each group. n = 5, aP < 0.05, bP < 0.01, cP < 0.001; C, D: Analysis of MBP fluorescence intensity in samples from rats in each group. Scale bar = 50 μm, n = 6, aP < 0.05, bP < 0.01, cP < 0.001; E, F: NG2+/ BrdU+ cell colocalization count by immunofluorescence staining. Scale bar = 50 μm, n = 6. bP < 0.01, cP < 0.001.
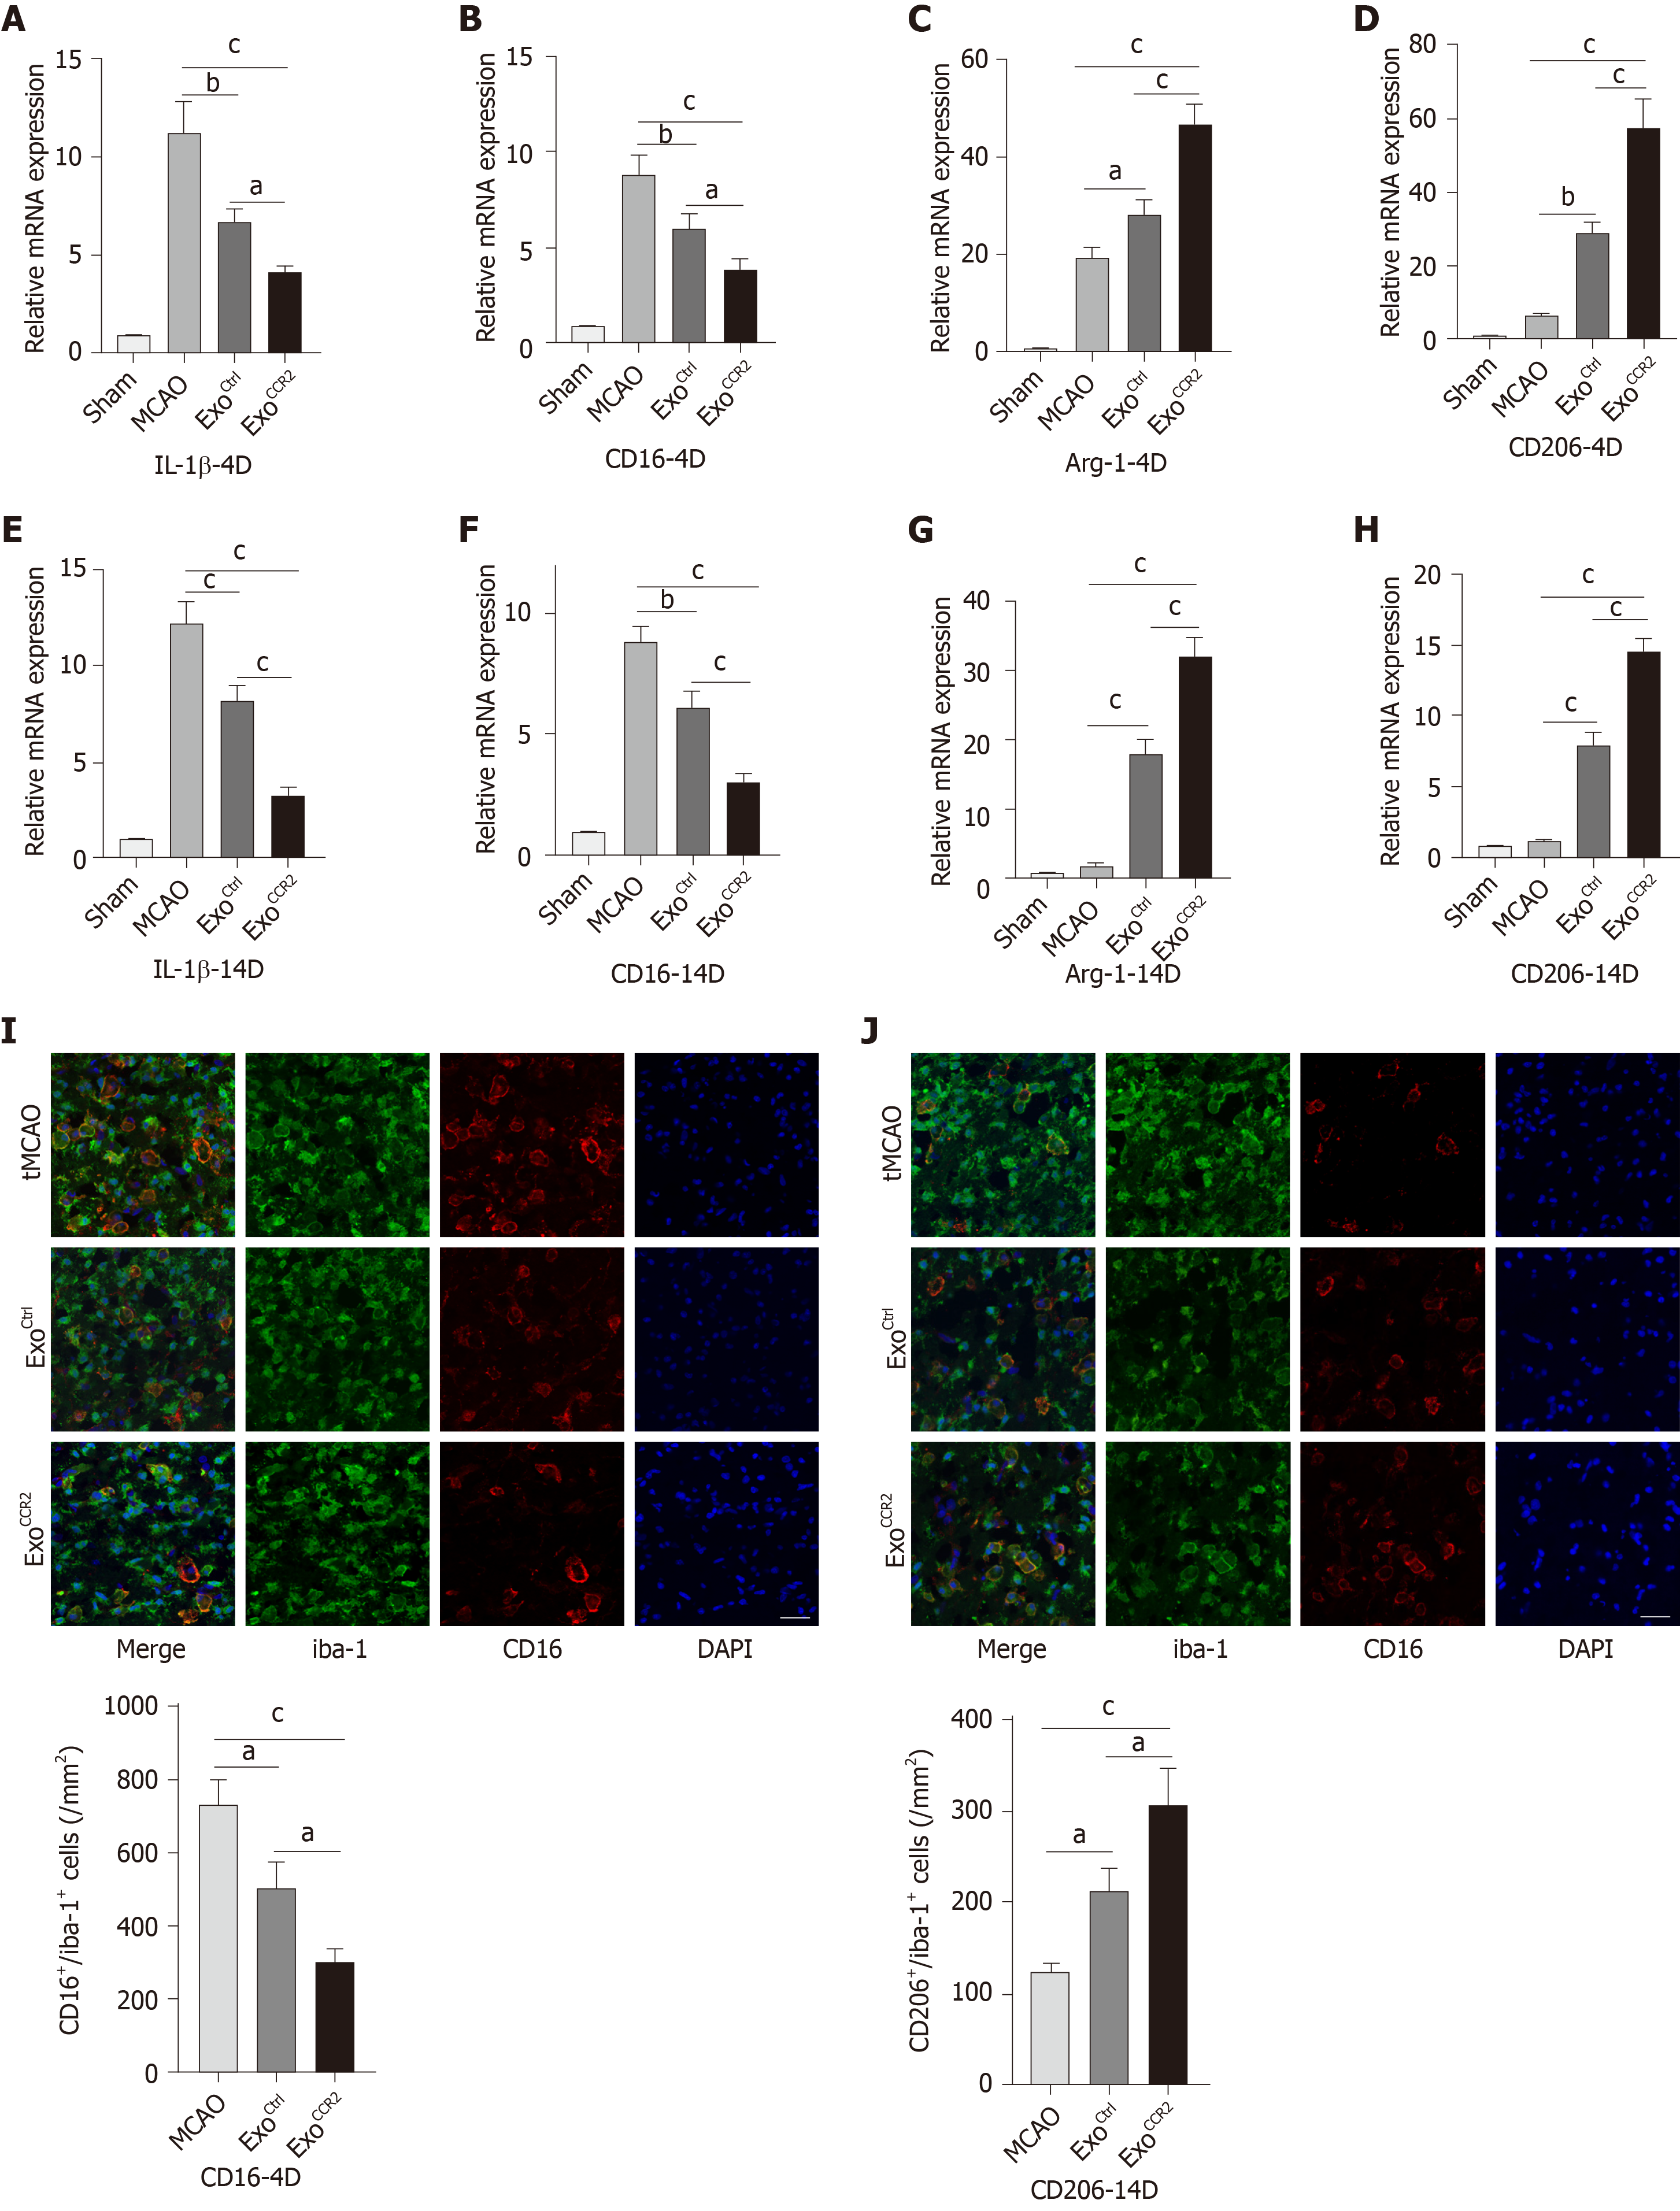
Figure 4 ExoCCR2 drove microglia/macrophage M2 polarization and inhibited microglia/macrophage M1 polarization at day 4 and day 14 after transient middle cerebral occlusion compared to ExoCtrl.
A-D: Relative CD16, IL-1β, CD206, and Arg-1 mRNA expression changes in samples obtained from rats in each group on day 4 after transient middle cerebral occlusion (tMCAO), n = 6, aP < 0.05, bP < 0.01, cP < 0.001; E-H: Relative CD16, IL-1β, CD206, and Arg-1 mRNA expression changes in samples obtained from rats in each group on day 14 after tMCAO, n = 6, bP < 0.01, cP < 0.001; I: CD16/iba-1 immunofluorescence staining and cell colocalization counts 14 d after tMCAO. Scale bar = 50 μm, n = 6, aP < 0.05, cP < 0.001; J: CT206/iba-1 immunofluorescence staining and cell colocalization counts 14 d after tMCAO. Scale bar = 50 μm, n = 6, aP < 0.05, cP < 0.001.
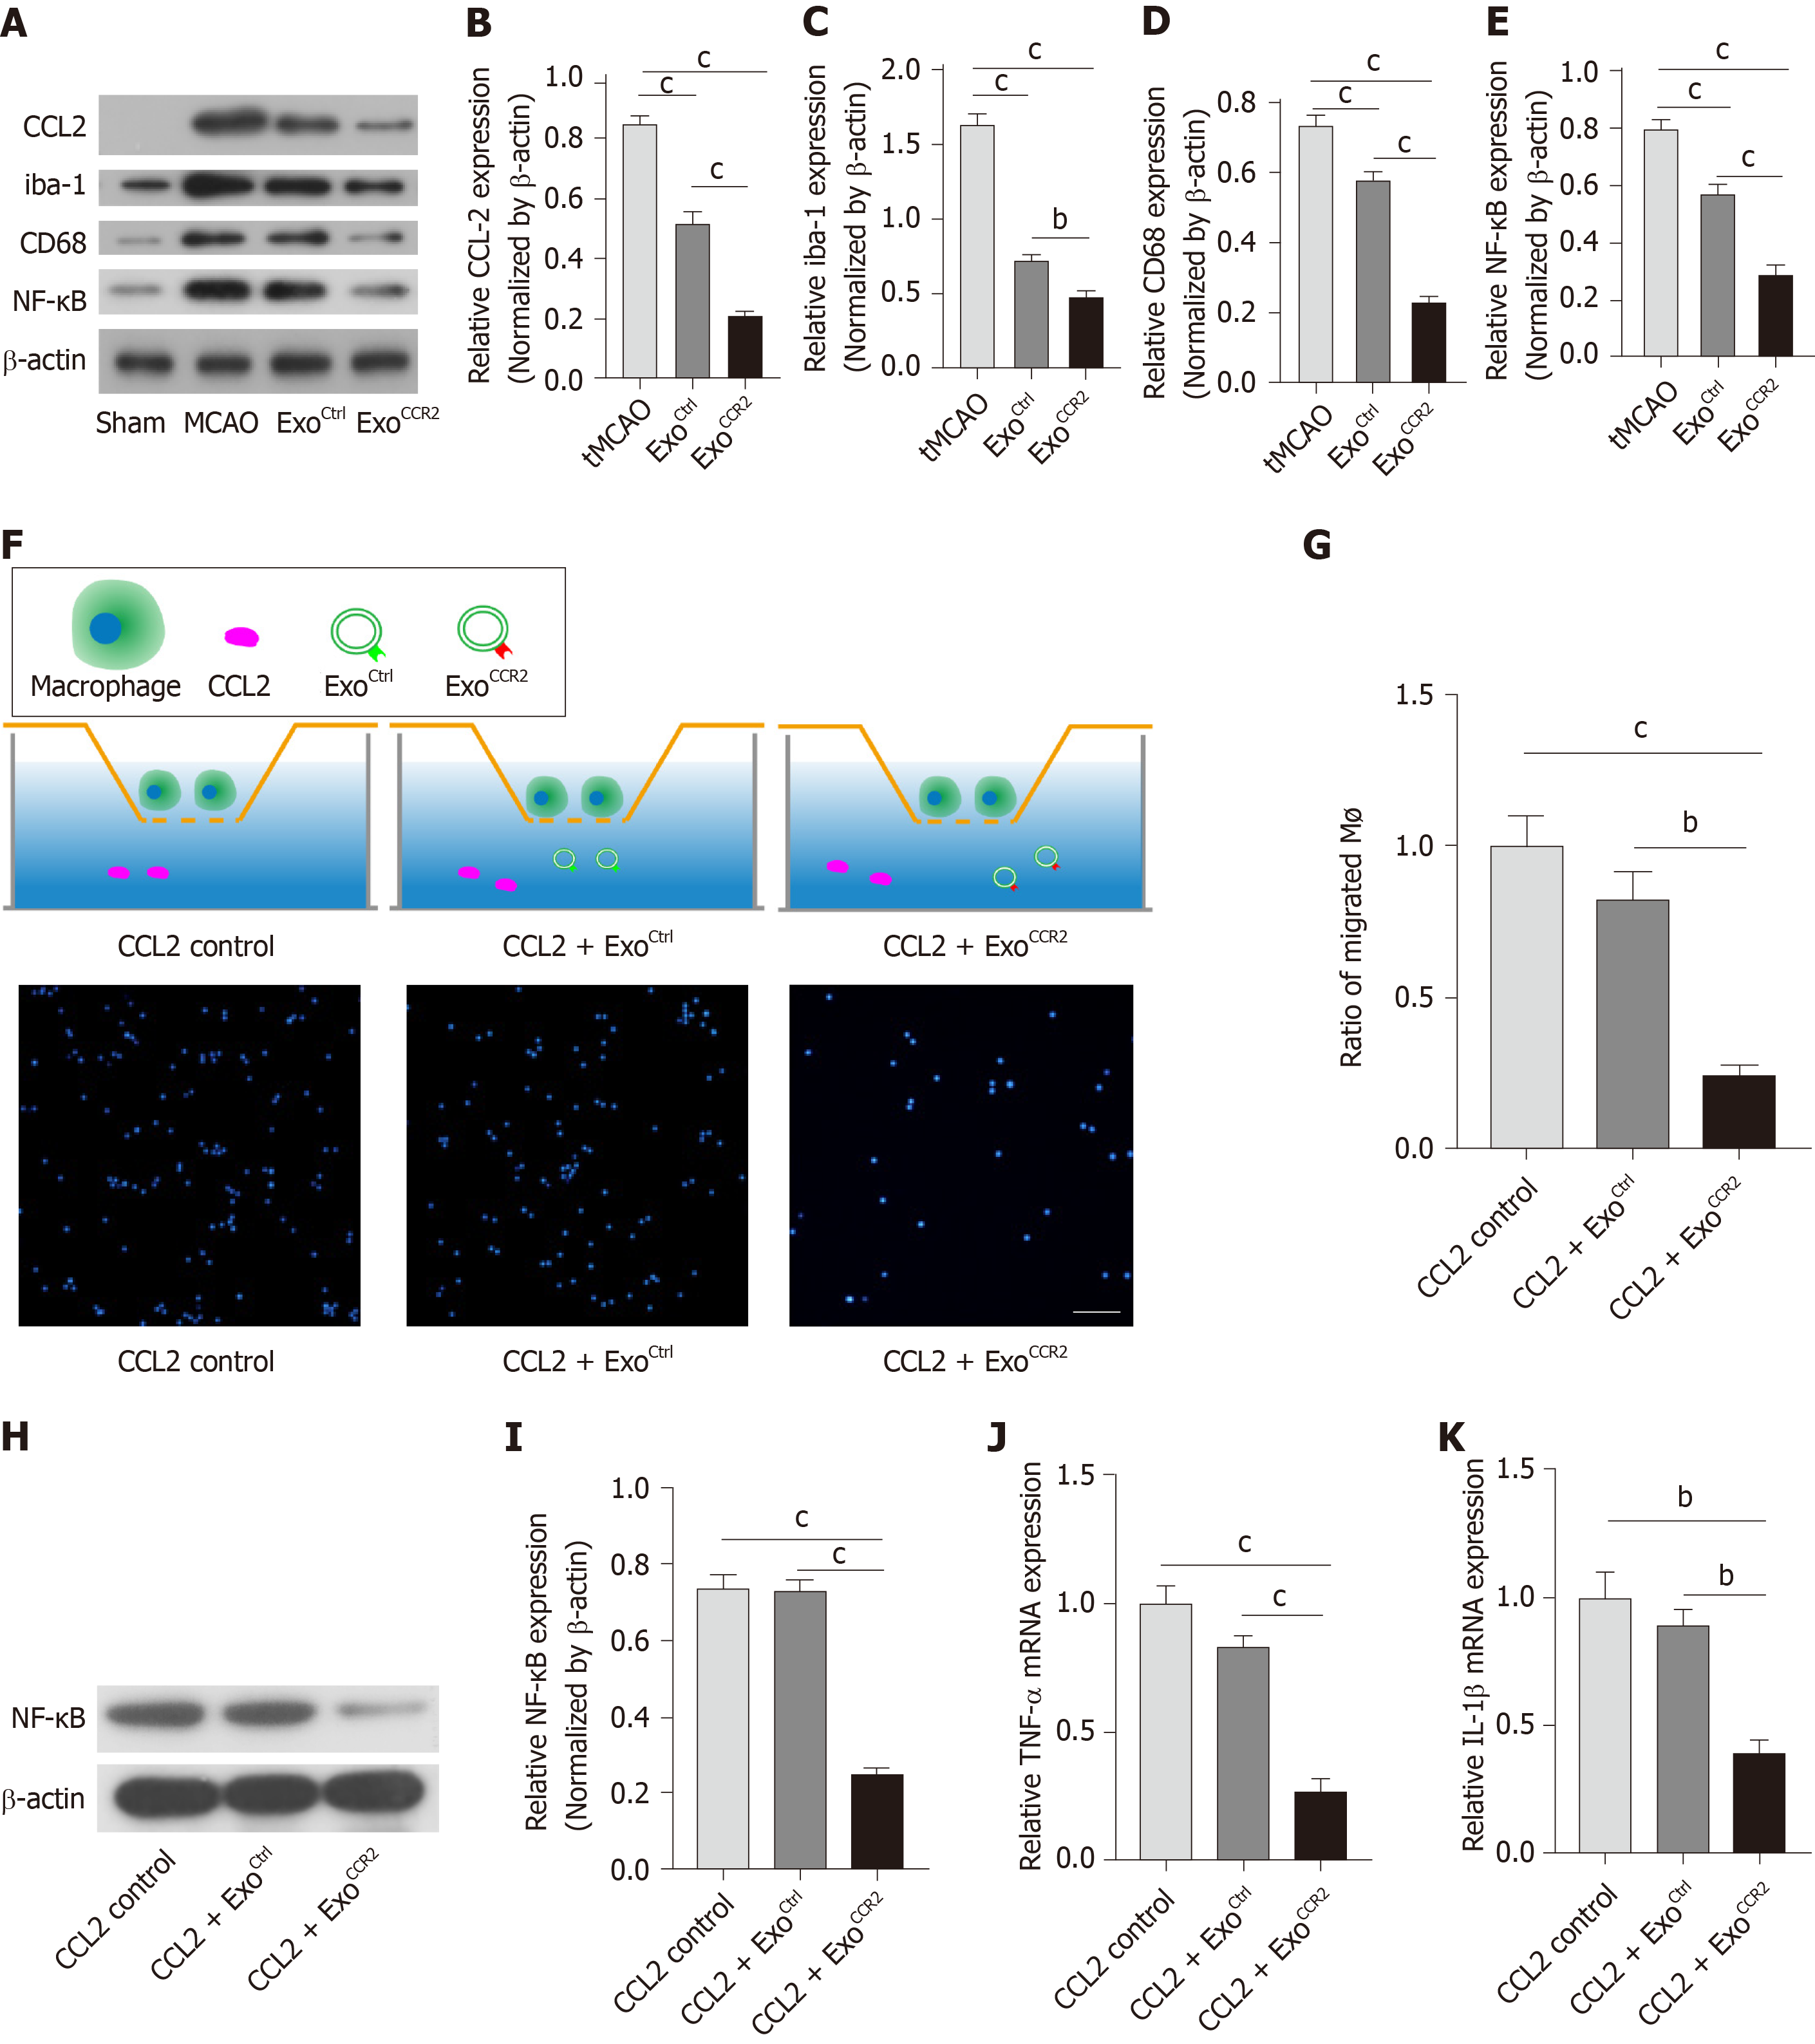
Figure 5 ExoCCR2 showed more powerful effects on CCL2-induced macrophage migration and activation in vivo and in vitro than ExoCtrl.
A-E: Comparison of the expression levels of the CCL2, iba-1, CD68, and NF-κB proteins in samples from rats in each group (in vivo) at day 4 after transient middle cerebral occlusion, n = 6, bP < 0.01, cP < 0.001; F: Schematic diagram of the transwell experiment. Immunofluorescence detection of the migrated macrophages in case of each treatment group (in vitro), n = 3; scale bar = 200 μm, bP < 0.01, cP < 0.001; D-K: Comparison of the mRNA expression levels of TNF-α and IL-1β and the expression levels of the NF-κB protein in cells from each group (in vitro), n = 3, bP < 0.01, cP < 0.001.
- Citation: Yang HC, Zhang M, Wu R, Zheng HQ, Zhang LY, Luo J, Li LL, Hu XQ. C-C chemokine receptor type 2-overexpressing exosomes alleviated experimental post-stroke cognitive impairment by enhancing microglia/macrophage M2 polarization. World J Stem Cells 2020; 12(2): 152-167
- URL: https://www.wjgnet.com/1948-0210/full/v12/i2/152.htm
- DOI: https://dx.doi.org/10.4252/wjsc.v12.i2.152


