Copyright
©The Author(s) 2020.
World J Stem Cells. Dec 26, 2020; 12(12): 1667-1690
Published online Dec 26, 2020. doi: 10.4252/wjsc.v12.i12.1667
Published online Dec 26, 2020. doi: 10.4252/wjsc.v12.i12.1667
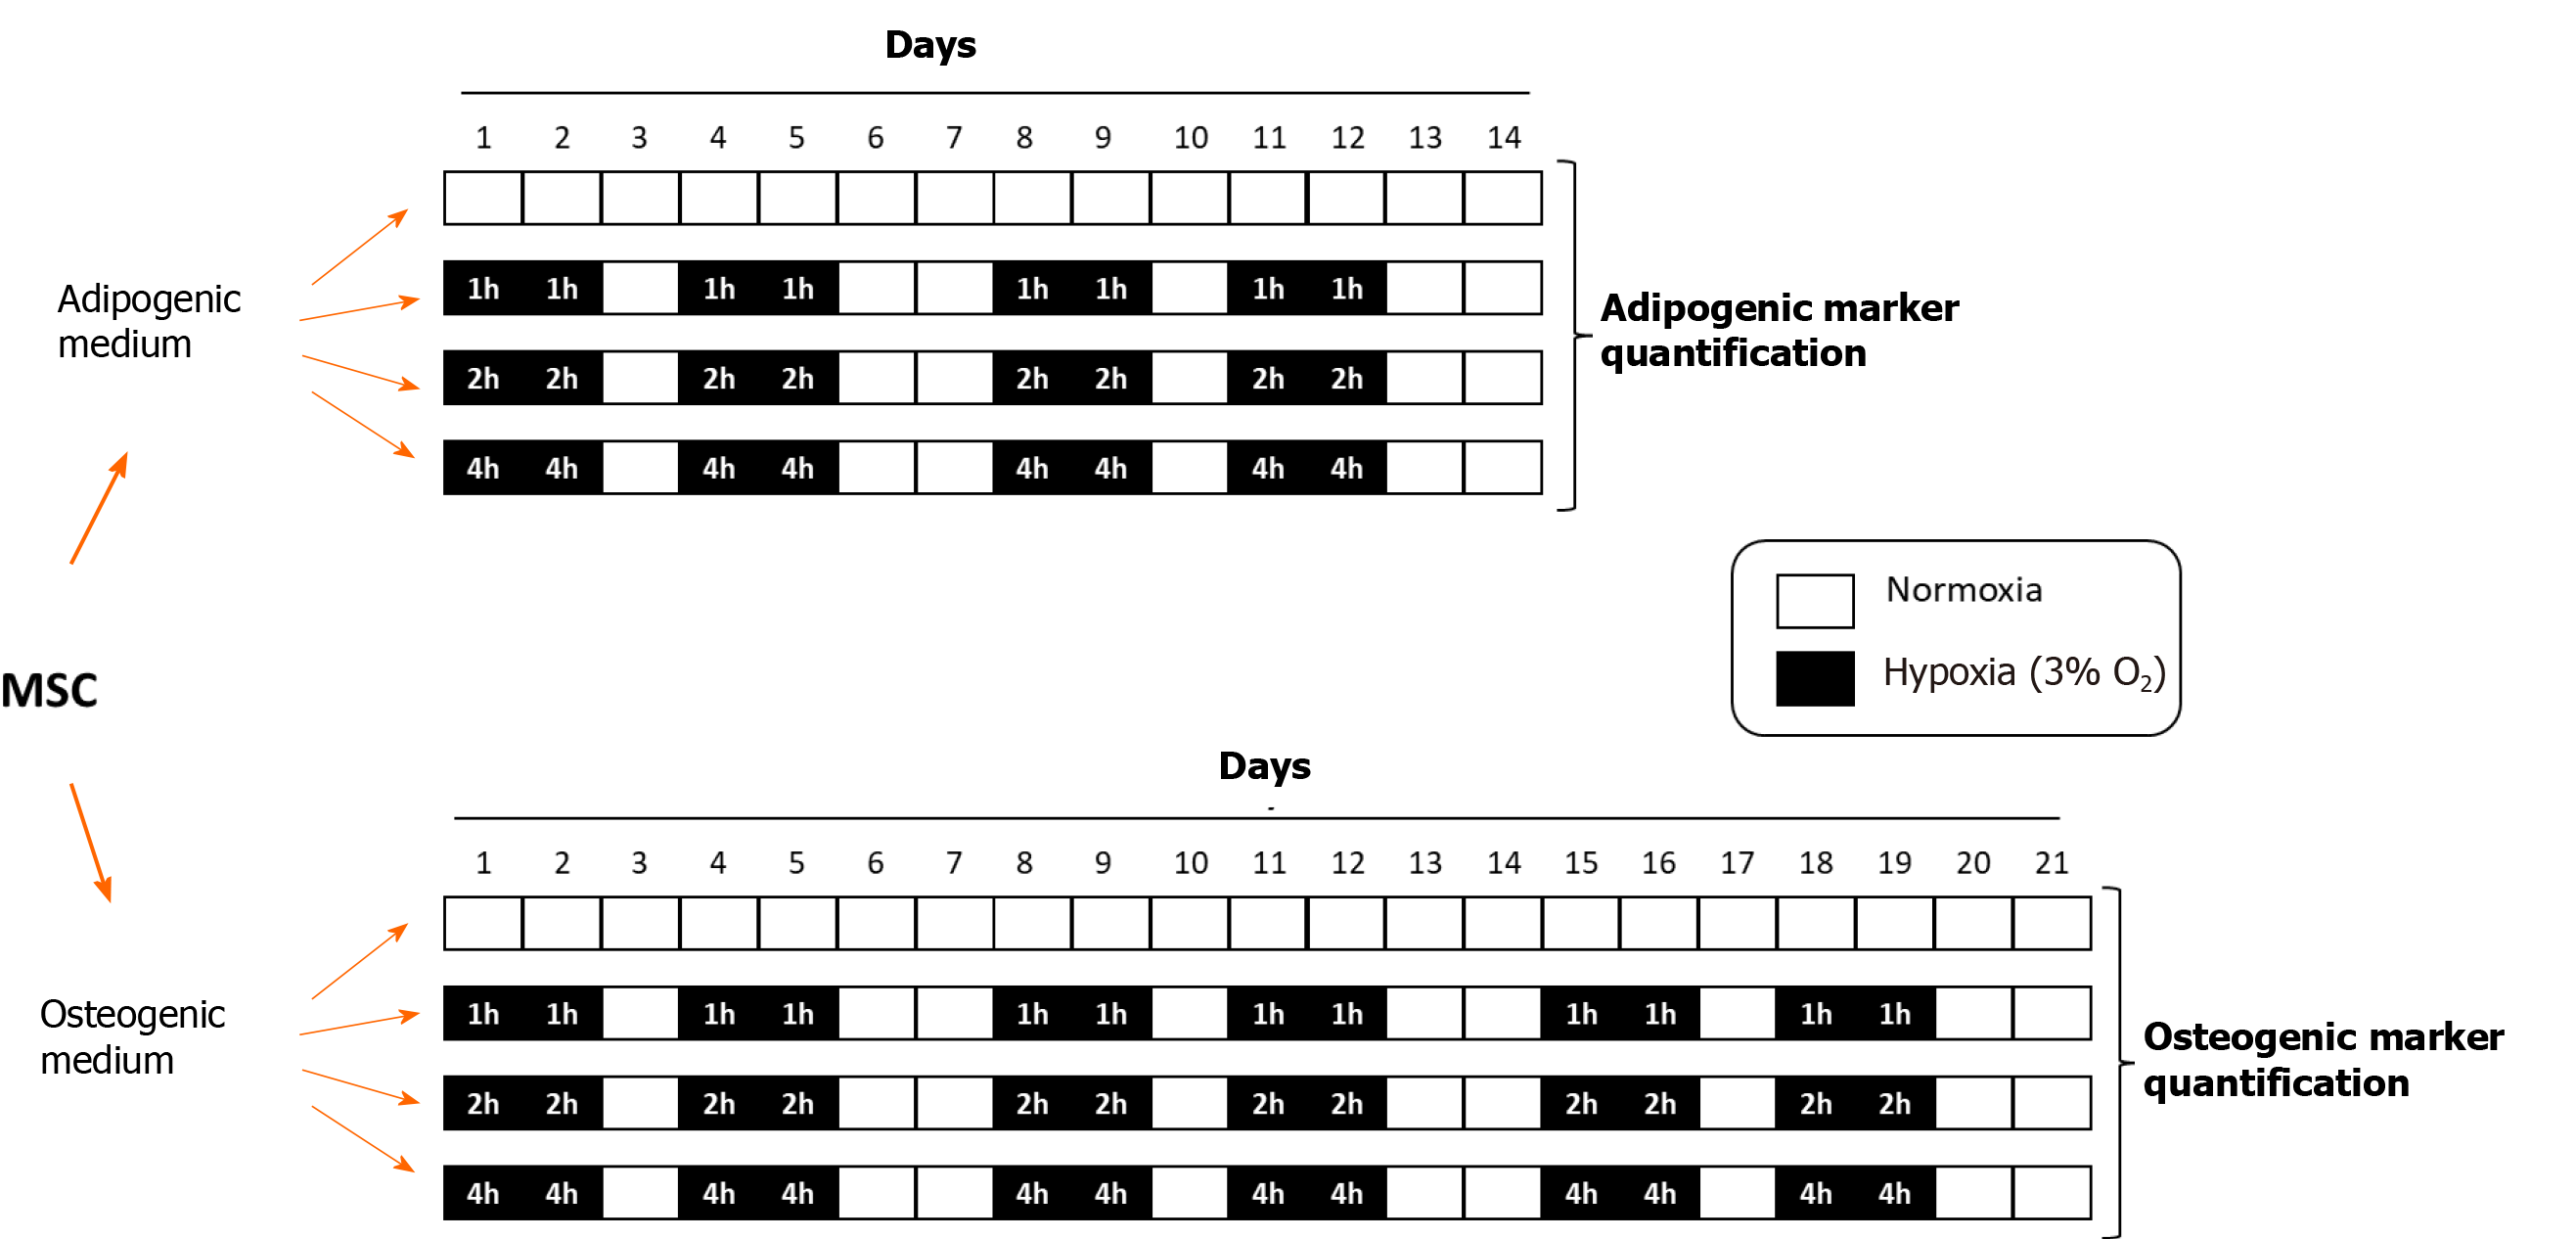
Figure 1 Temporal distribution of mesenchymal stem cells cyclic hypoxia-treatments.
Mesenchymal stem cells induce to differentiate into adipocytes or osteoblasts were exposed to CH during 1, 2 or 4 h/d (3% O2), four days per week. Cultures kept in continuous normoxia were use as controls. MSC: Mesenchymal stem cells.
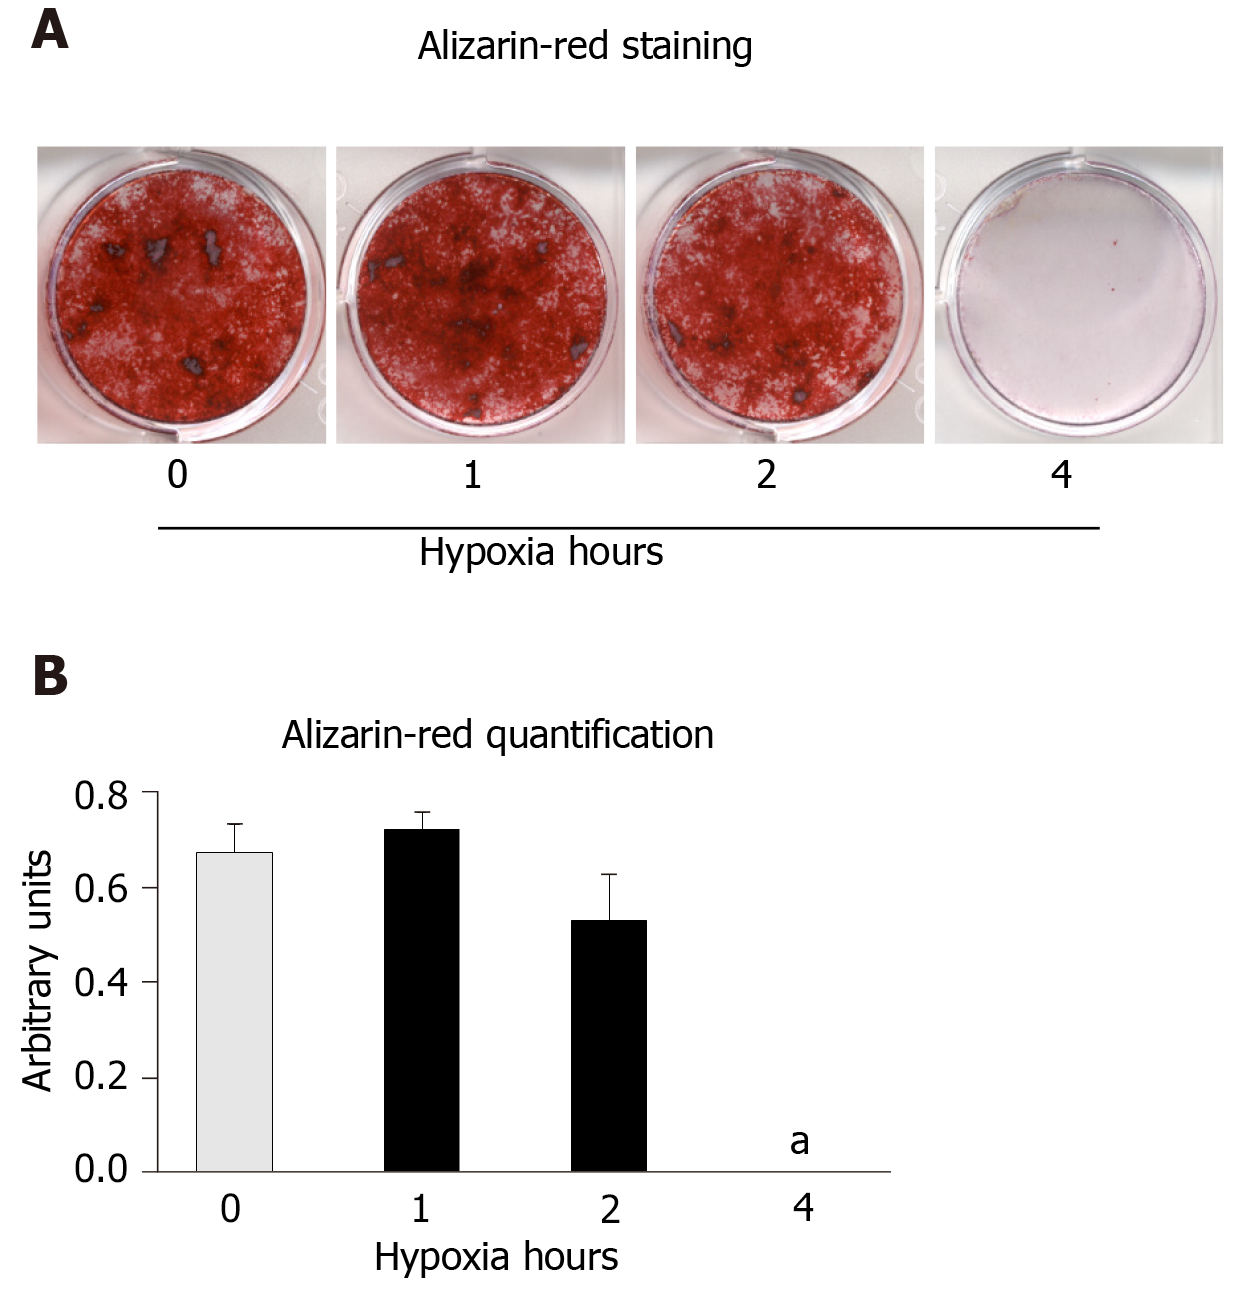
Figure 2 Increased hypoxia time in cyclic hypoxia inhibits extracellular matrix mineralization.
Mesenchymal stem cells induced to differentiate into osteoblasts were exposed to cyclic hypoxia during 1, 2 or 4 h/d (3% O2), four days per week. At day 21, the extracellular matrix mineralization of the cultures was stained with alizarin red. A: Representative images of alizarin-red staining of cultures differentiating into osteoblasts, in normoxia or cyclic hypoxia, after 1, 2 or 4 h of hypoxia; and B: Alizarin-red quantification. aP < 0.05 vs normoxia (0 h of hypoxia).
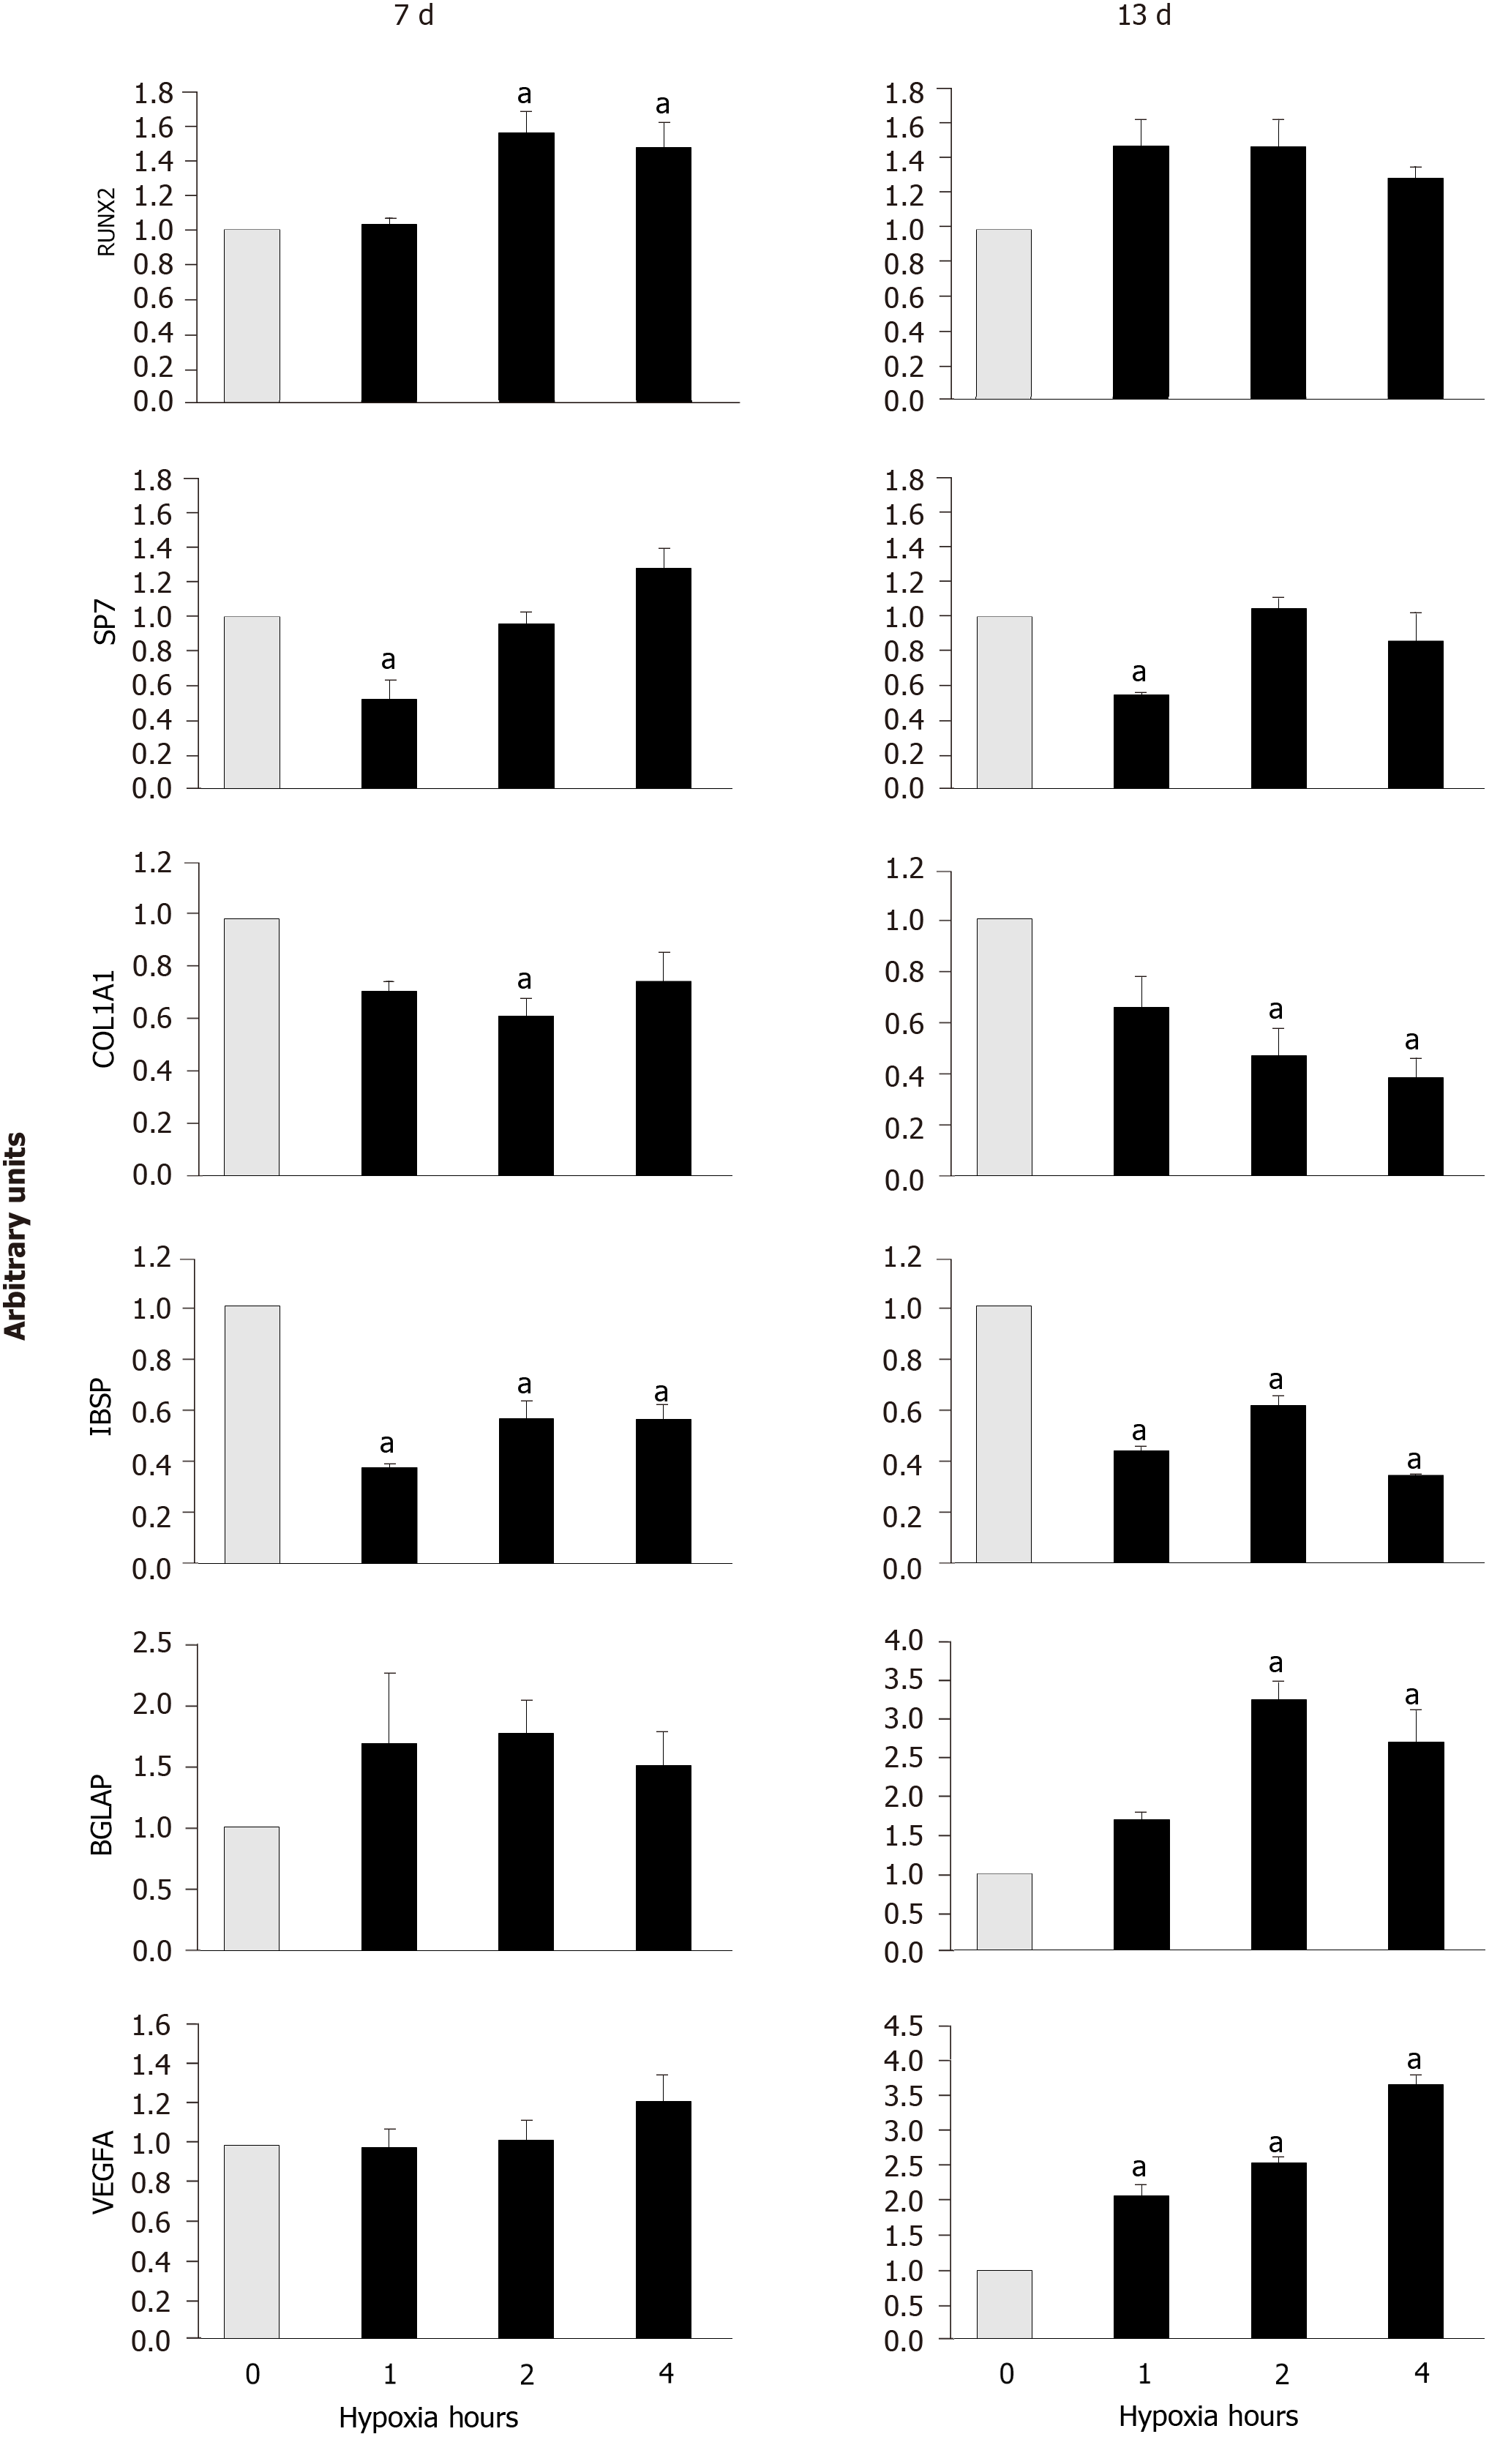
Figure 3 Quantification of gene expressions.
The ones of osteoblastic markers (Runt-related transcription factor 2, Osterix, Collagen, type I, alpha 1, Integrin-binding sialoprotein and BGLAP) and Vascular endothelial growth factor A were measured in mesenchymal stem cells induce to differentiate into osteoblasts, in normoxia (0 hypoxia h) or cyclic hypoxia, at days 7 and 13 of osteogenic induction. aP < 0.05 vs normoxia (0 h of hypoxia). RUNX2: Runt-related transcription factor 2; SP7: Osterix; COL1A1: Collagen, type I, alpha 1; IBSP: Integrin-binding sialoprotein; and VEGFA: Vascular endothelial growth factor A.
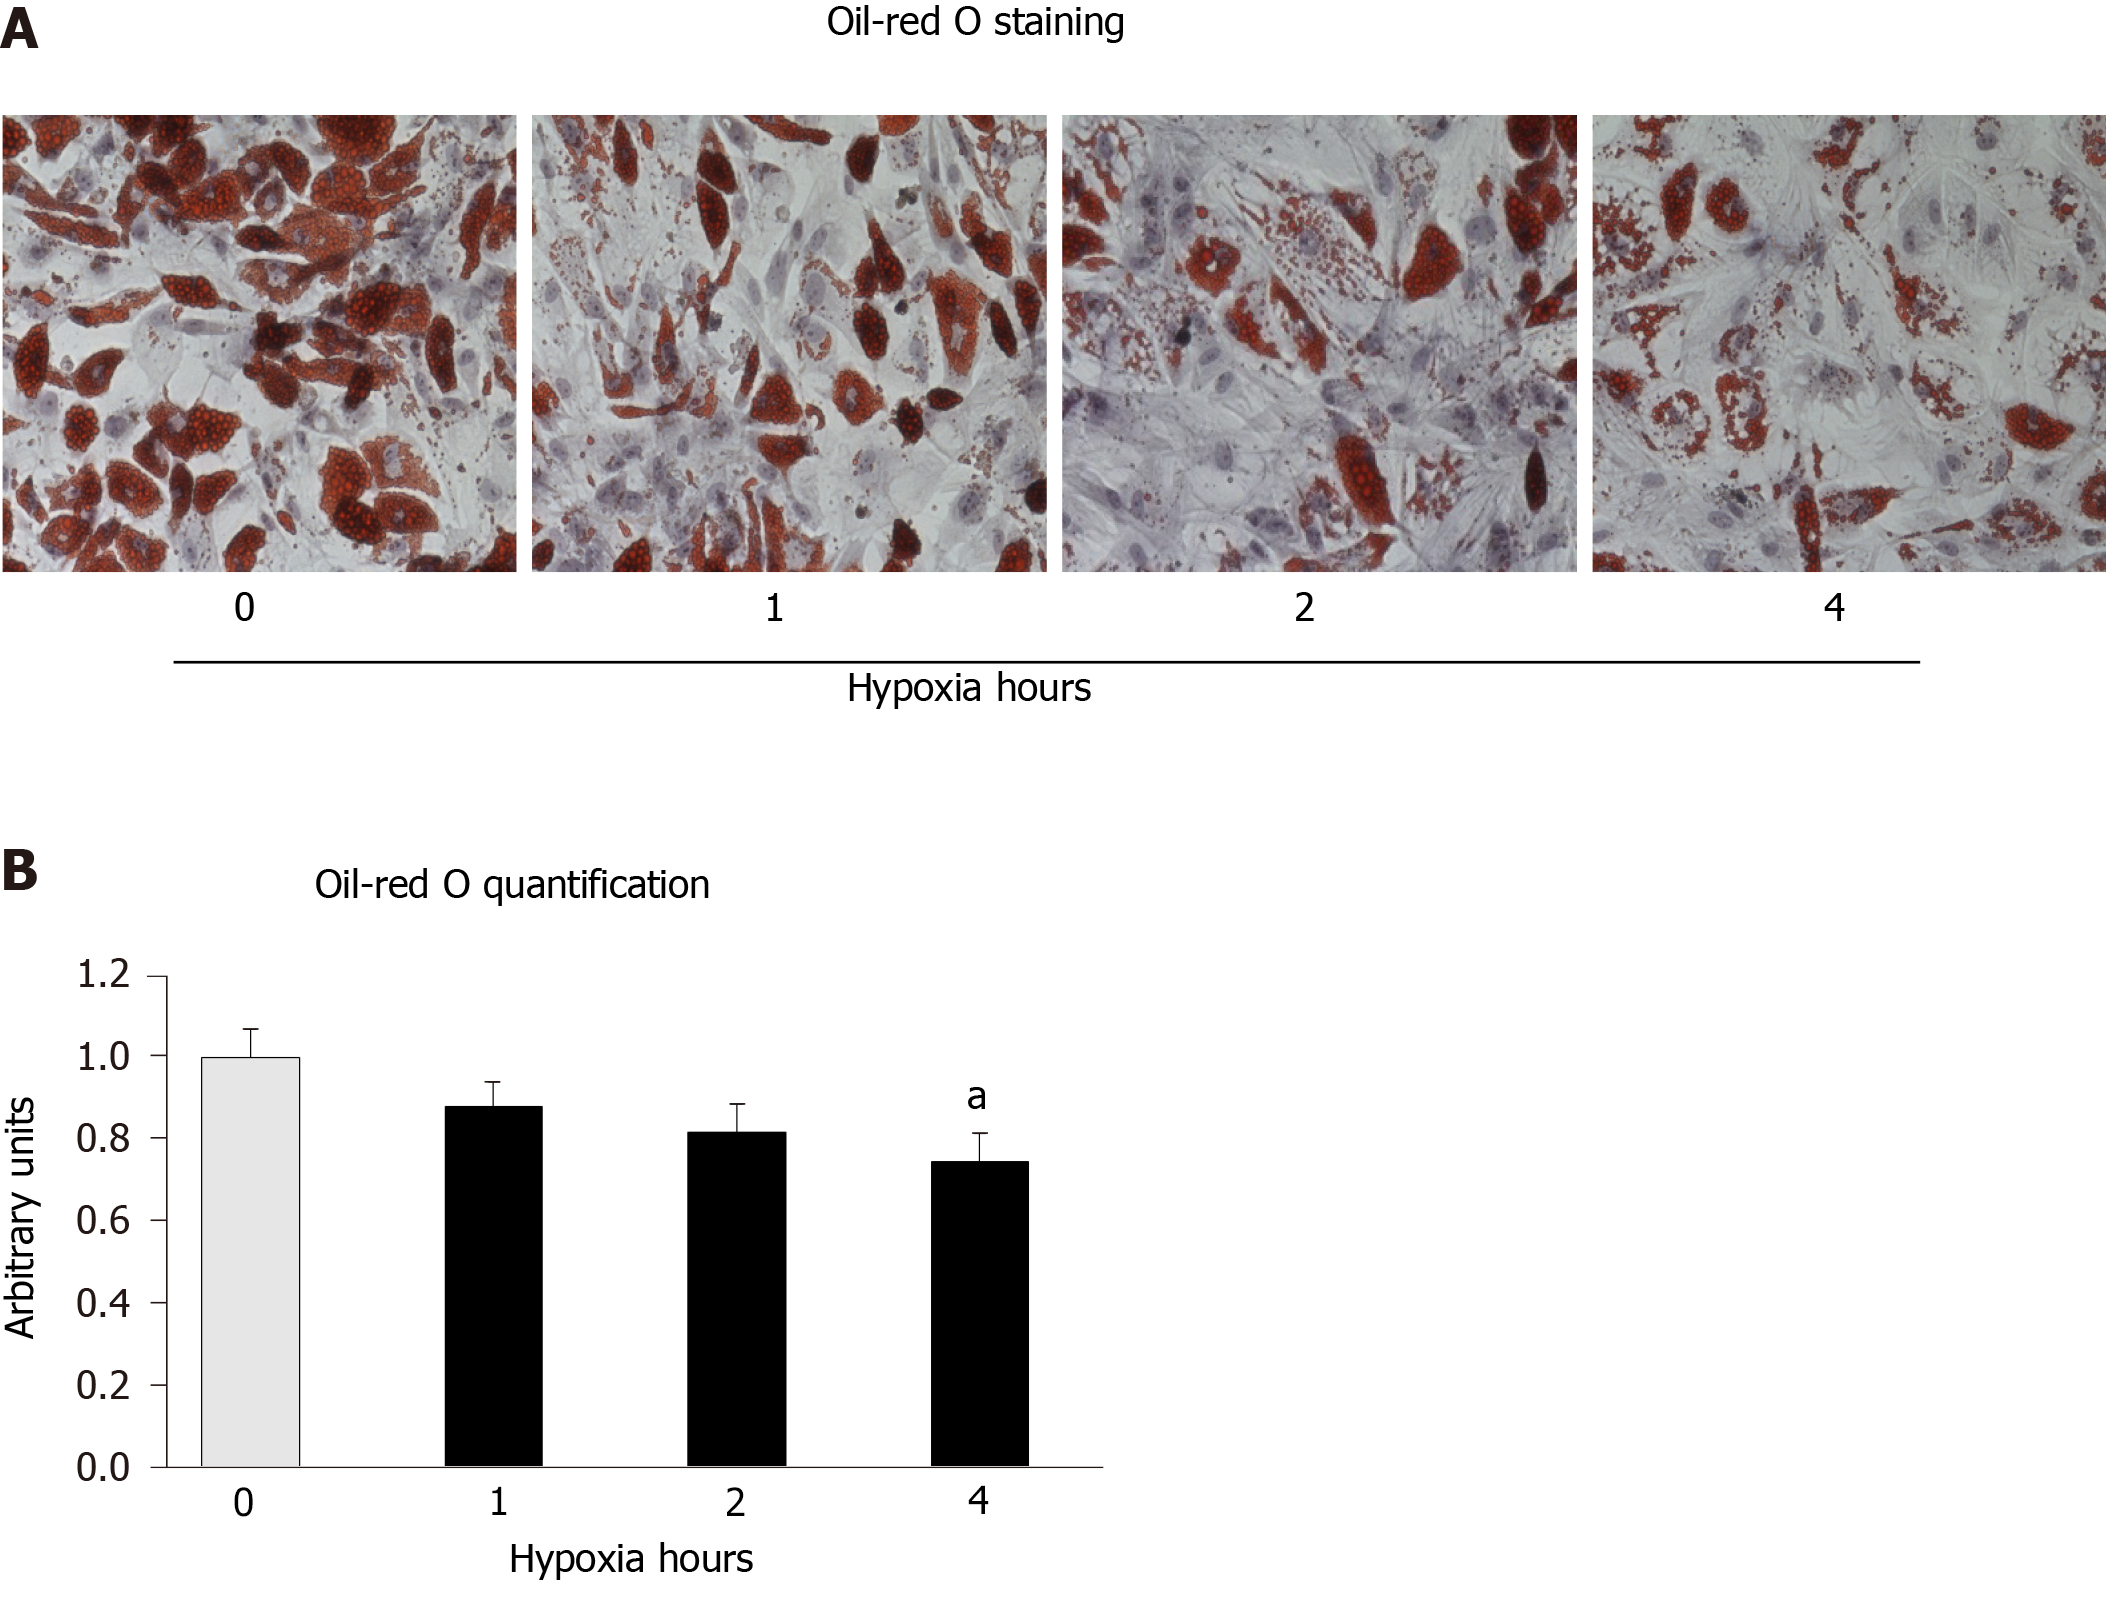
Figure 4 Increased hypoxia time in cyclic hypoxia inhibits lipid-droplet formation.
Mesenchymal stem cells induced to differentiate into adipocytes were exposed to cyclic hypoxia during 1, 2 or 4 h/d (3% O2), four days per week. Cultures were stained with oil-red O to reveal lipid droplets at day 13. A: representative images of oil-red O staining of cultures differentiating into adipocytes, in normoxia or cyclic hypoxia with 1, 2 or 4 h of hypoxia; and B: Oil-red O quantification. aP < 0.05 vs normoxia (0 h of hypoxia).
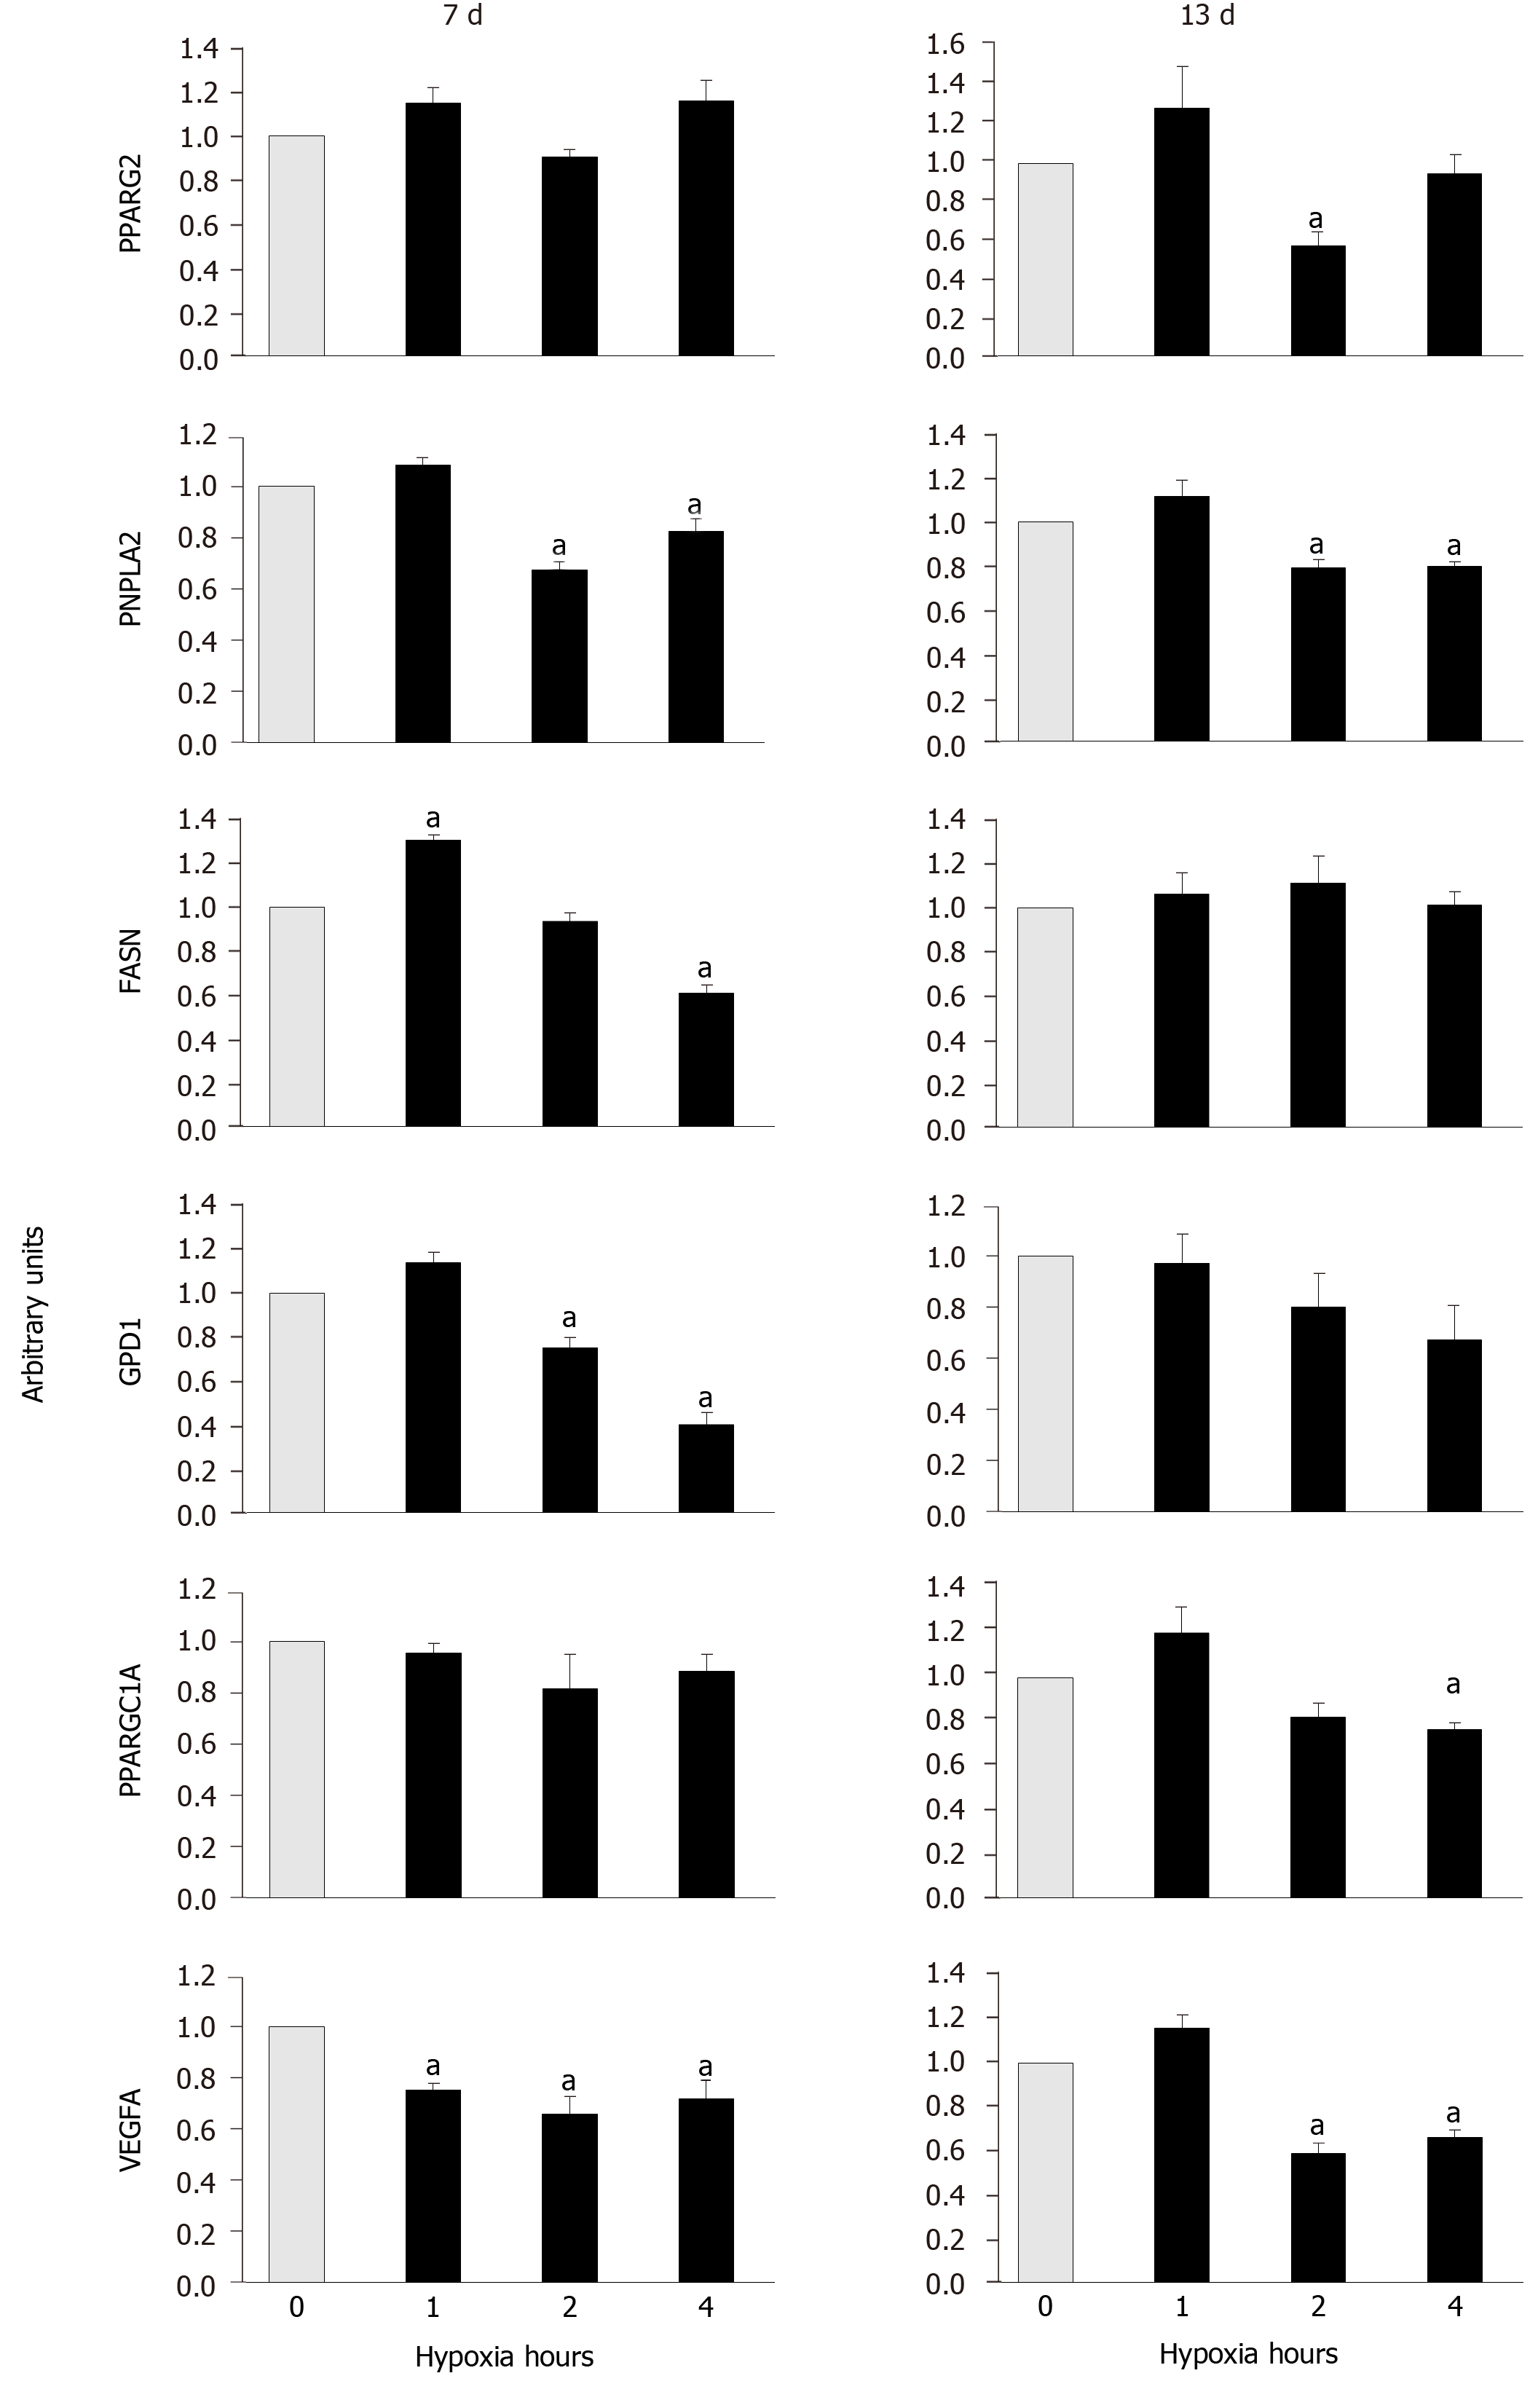
Figure 5 Expressions of adipogenic marker and vascular endothelial growth factor A genes.
The ones encoding adipogenic markers (Peroxisome proliferator-activated receptor gamma 2, patatin-like phospholipase domain-containing protein 2, Fatty acid synthase, Glycerol-3-Phosphate Dehydrogenase 1 and Peroxisome proliferator-activated receptor gamma, coactivator 1 alpha) and vascular endothelial growth factor A were measured in mesenchymal stem cells induce to differentiate into adipocytes. Experiments were carried out in normoxia (0 hypoxia h) or cyclic hypoxia, at days 7 and 13, after adipogenic induction. aP < 0.05 vs normoxia (0 h of hypoxia). VEGFA: Vascular endothelial growth factor A; PPARG2: Peroxisome proliferator-activated receptor gamma 2; PNPLA2: Patatin-like phospholipase domain-containing protein 2; FASN: Fatty acid synthase; GPD1: Glycerol-3-phosphate dehydrogenase 1; and PPARGC1A: Peroxisome proliferator-activated receptor gamma, coactivator 1 alpha.
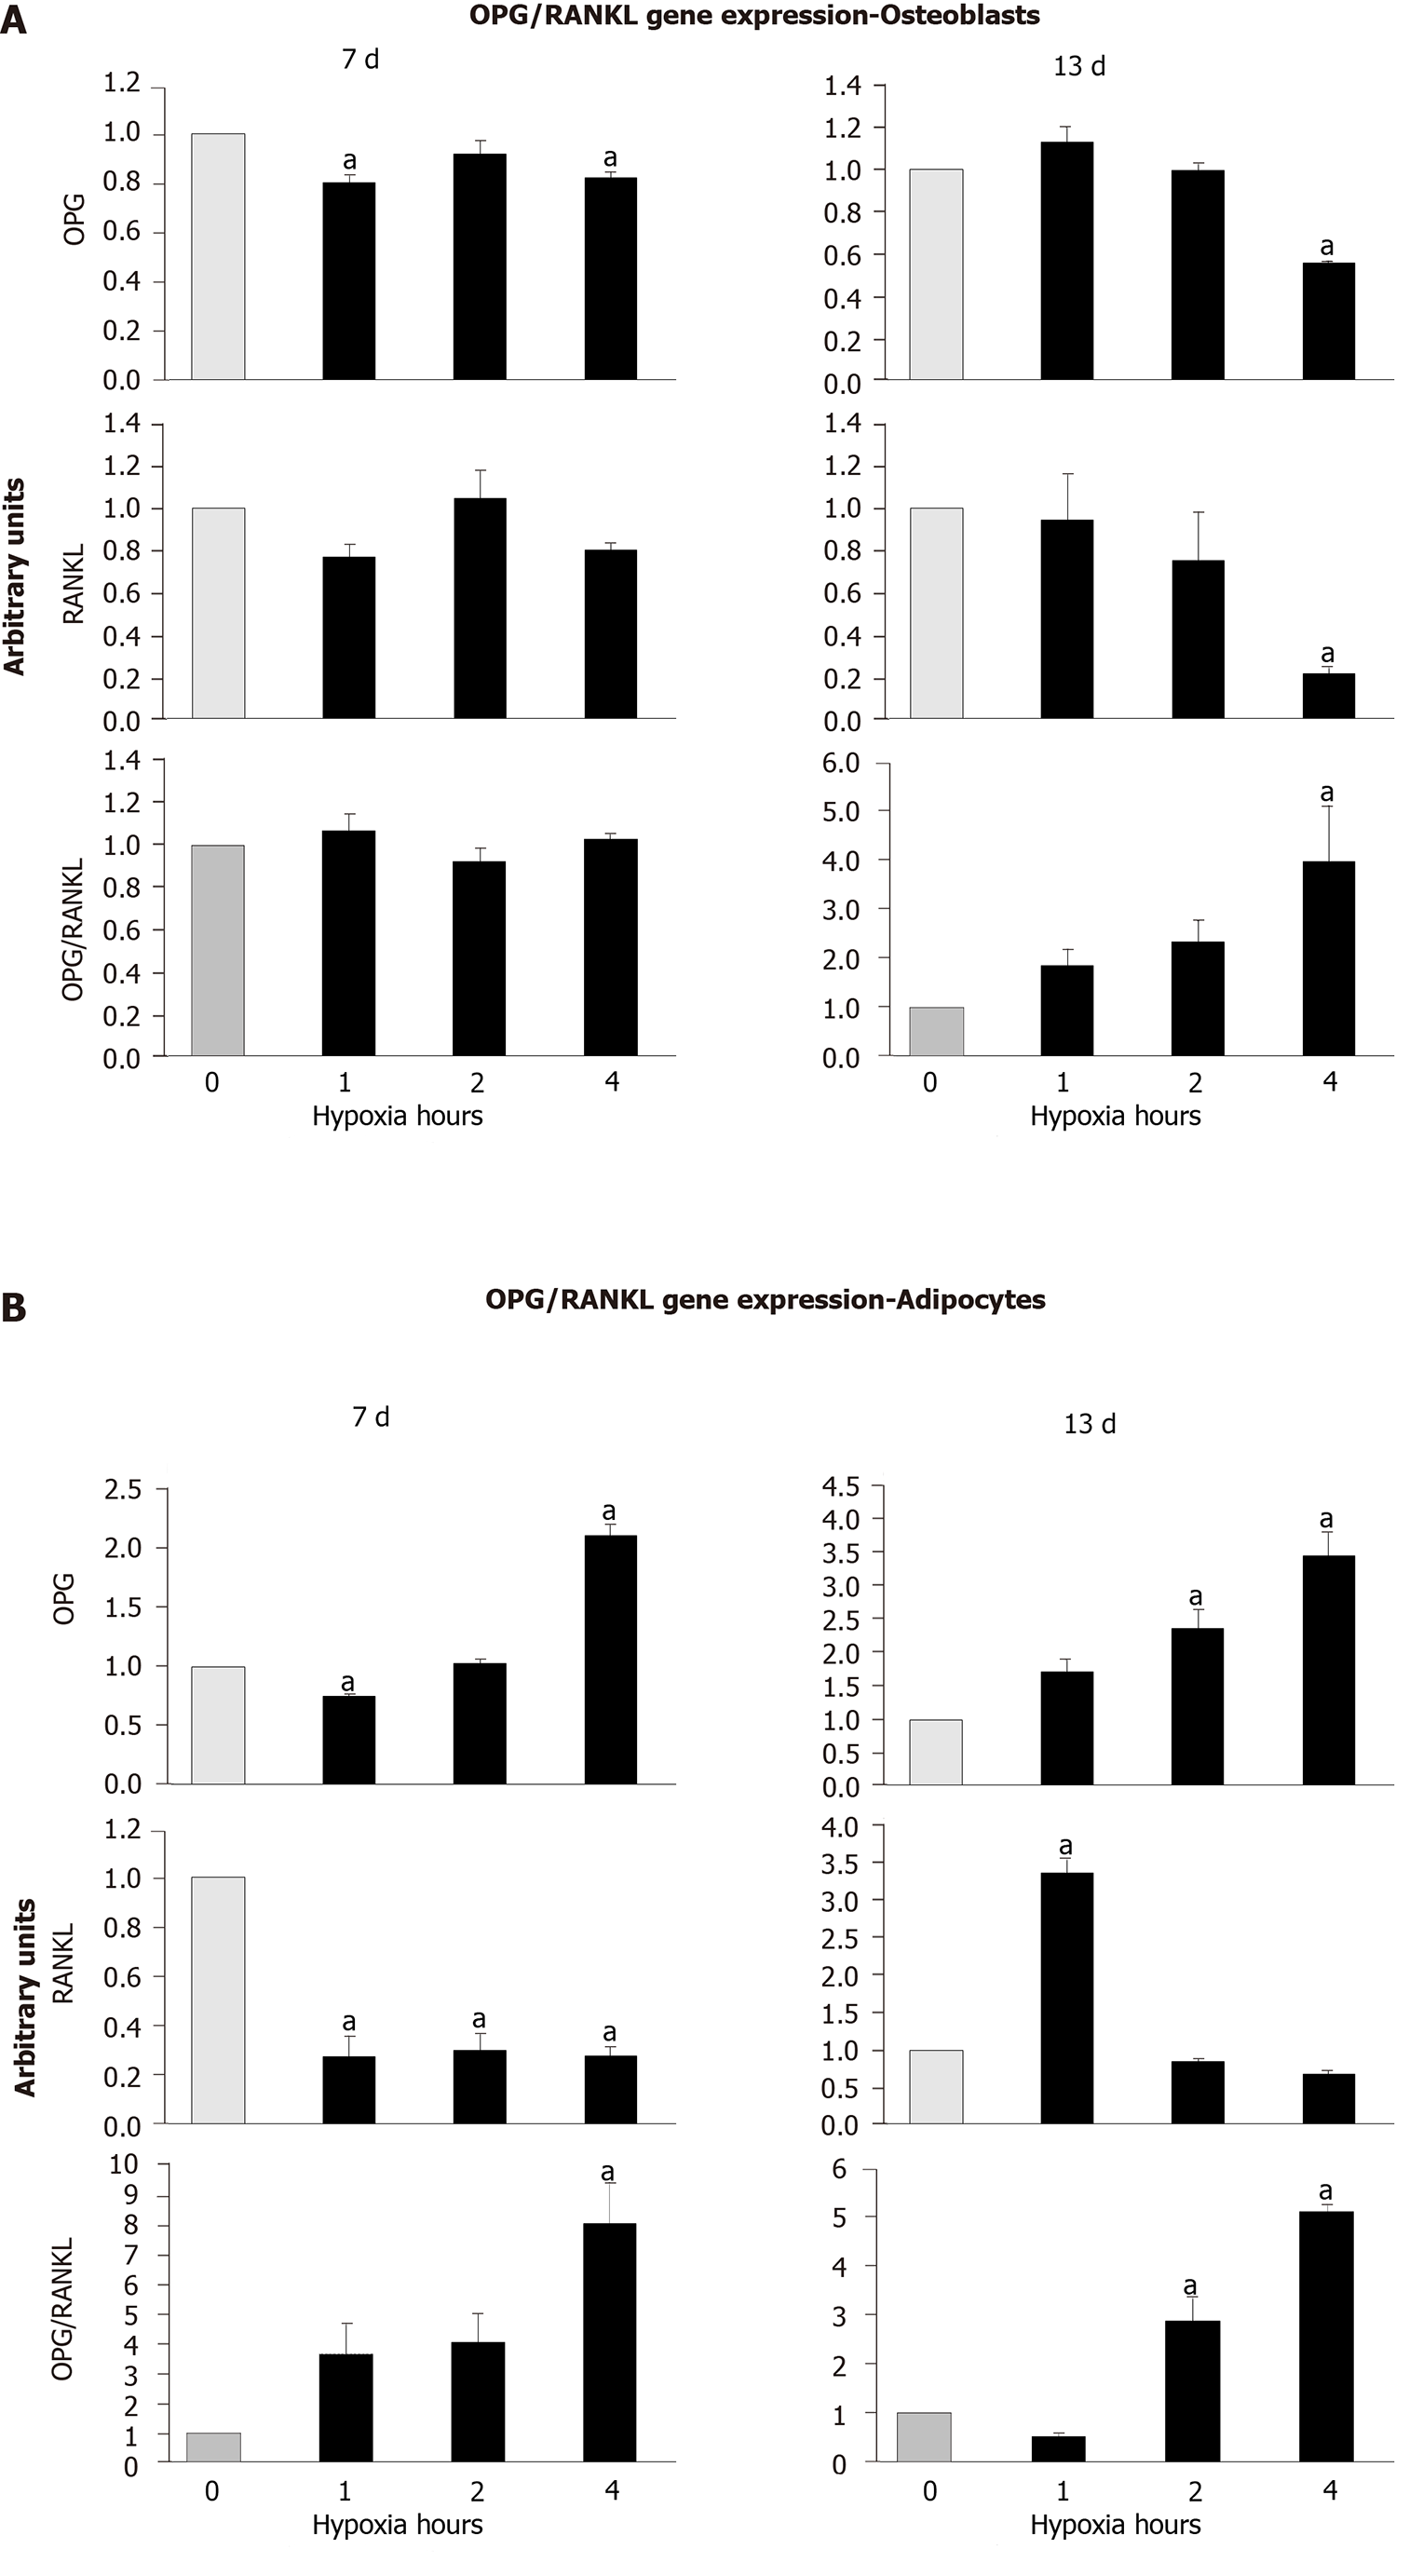
Figure 6 Expressions of osteoprotegerin and receptor activator for nuclear factor kappa B ligand genes.
They were quantified at days 7 and 13 in mesenchymal stem cells differentiating into (A) osteoblasts or (B) adipocytes, in normoxia or different cyclic hypoxia conditions. aP < 0.05 vs normoxia (0 h of hypoxia). OPG: Osteoprotegerin; and RANKL: Receptor activator for nuclear factor kappa B ligand.
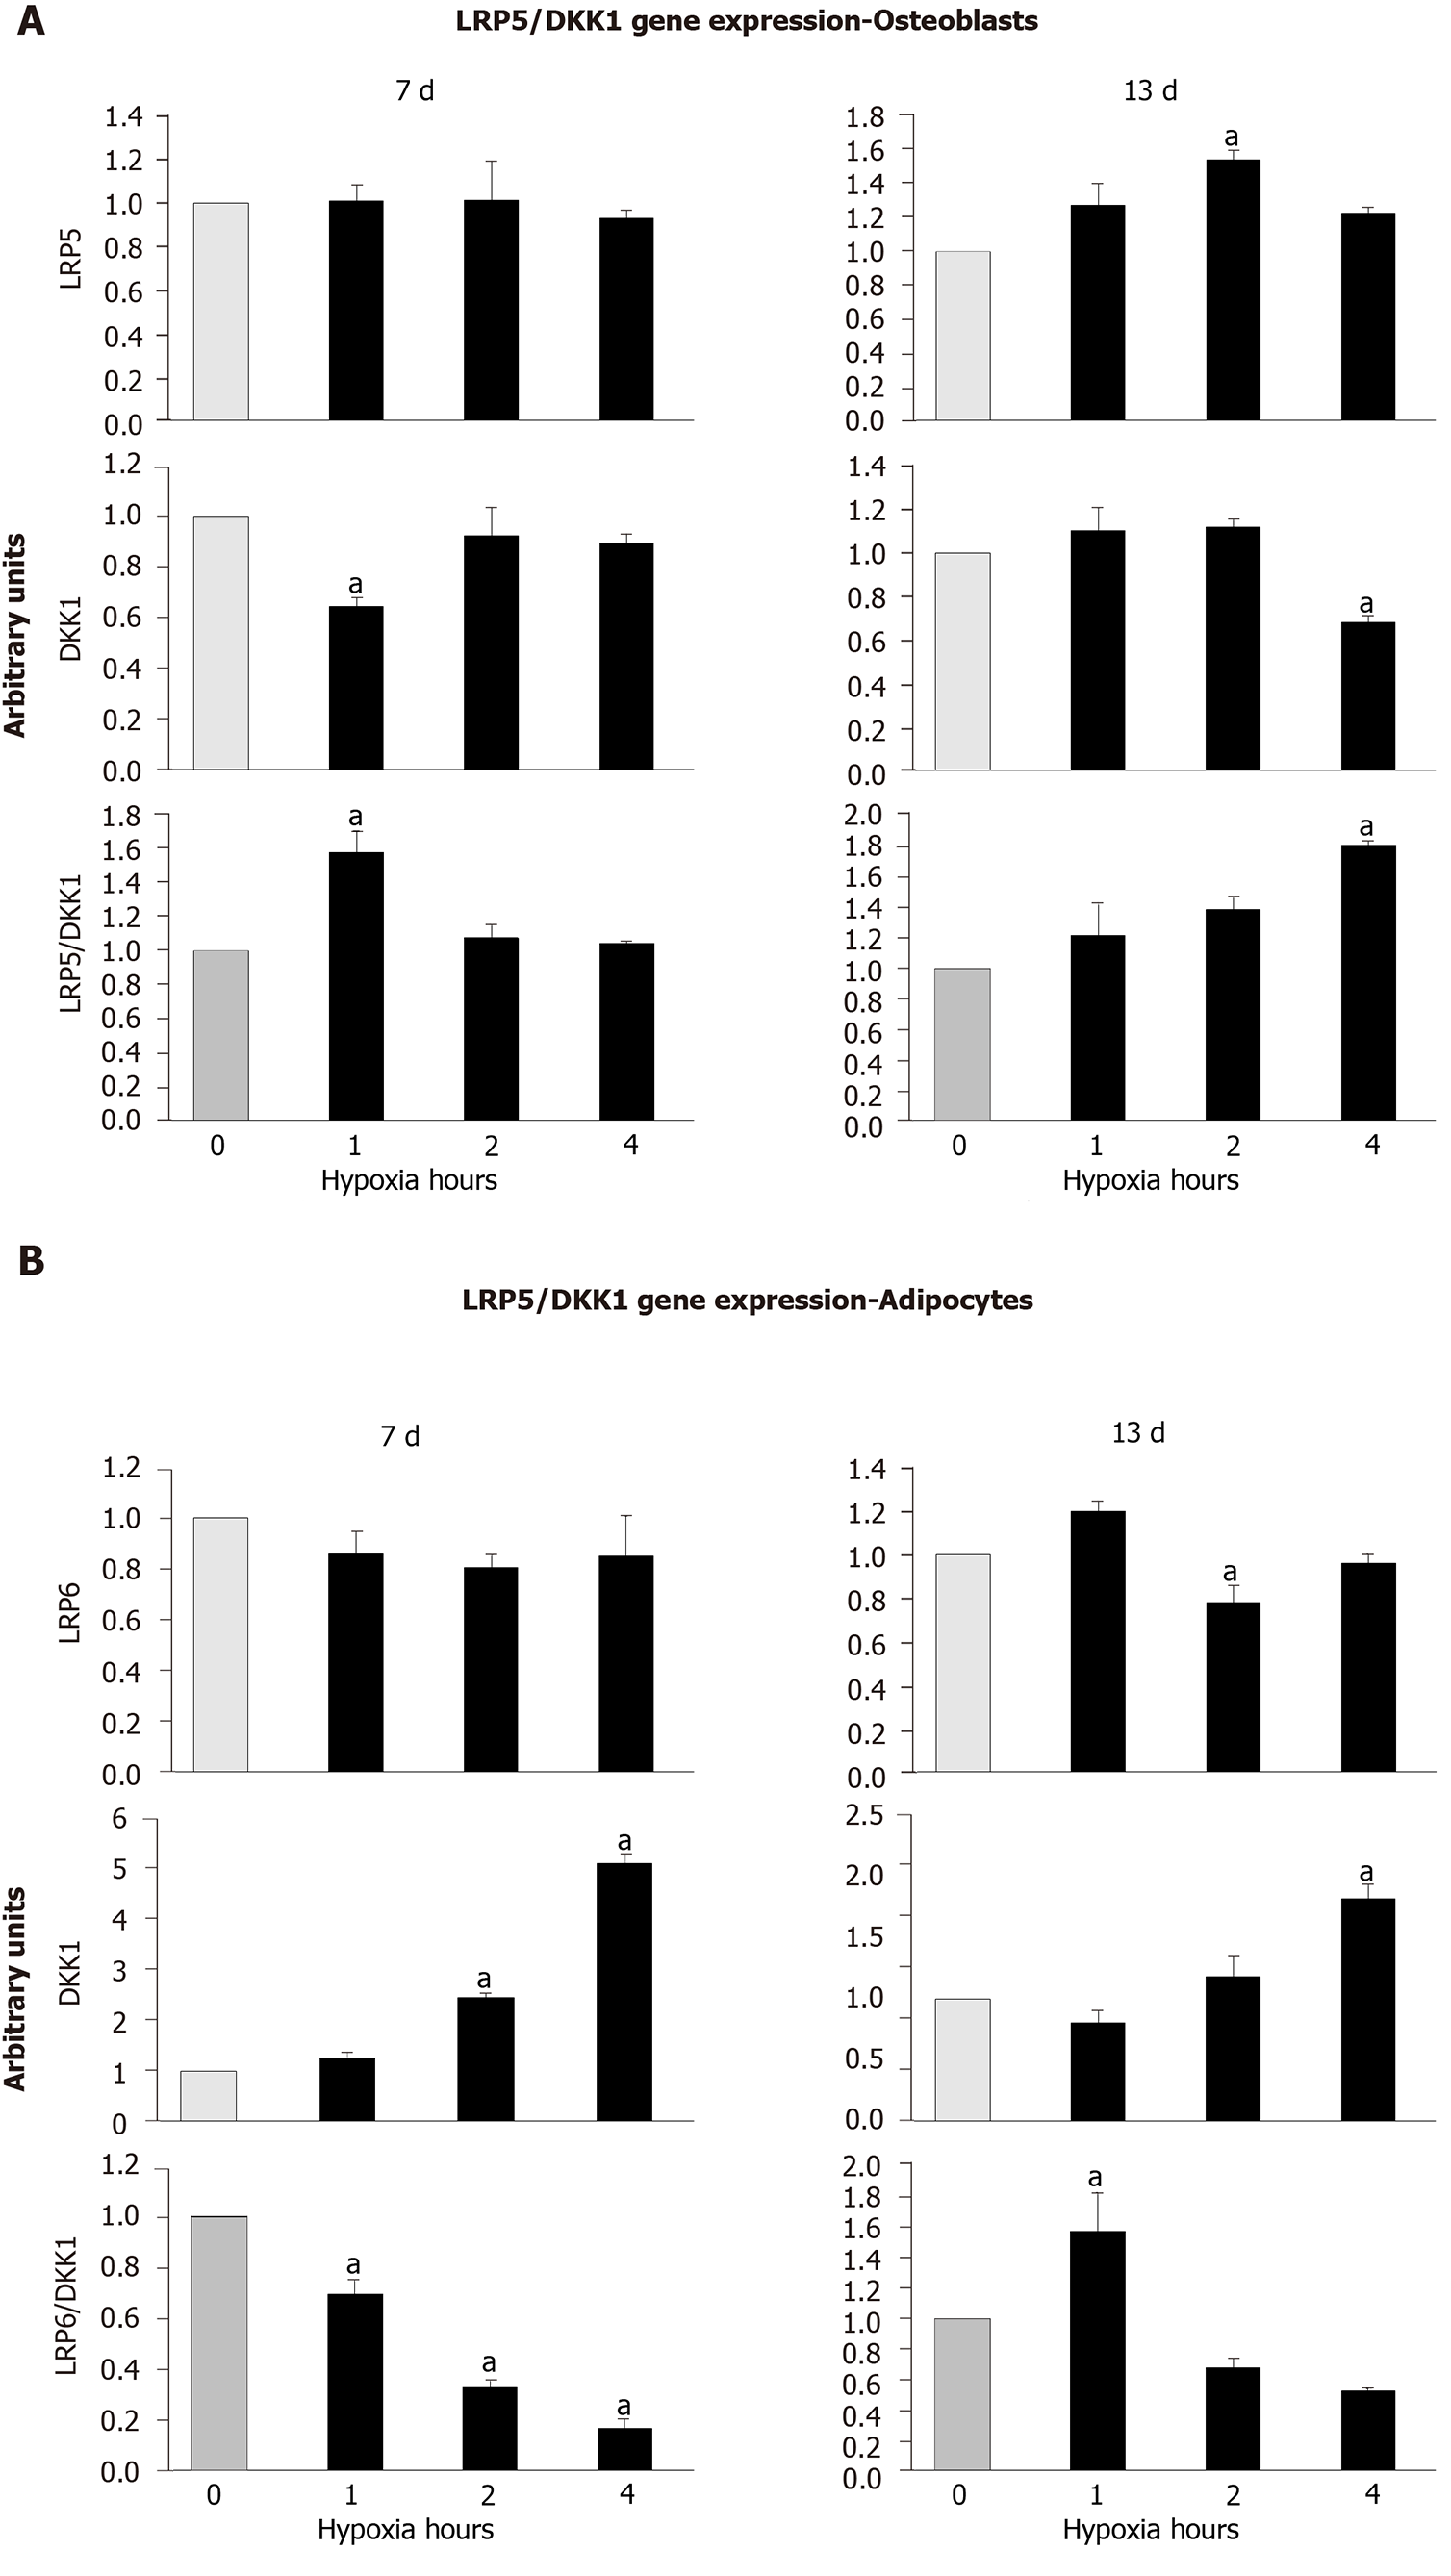
Figure 7 Expressions of low-density lipoprotein receptor related protein 5, low-density lipoprotein receptor related protein 6 and Dickkopf Wnt signaling pathway inhibitor 1 genes.
They were quantified at days 7 and 13, in mesenchymal stem cells differentiating into (A) osteoblasts or (B) adipocytes, exposed to normoxia or different cyclic hypoxia conditions. aP < 0.05 vs normoxia (0 h of hypoxia). DKK1: Dickkopf Wnt signaling pathway inhibitor 1; LRP6: Low-density lipoprotein receptor related protein 6; and LRP5: Low-density lipoprotein receptor related protein 5.
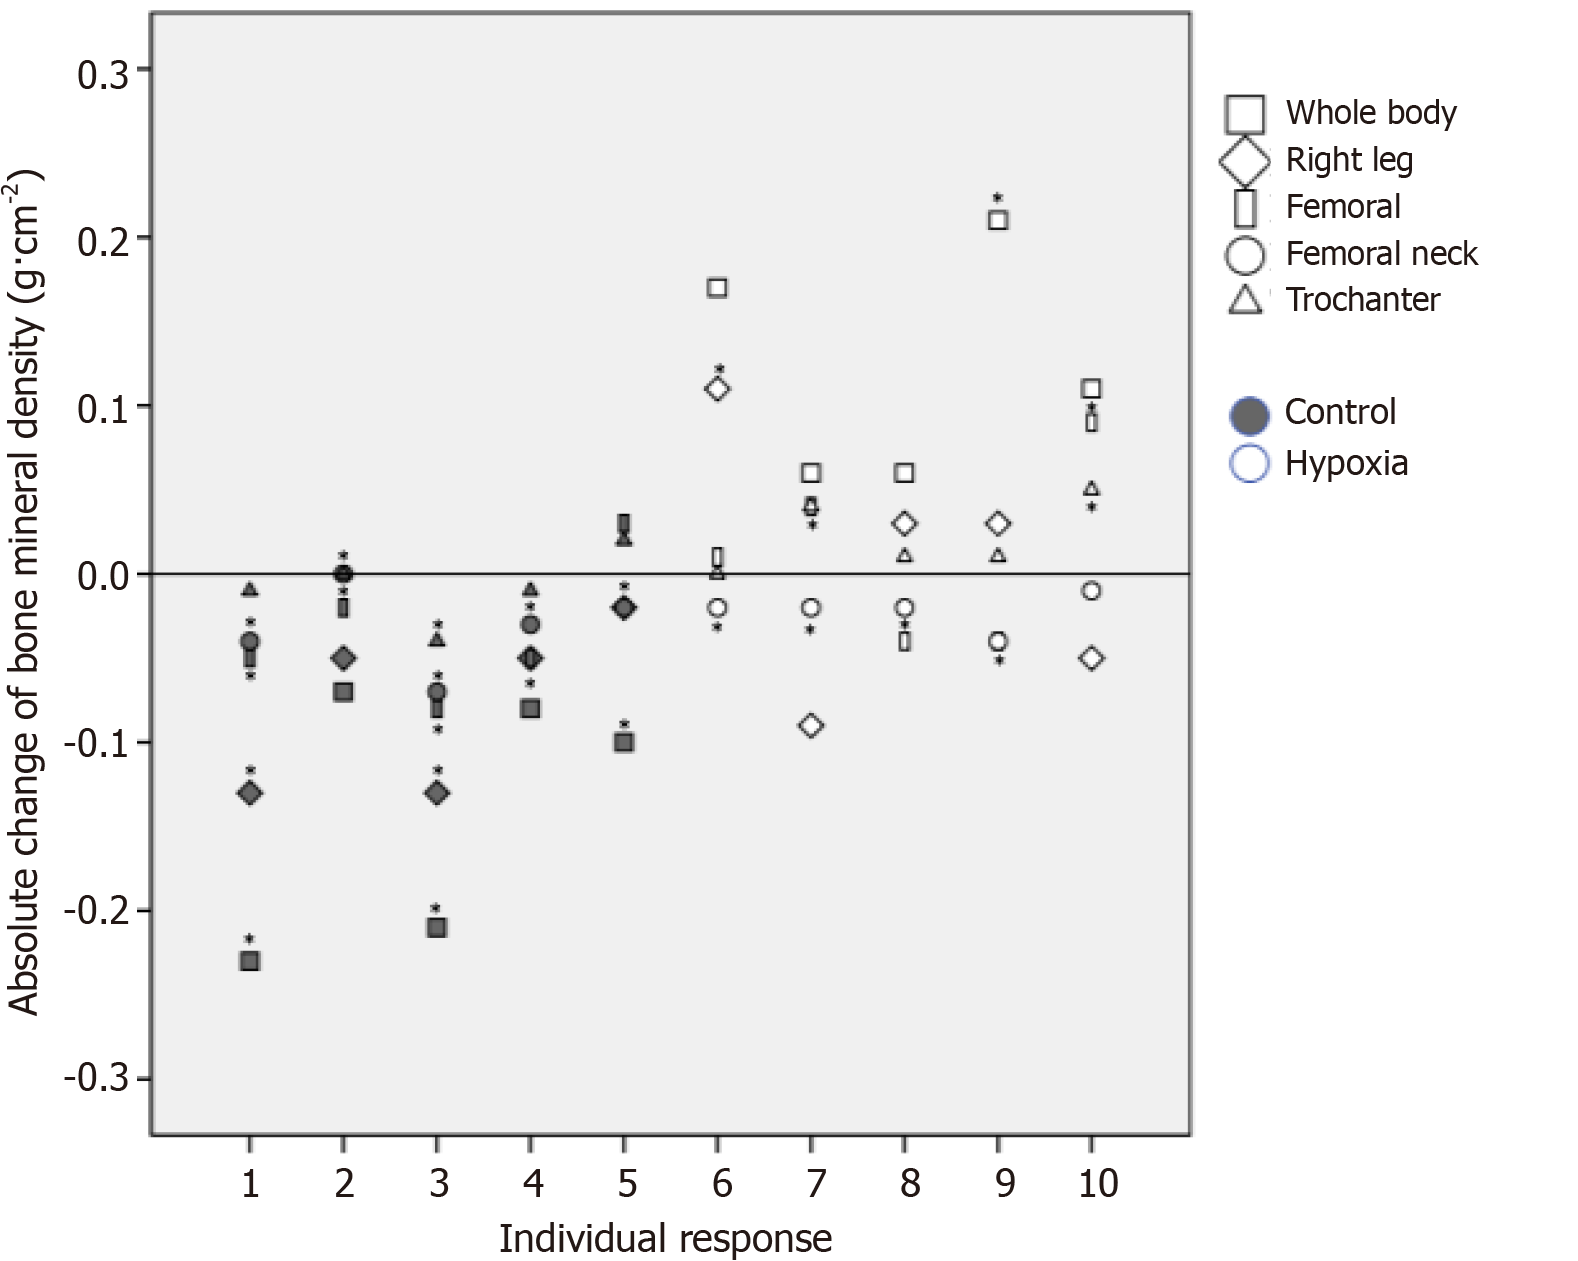
Figure 8 Individual response of bone mineral density.
Changes were recorded after 18 wk of normal daily activities (control) or hypoxia exposure. Intra-individual difference equal or greater than minimum detectable change (i.e., 0.10 g ∙ cm–2 of whole-body bone mineral density in relation to hypoxia group).
- Citation: Camacho-Cardenosa M, Quesada-Gómez JM, Camacho-Cardenosa A, Leal A, Dorado G, Torrecillas-Baena B, Casado-Díaz A. Effects of normobaric cyclic hypoxia exposure on mesenchymal stem-cell differentiation–pilot study on bone parameters in elderly. World J Stem Cells 2020; 12(12): 1667-1690
- URL: https://www.wjgnet.com/1948-0210/full/v12/i12/1667.htm
- DOI: https://dx.doi.org/10.4252/wjsc.v12.i12.1667


