Copyright
©The Author(s) 2020.
World J Stem Cells. Nov 26, 2020; 12(11): 1377-1395
Published online Nov 26, 2020. doi: 10.4252/wjsc.v12.i11.1377
Published online Nov 26, 2020. doi: 10.4252/wjsc.v12.i11.1377
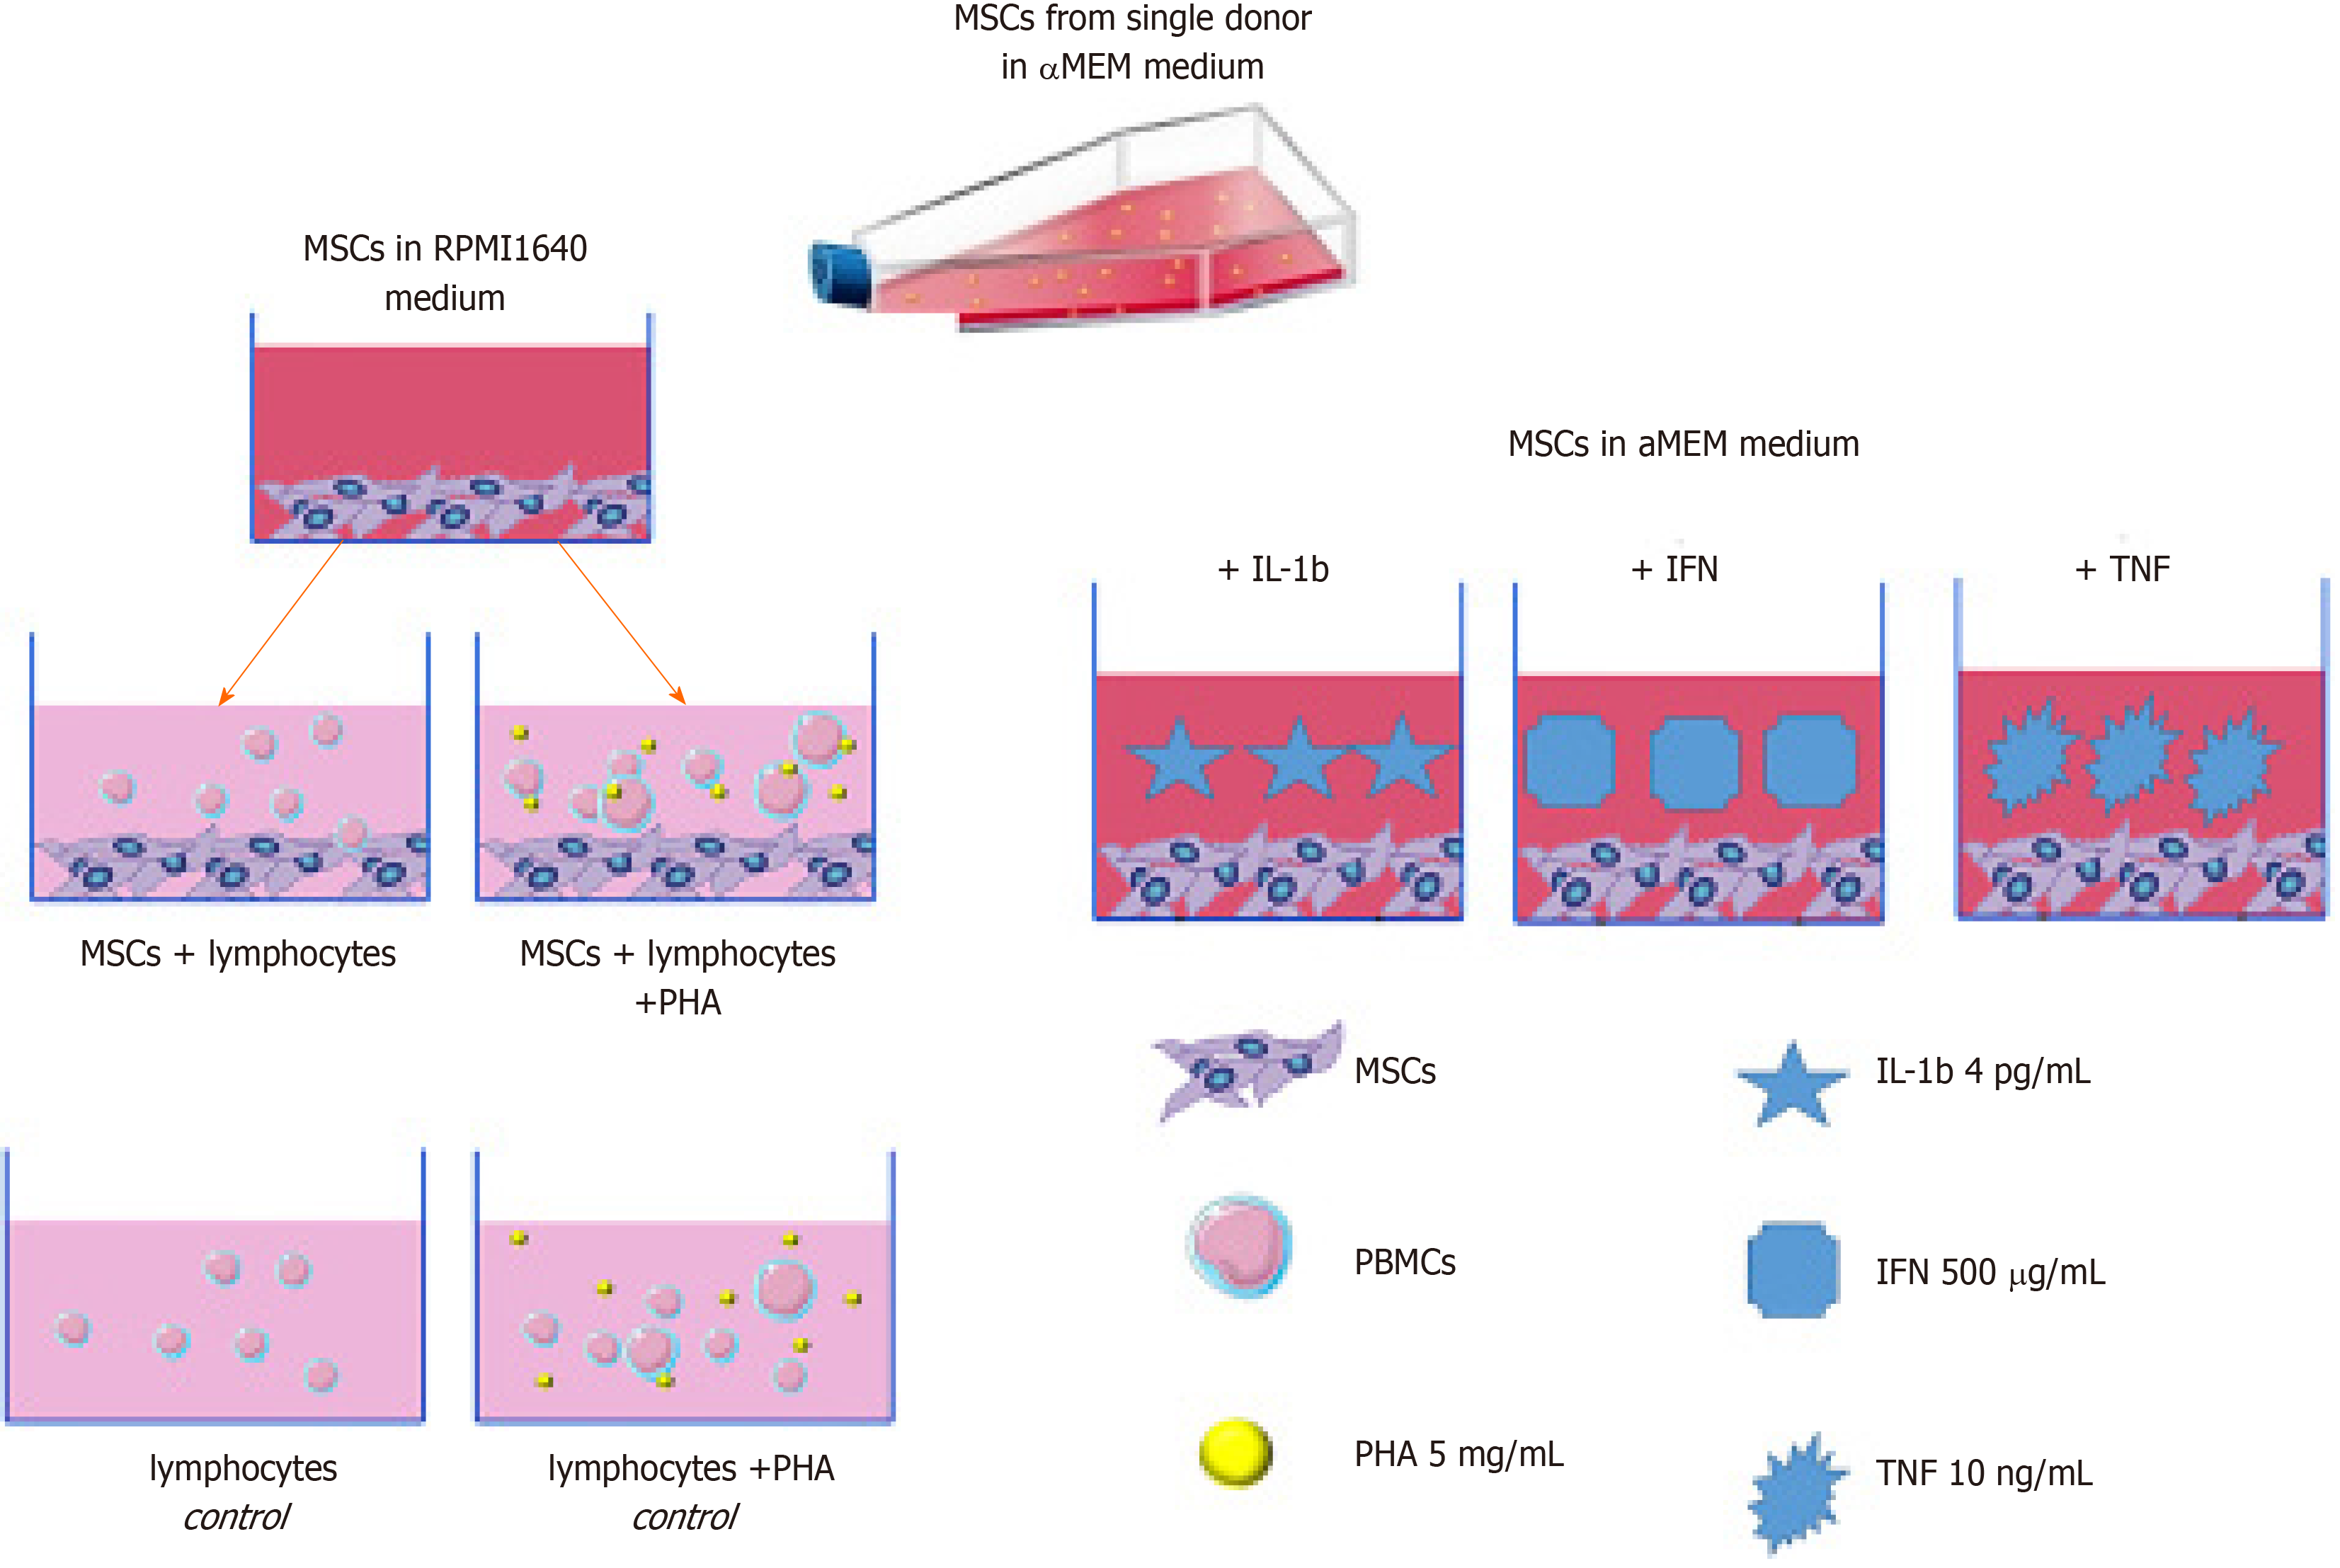
Figure 1 Experimental design.
MSCs: Multipotent mesenchymal stromal cells; PBMCs: Peripheral blood mononuclear cells; PHA: Phytohemagglutinin; IL: Interleukin; IFN: Interferon; TNF: Tumour necrosis factor.
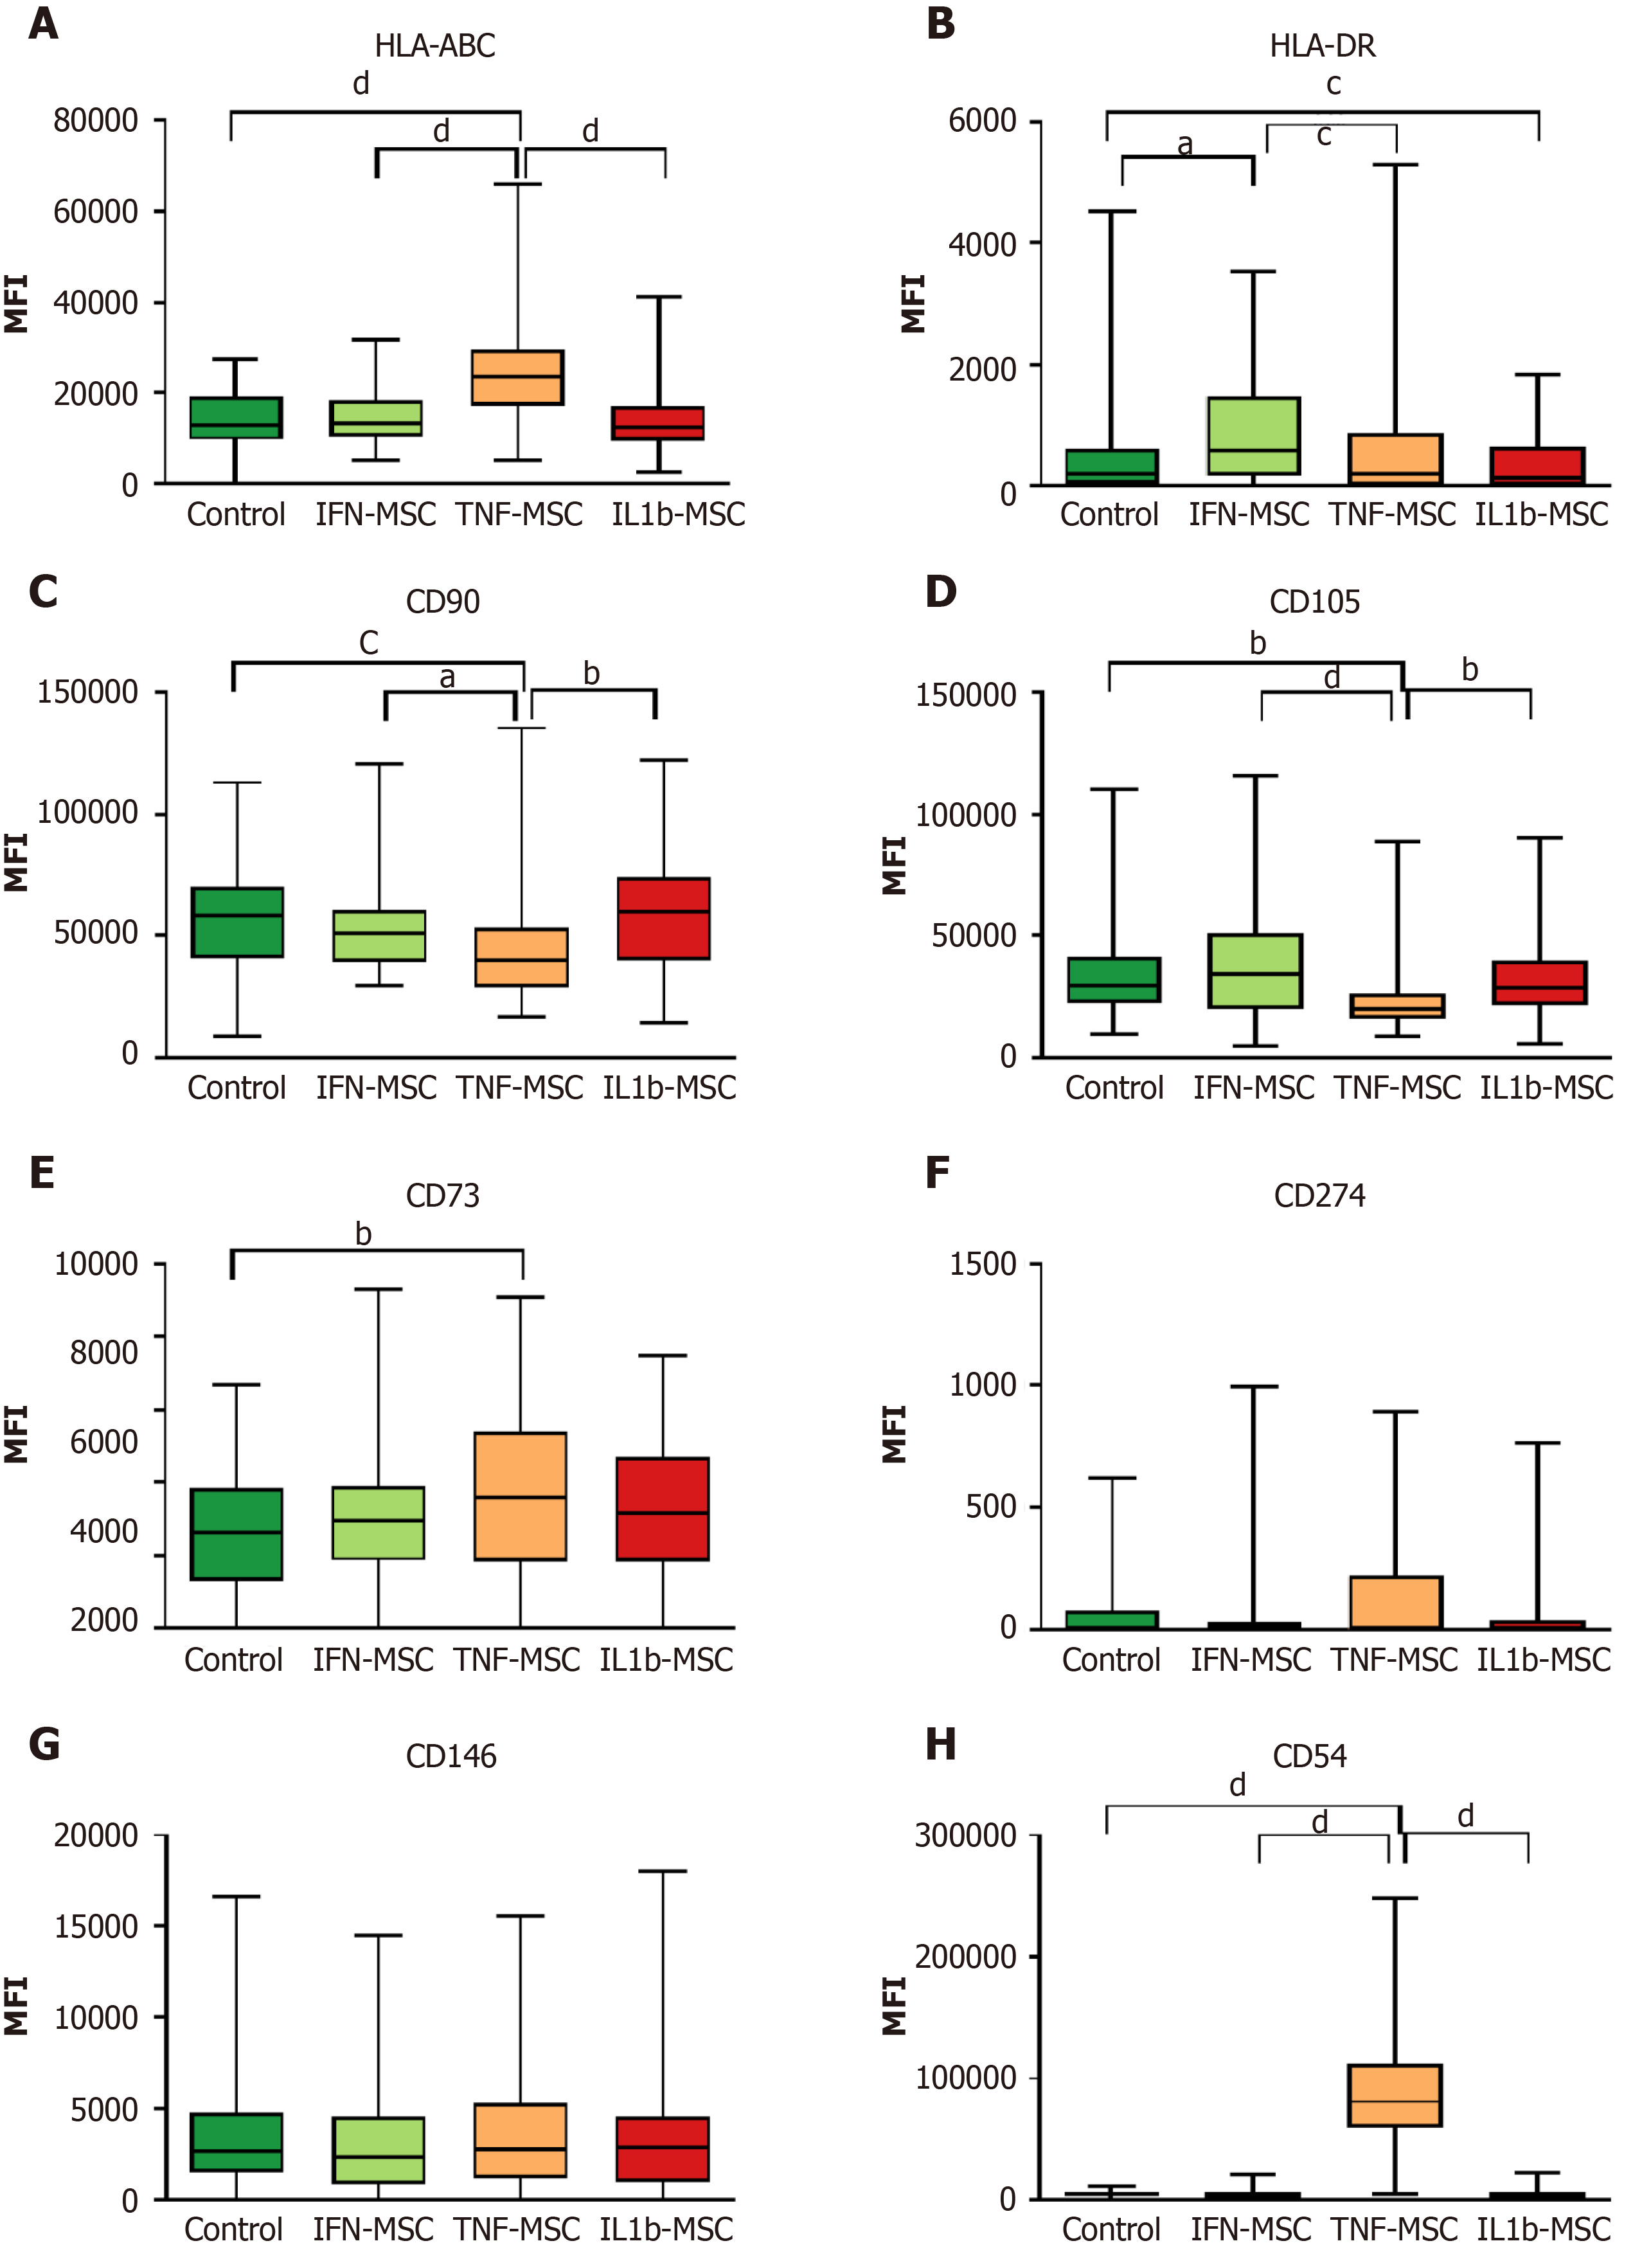
Figure 2 Median fluorescence intensity of multipotent mesenchymal stromal cell markers after treatment with pro-inflammatory cytokines.
A: HLA-ABC; B: HLA-DR; C: CD90; D: CD105; E: CD73; F: CD274; G: CD146; H: CD54. The analysis was performed on 38 mesenchymal stromal cell samples. The significance of differences was assessed by the method of multiple comparisons in GraphPad and is indicated in the figure: aP < 0.05, bP < 0.005, cP < 0.0005, dP < 0.0001. MSCs: Multipotent mesenchymal stromal cells.
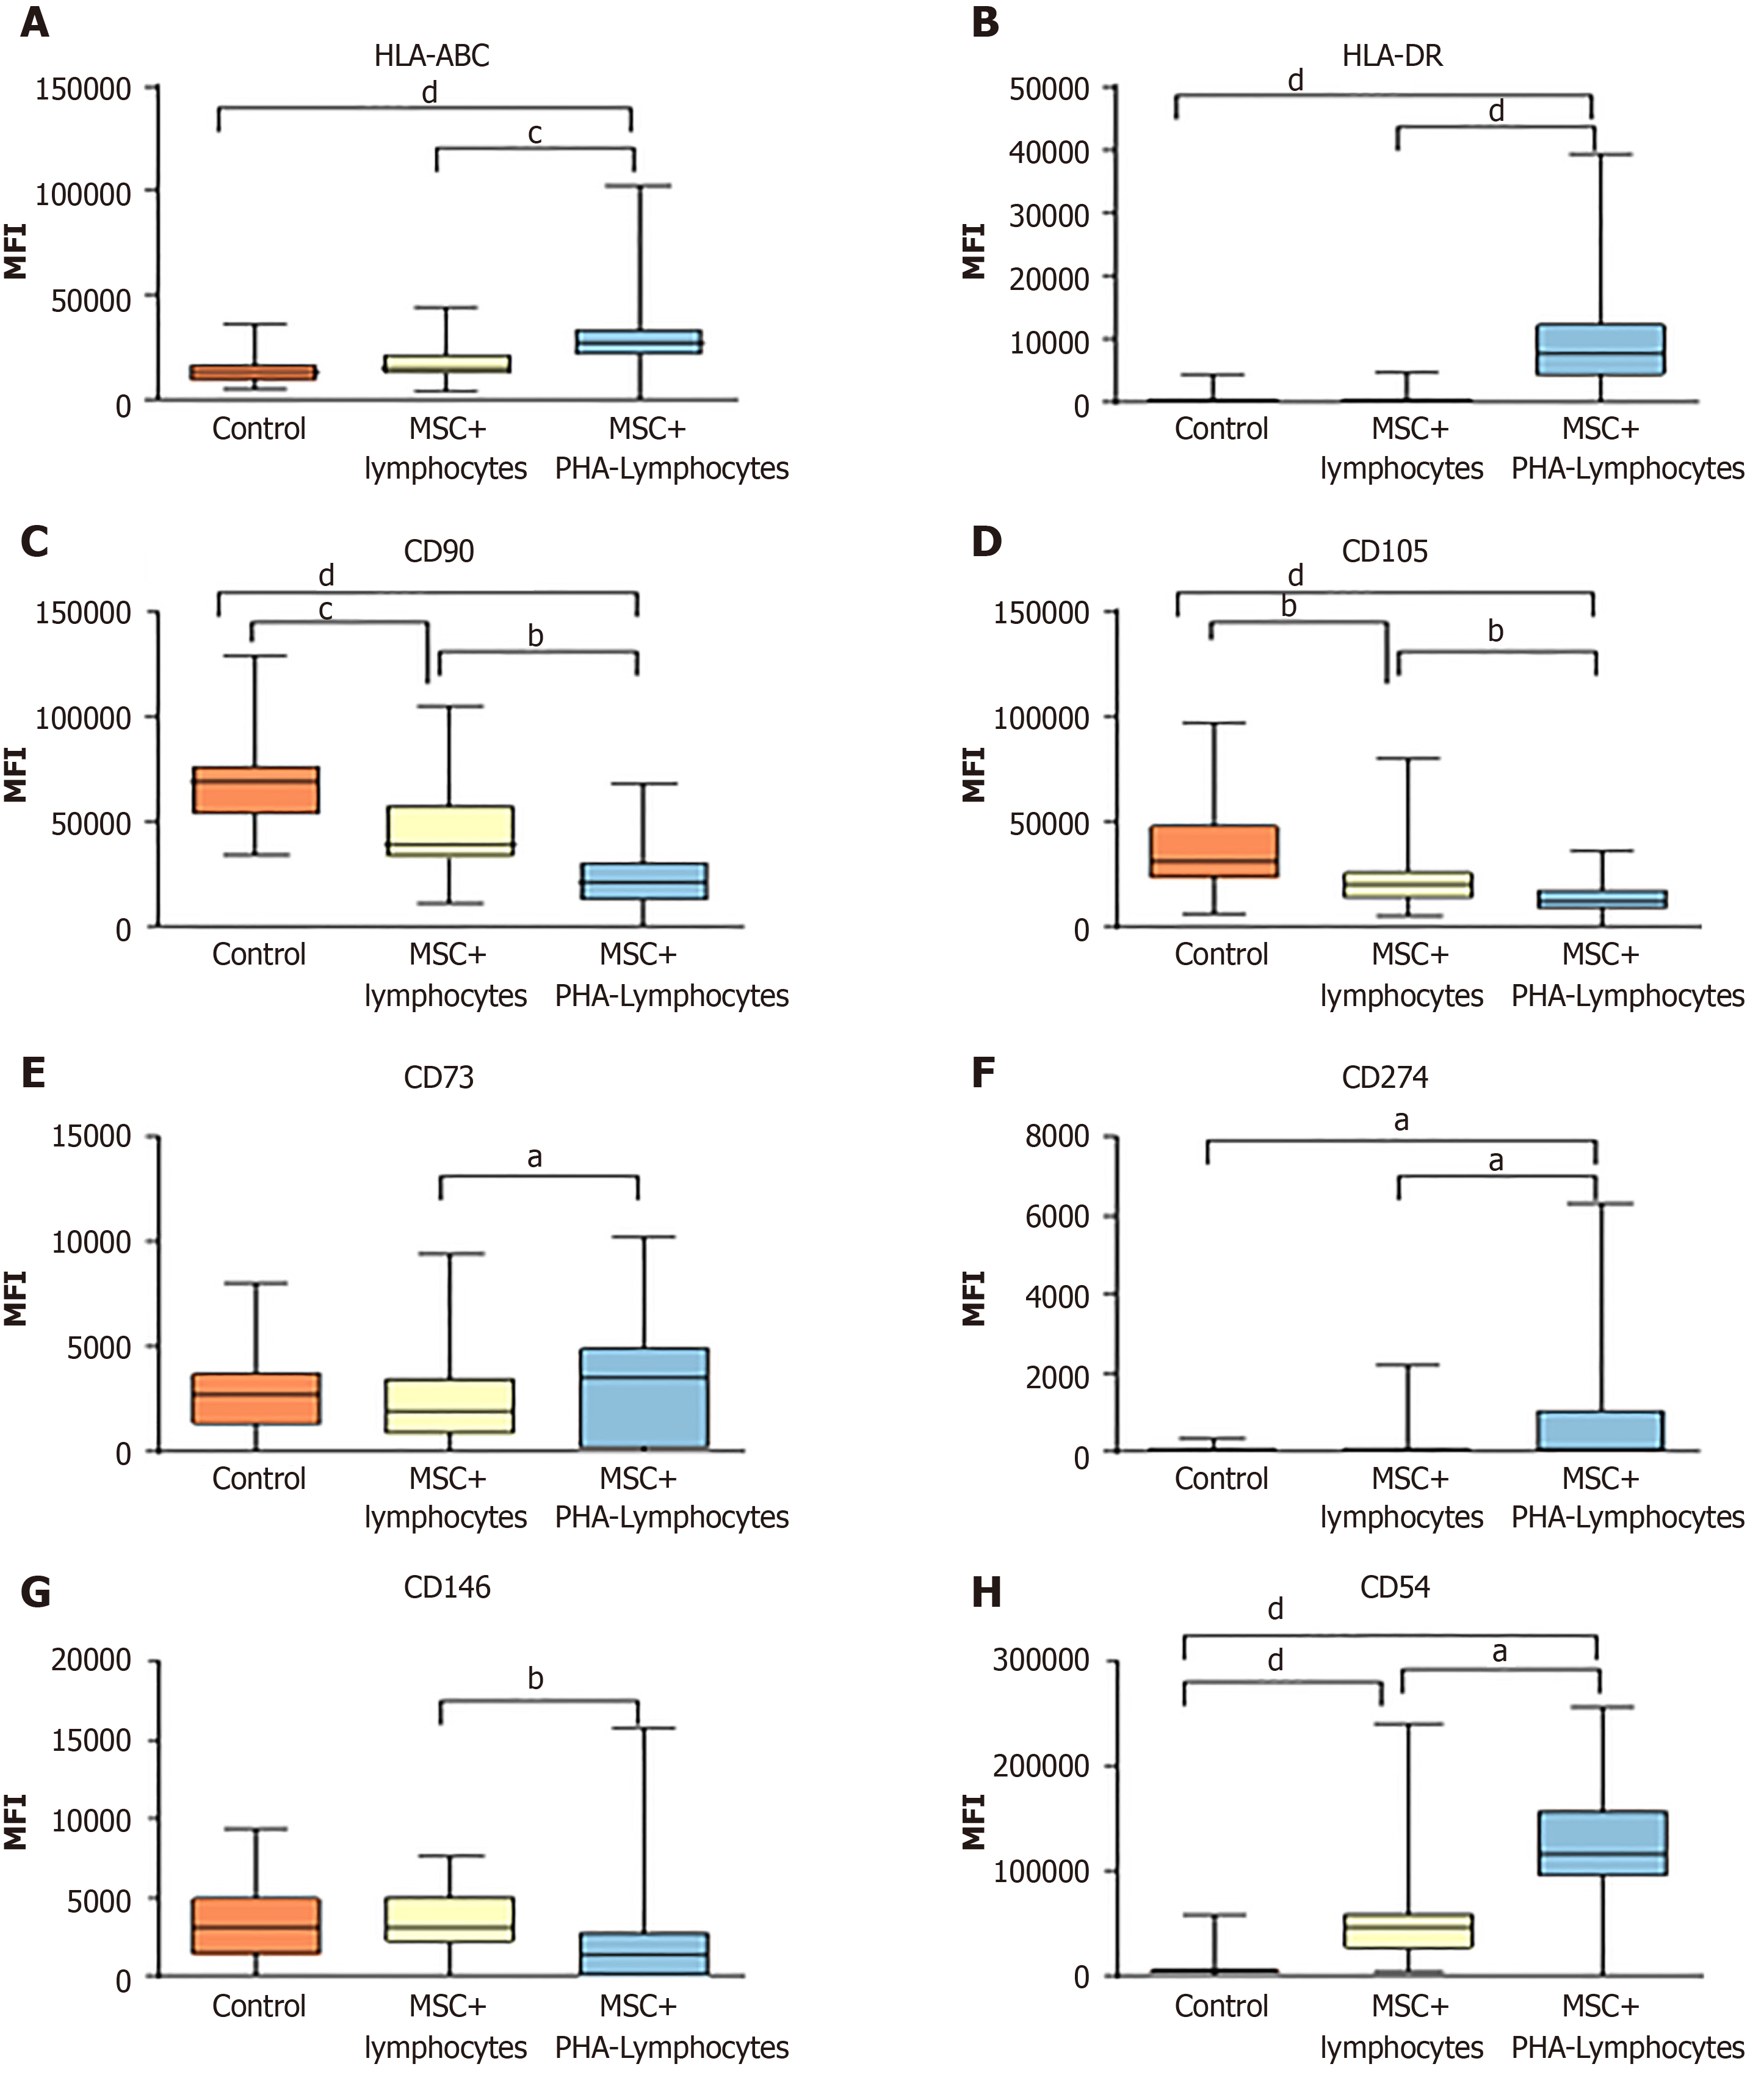
Figure 3 Median fluorescence intensity of multipotent mesenchymal stromal cell markers after cultivation with lymphocytes for 4 d.
A: HLA-ABC; B: HLA-DR; C: CD90; D: CD105; E: CD73; F: CD274; G: CD146; H: CD54. The analysis was performed on 38 mesenchymal stromal cell samples. The significance of differences was assessed by the method of multiple comparisons in GraphPad and is indicated in the figure: aP < 0.05, bP < 0.005, cP < 0.0005, dP < 0.0001. MSCs: Multipotent mesenchymal stromal cells.
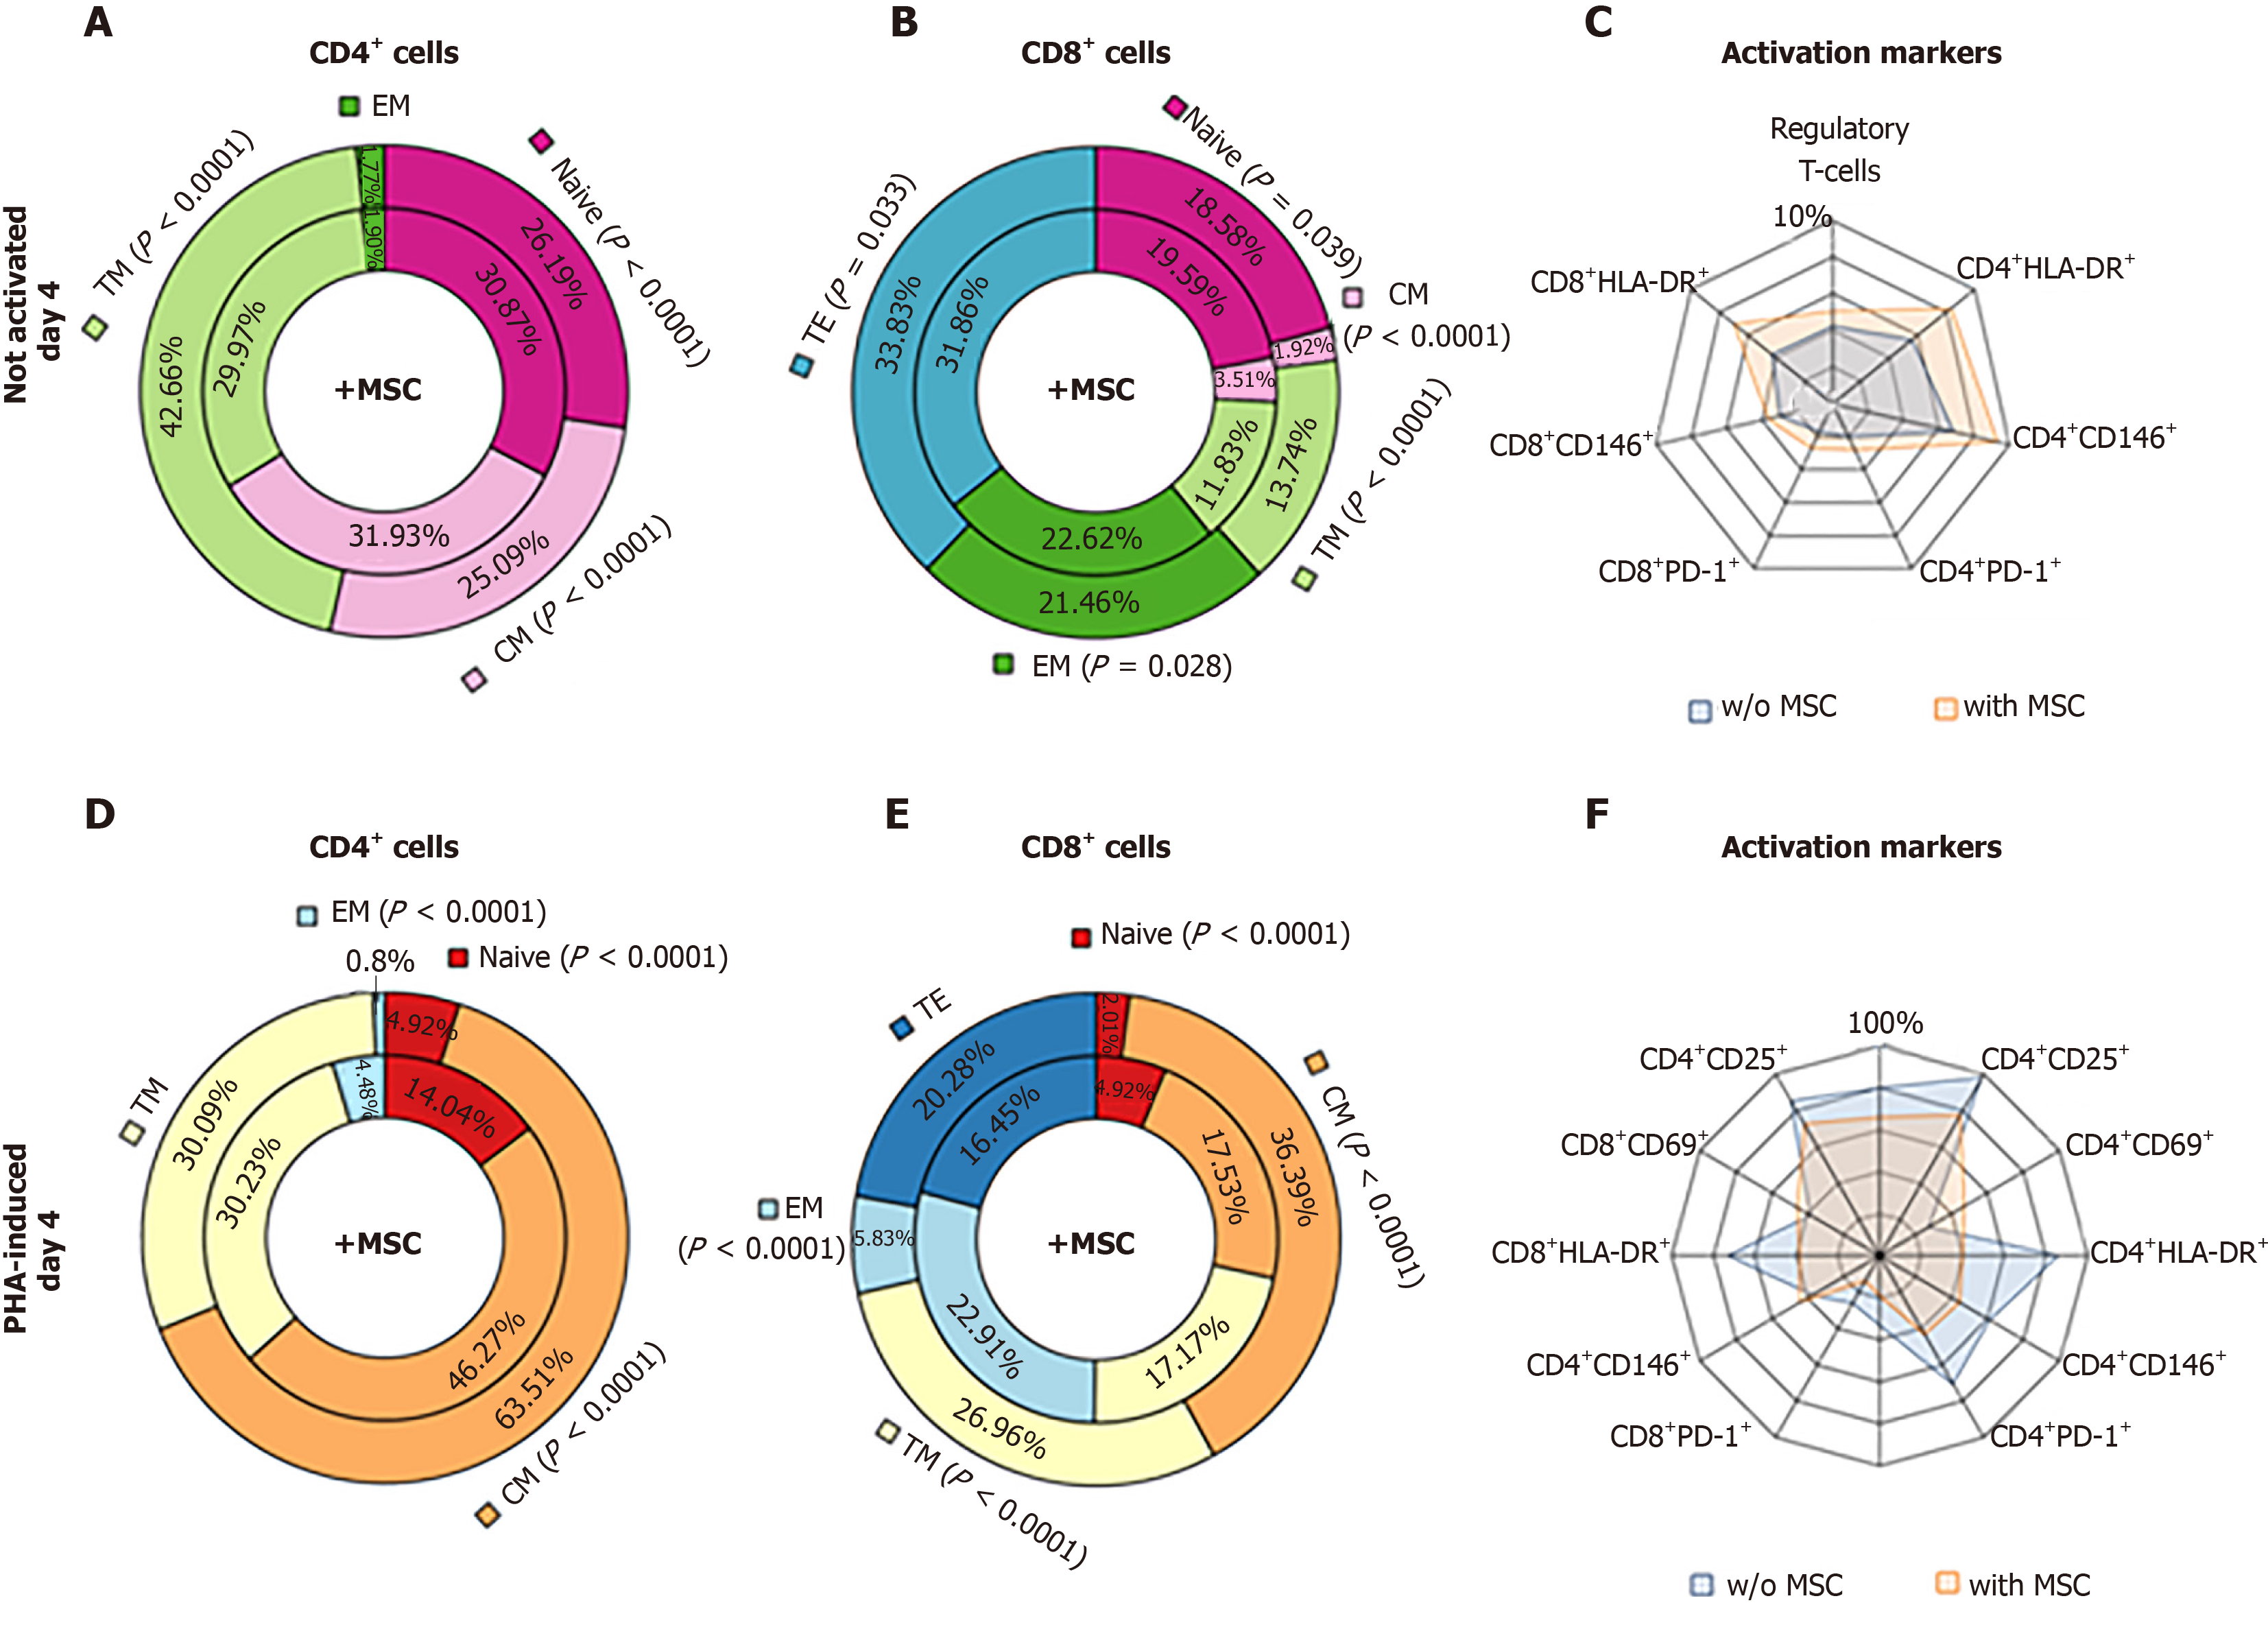
Figure 4 The relative number of the different subpopulations of lymphocytes after 4 d of cultivation with multipotent mesenchymal stromal cells.
A-C: Among the cultures of non-activated lymphocytes; D-F: Among the PHA-activated lymphocytes. The subpopulation fractions in the outer rings (on graphs A, B, D, E) correspond to control lymphocytes, and the internal fractions correspond to lymphocytes co-cultivated with multipotent mesenchymal stromal cells (MSCs). C and F show the relative number of lymphocytes expressing different activation markers (blue areas are lymphocyte cultures, and orange areas are lymphocyte cultures with MSCs). MSCs: Multipotent mesenchymal stromal cells.
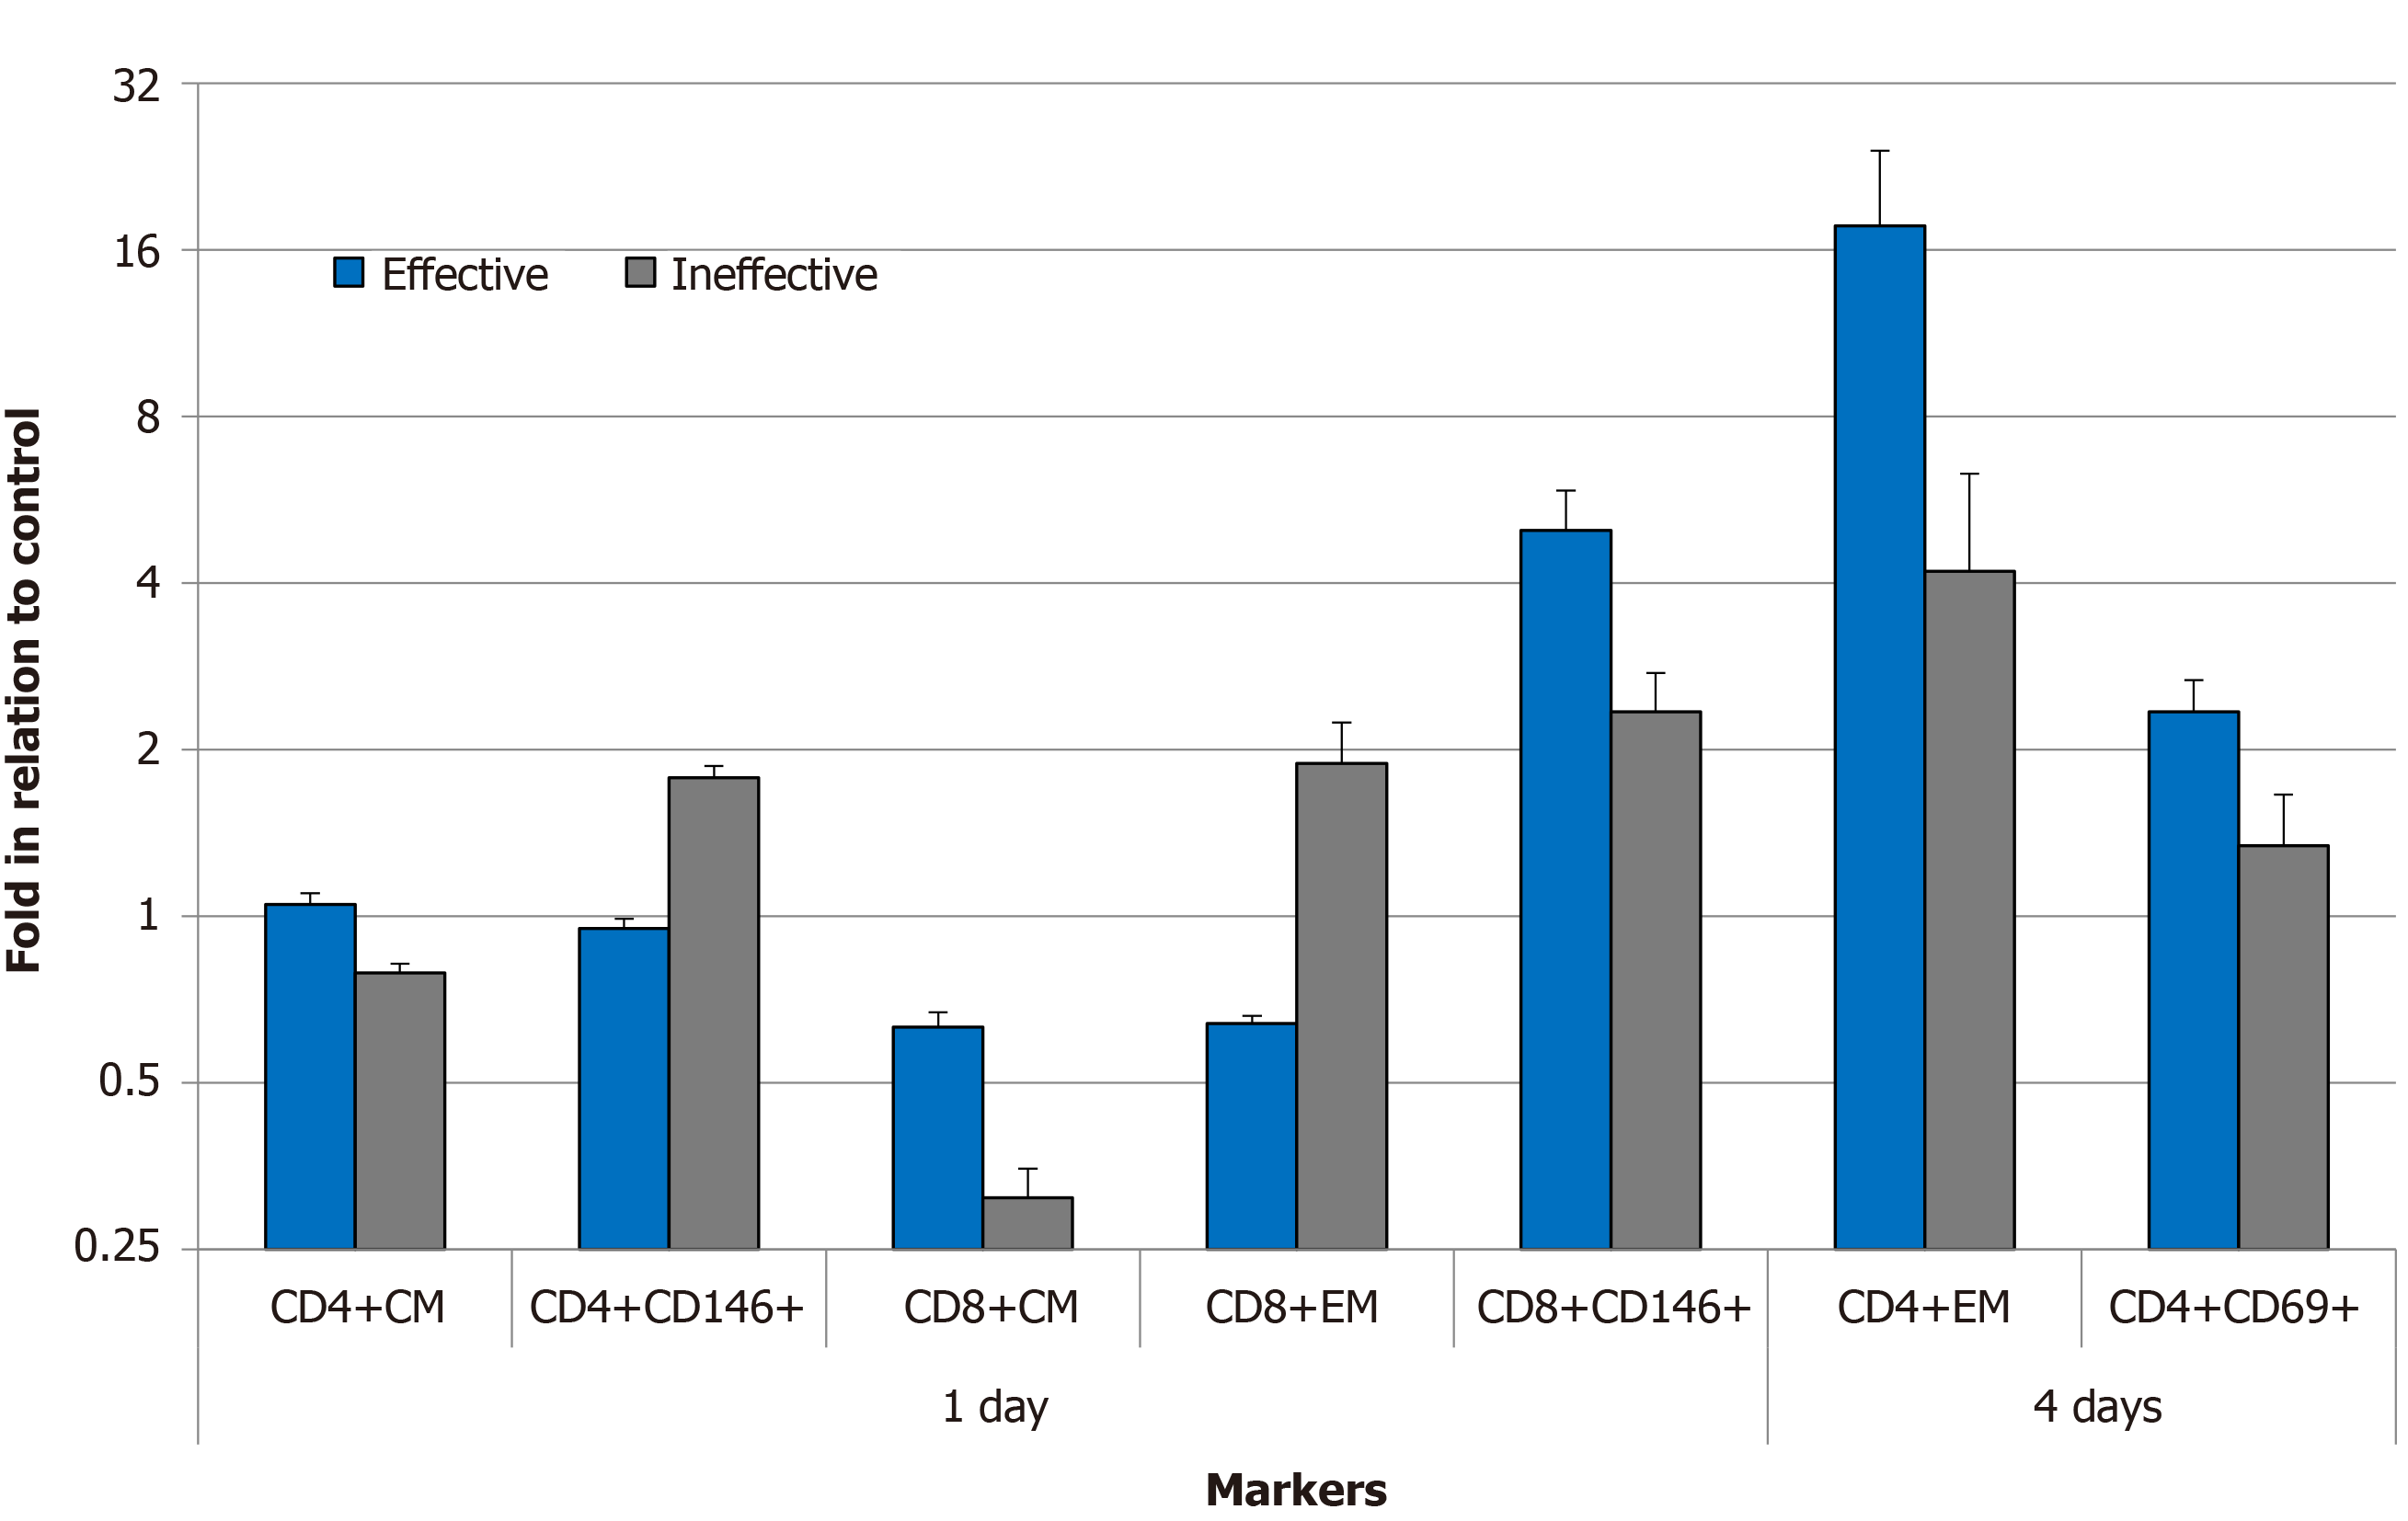
Figure 5 Alterations in the proportion of the lymphocyte subpopulations after co-cultivation with multipotent mesenchymal stromal cells.
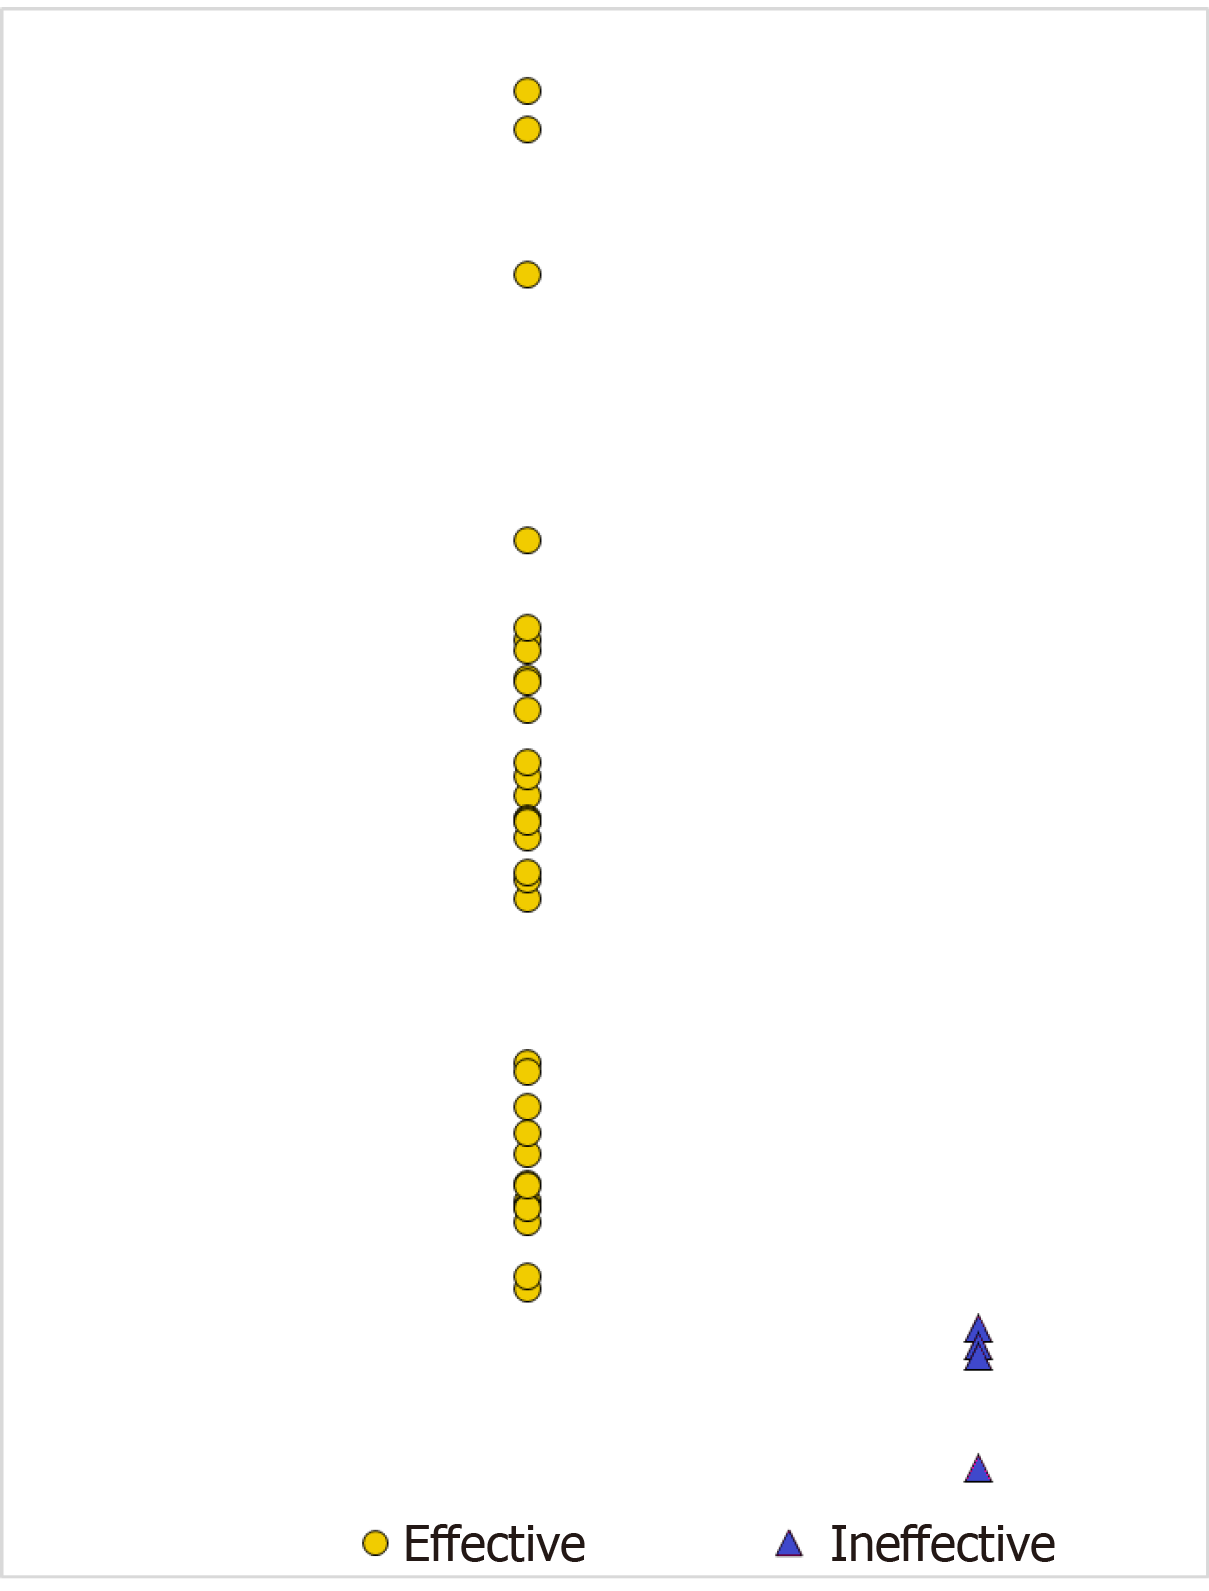
Figure 6 Analysis of the diversity between the effective and ineffective multipotent mesenchymal stromal cell samples.
All the data on the individual mesenchymal stromal cell samples were reduced to a single value representing the ratio of the distances from the sample to the average values in the groups of samples that were effective and ineffective in the prevention of graft vs host disease. The distance is calculated based on the significance of the differences. The significance of the differences is the ratio of the differences of the corresponding parameters to their fluctuations. The appendix provides a detailed explanation of all the calculations.
- Citation: Petinati N, Kapranov N, Davydova Y, Bigildeev A, Pshenichnikova O, Karpenko D, Drize N, Kuzmina L, Parovichnikova E, Savchenko V. Immunophenotypic characteristics of multipotent mesenchymal stromal cells that affect the efficacy of their use in the prevention of acute graft vs host disease. World J Stem Cells 2020; 12(11): 1377-1395
- URL: https://www.wjgnet.com/1948-0210/full/v12/i11/1377.htm
- DOI: https://dx.doi.org/10.4252/wjsc.v12.i11.1377


