Copyright
©The Author(s) 2020.
World J Stem Cells. Nov 26, 2020; 12(11): 1366-1376
Published online Nov 26, 2020. doi: 10.4252/wjsc.v12.i11.1366
Published online Nov 26, 2020. doi: 10.4252/wjsc.v12.i11.1366
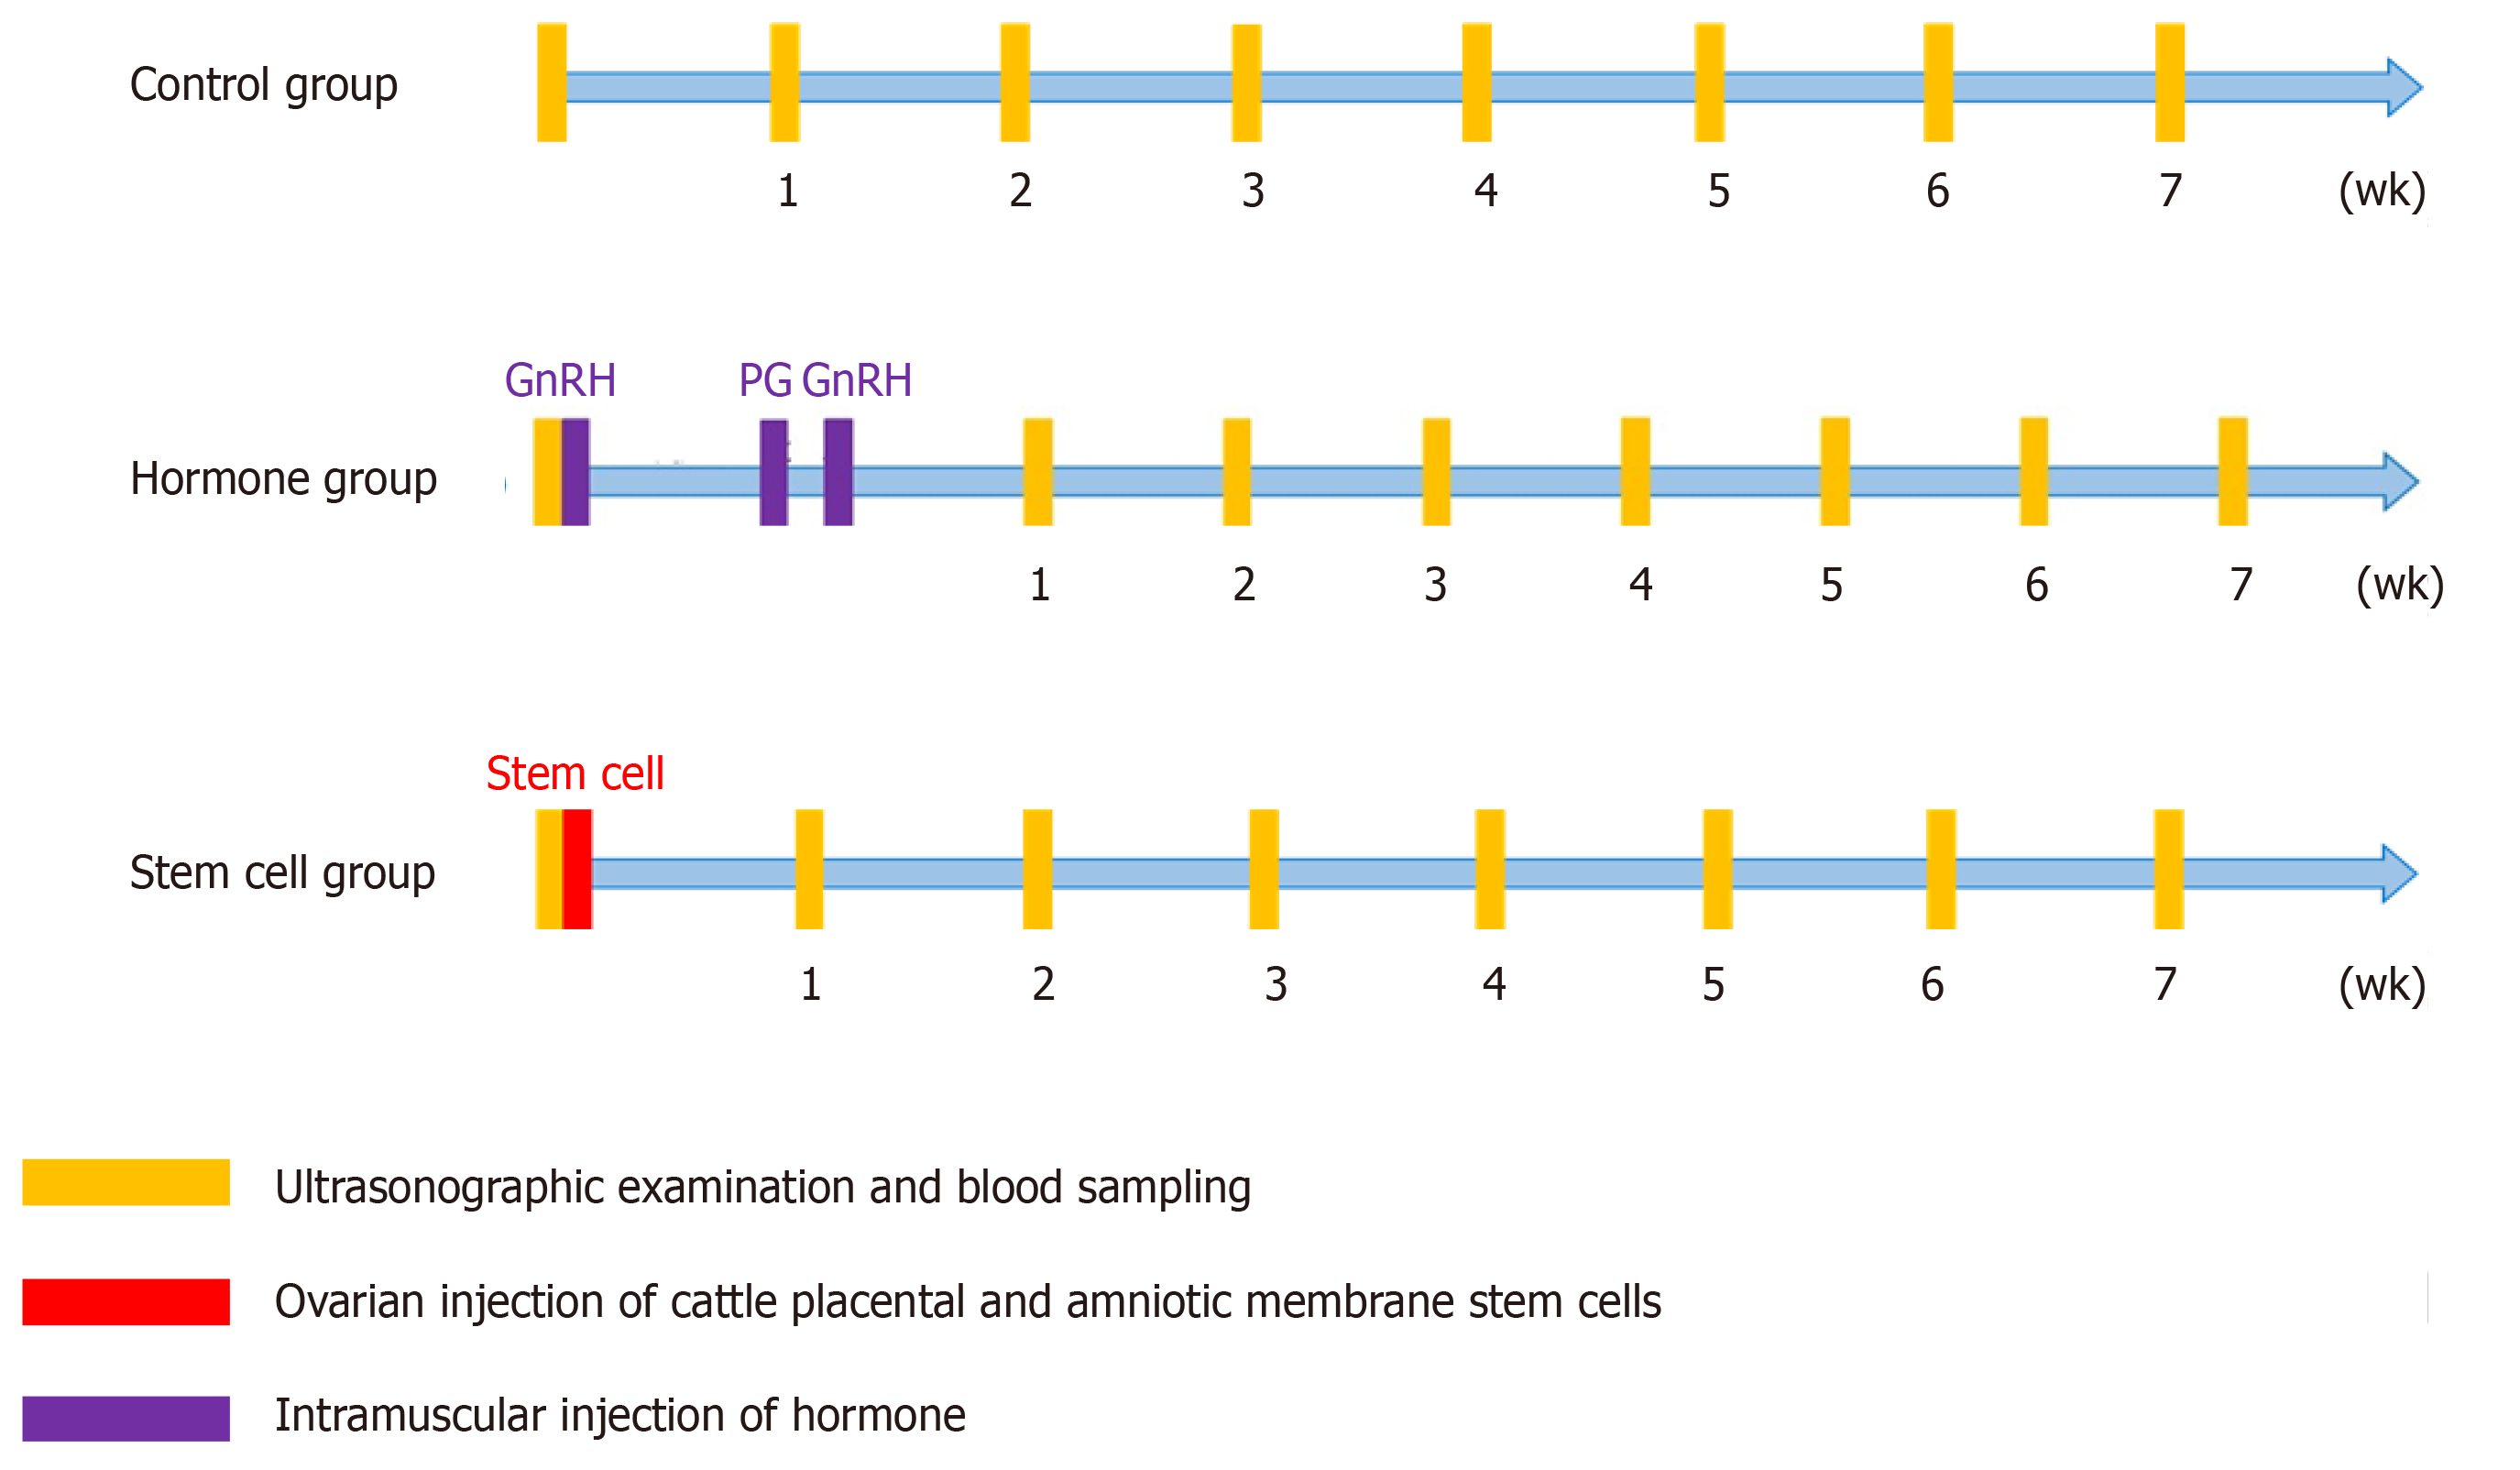
Figure 1 Design of the experiment.
The serum of all cows with ovarian follicular cyst was collected to monitor the concentration of hormone every week for a total of seven times. In the hormone treatment group, the injection of prostaglandin (PG) was implemented 7 d after primary injection of gonadotropin-releasing hormone (GnRH). At 2 d after the injection of PG, secondary injection of GnRH was implemented.
Figure 2 Isolation of cattle placental stem cells from placenta.
A: The placenta collected from Holstein cow; B: The stem cell derived from bovine placenta after 7 d of culture. The uneven distribution of cattle placental stem cells led to different growth rates in each part of the dish.
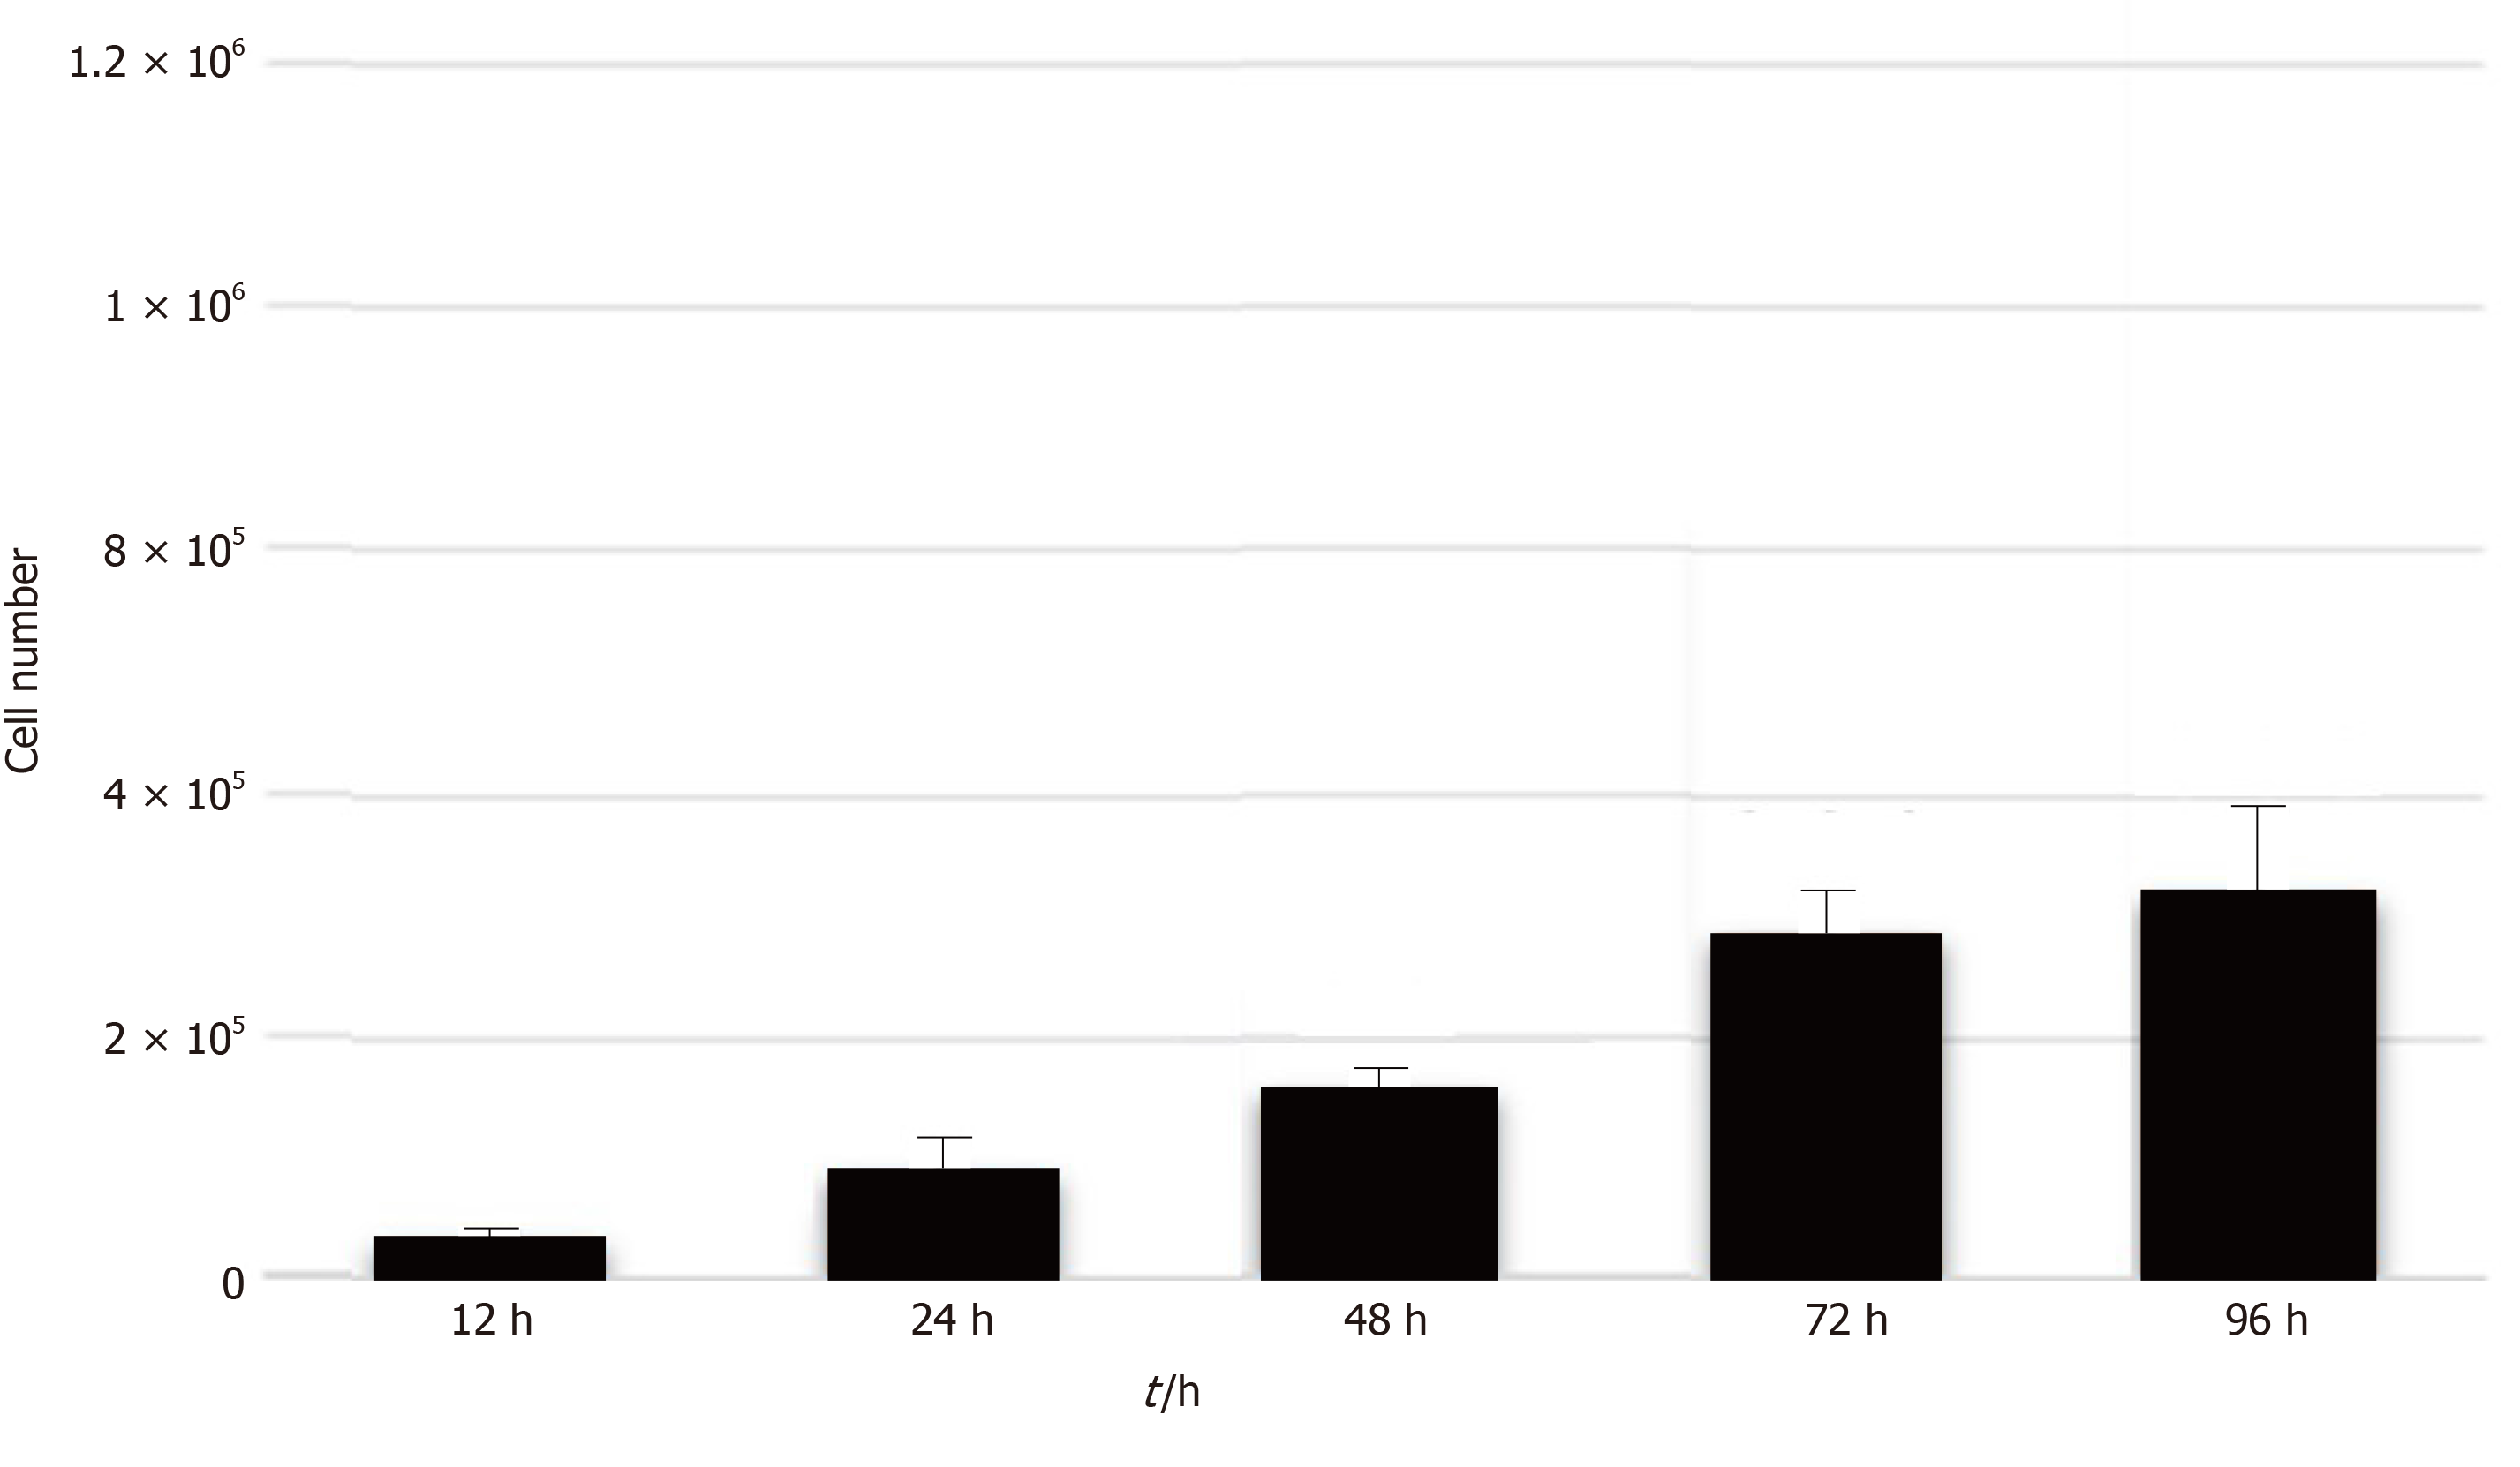
Figure 3 The proliferation of cattle placental stem cells.
The number of cattle placental stem cells increased significantly from 12 h to 72 h. aP < 0.05; bP < 0.01; cP < 0.005.
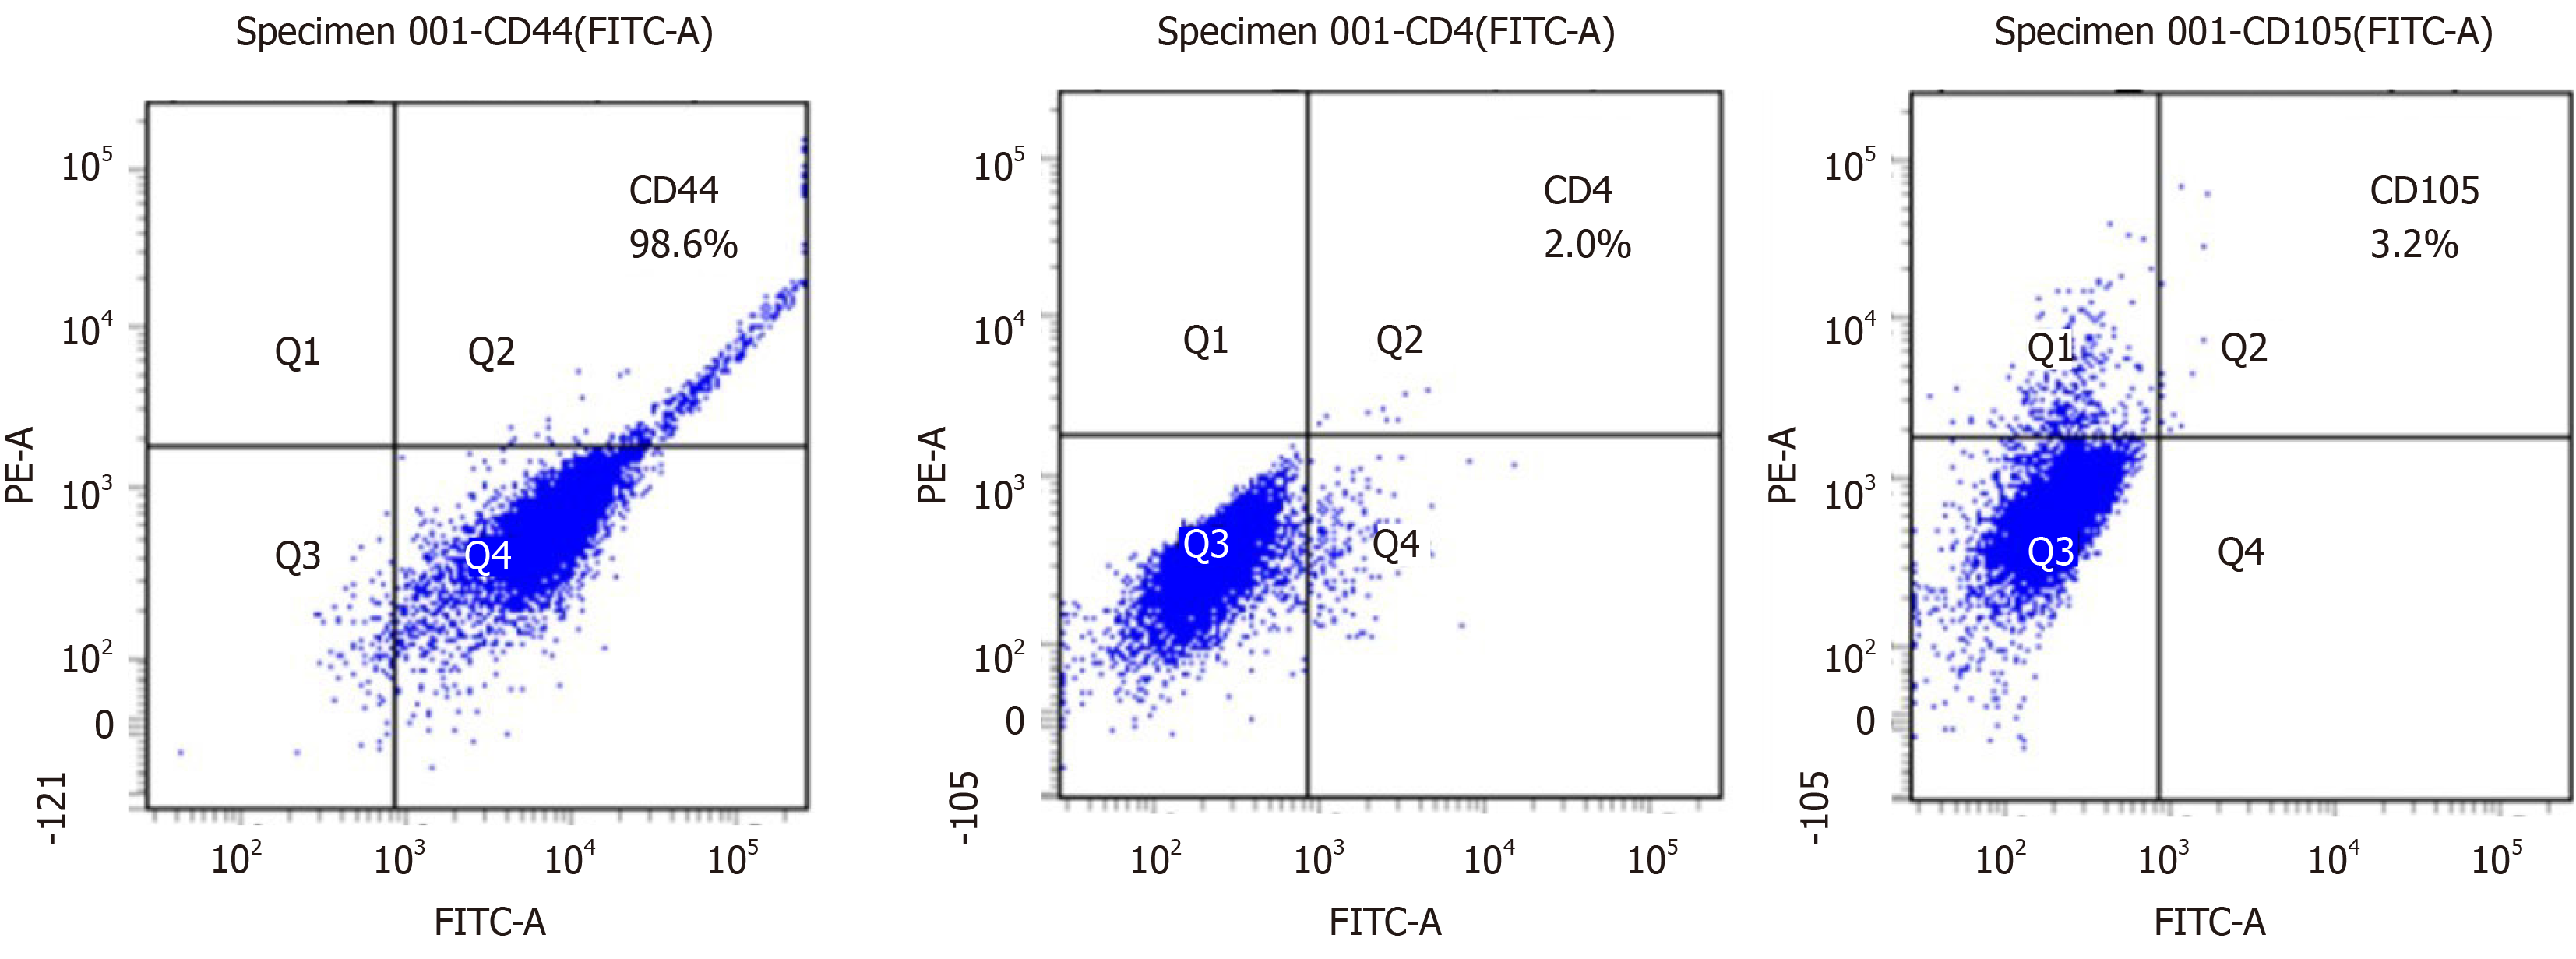
Figure 4 Flow cytometry analysis of surface marker of cattle placental stem cells.
A: Cattle placental stem cells (CPSCs) expressed 98.6% CD44, which is a mesenchymal stem cell marker; B: CPSCs expressed 2.0% CD4, which is a T lymphocyte marker; C: CPSCs expressed 3.2% CD105, which is an angiogenesis-related marker.
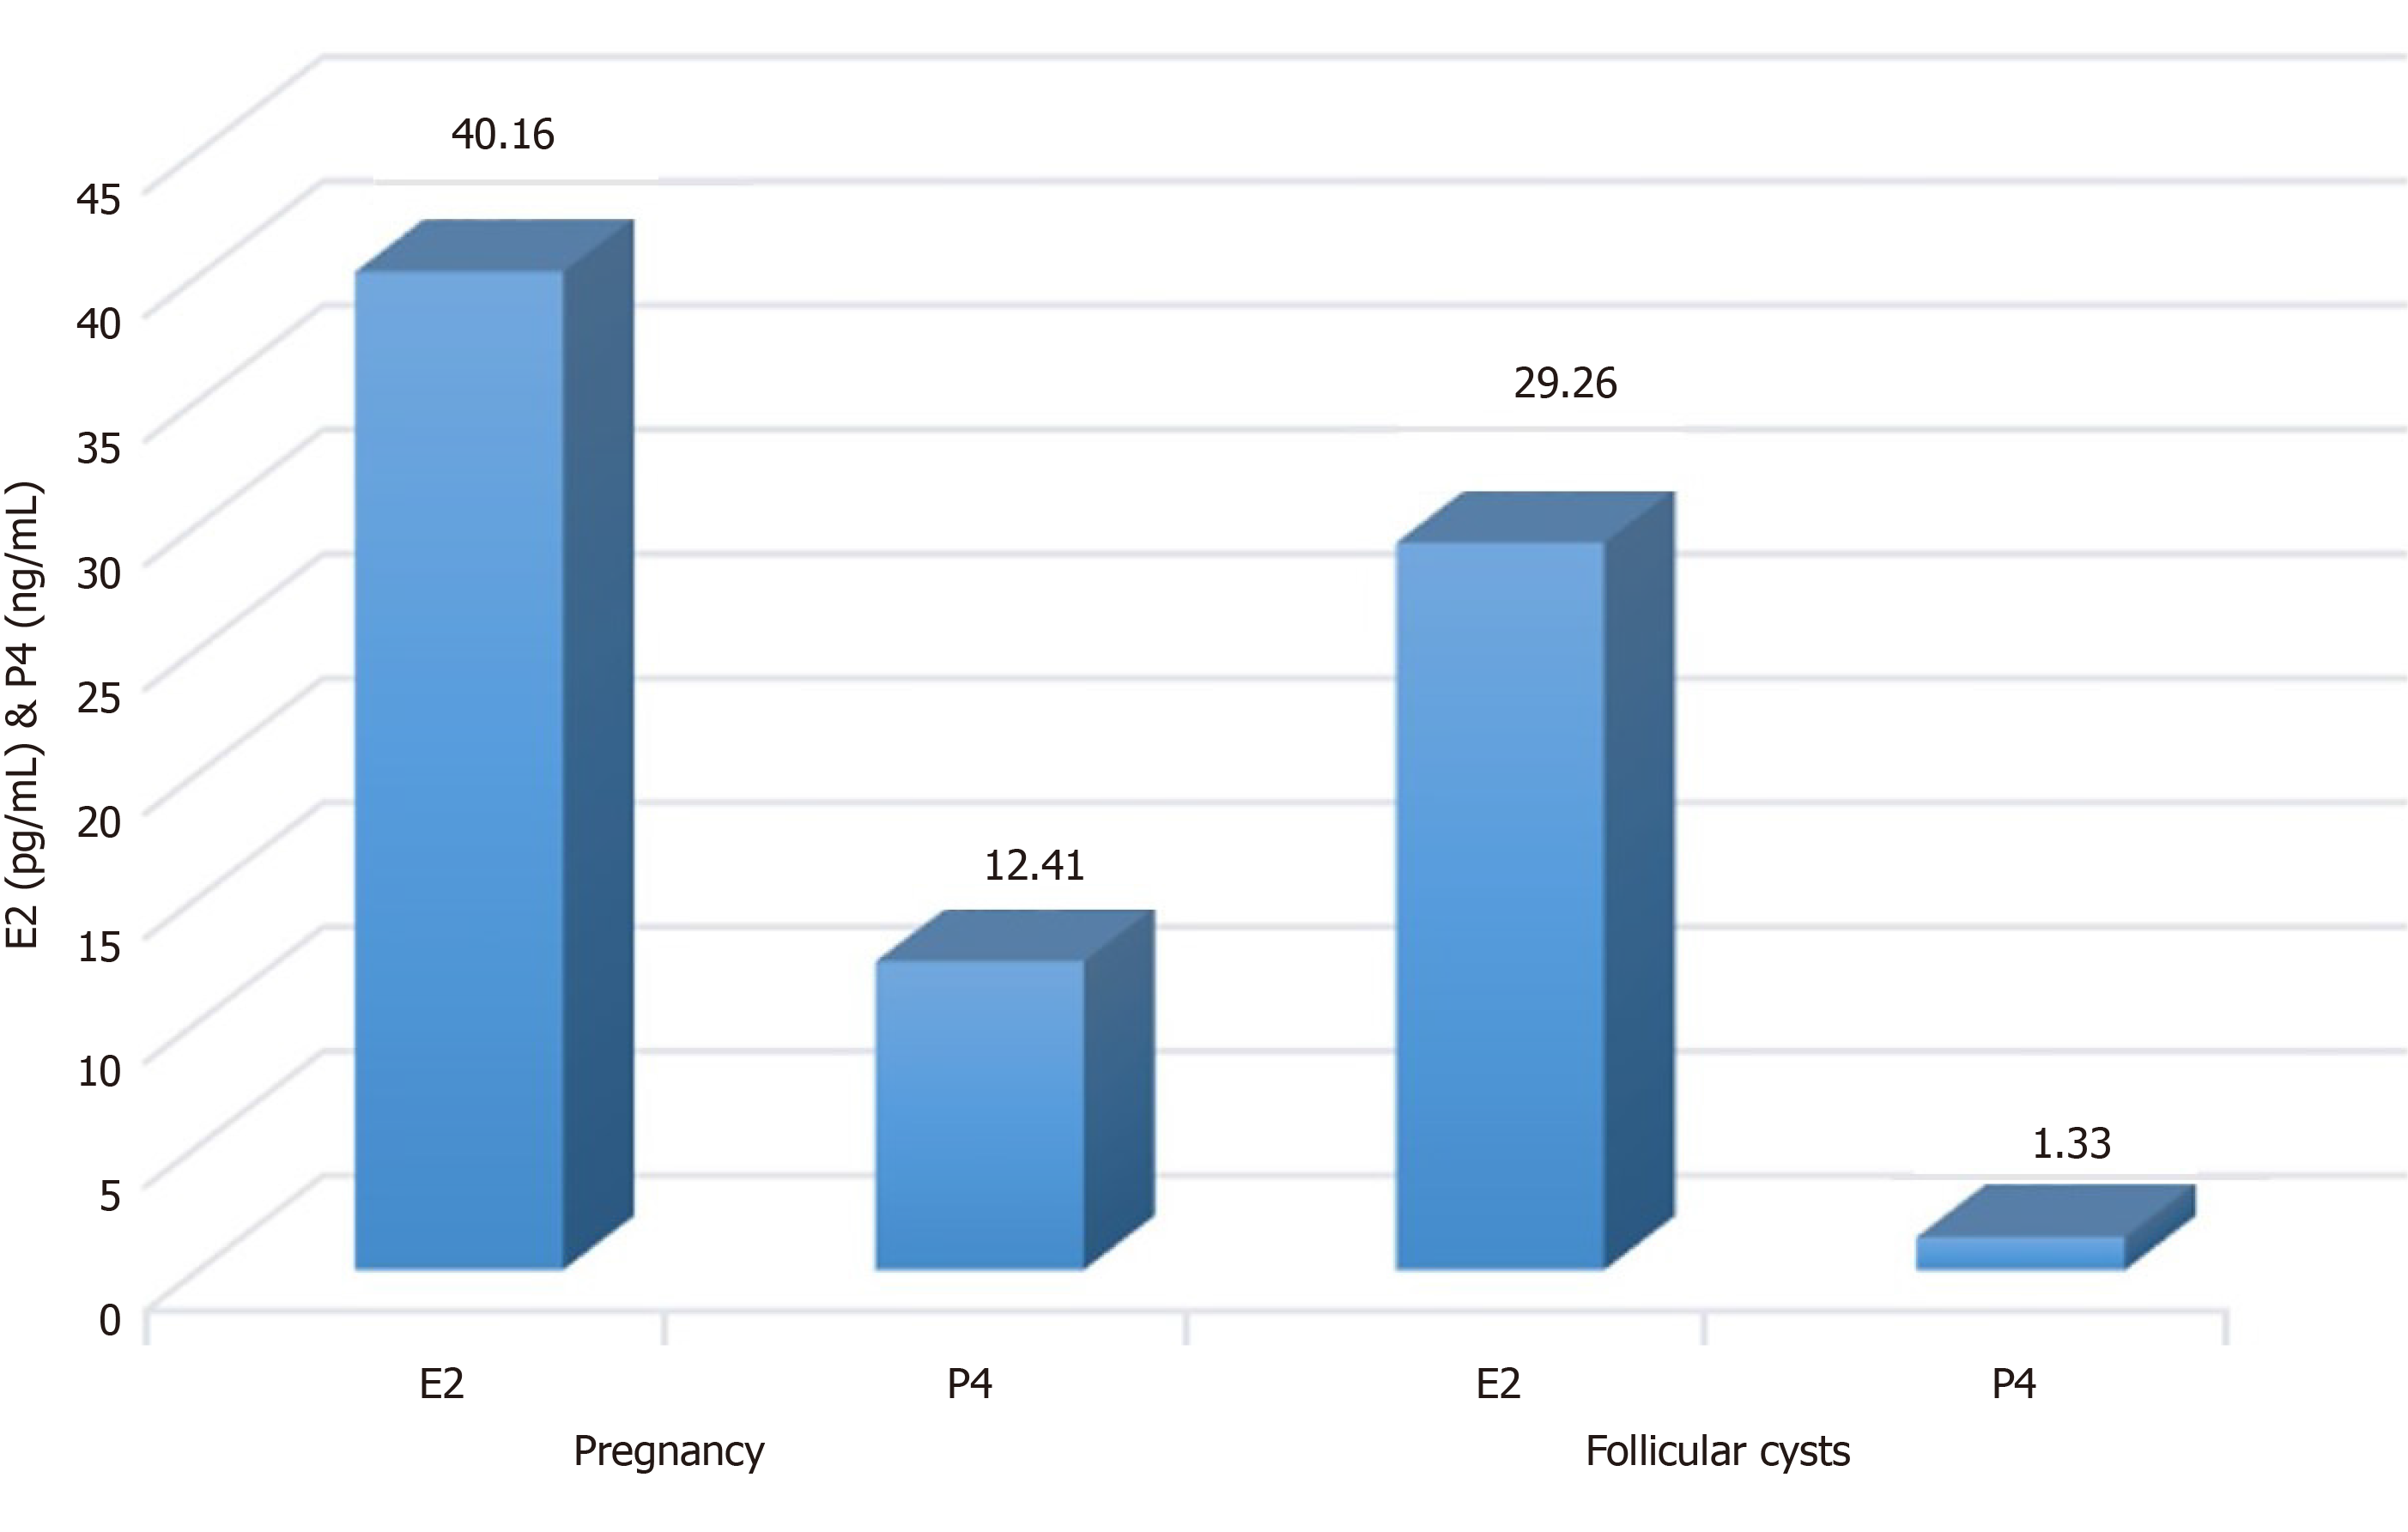
Figure 5 Concentration of sexual hormone in cows with pregnancy and ovarian follicular cysts.
High concentration of estradiol (E2) and low concentration of progesterone (P4) indicated the presence of ovarian follicular cyst.
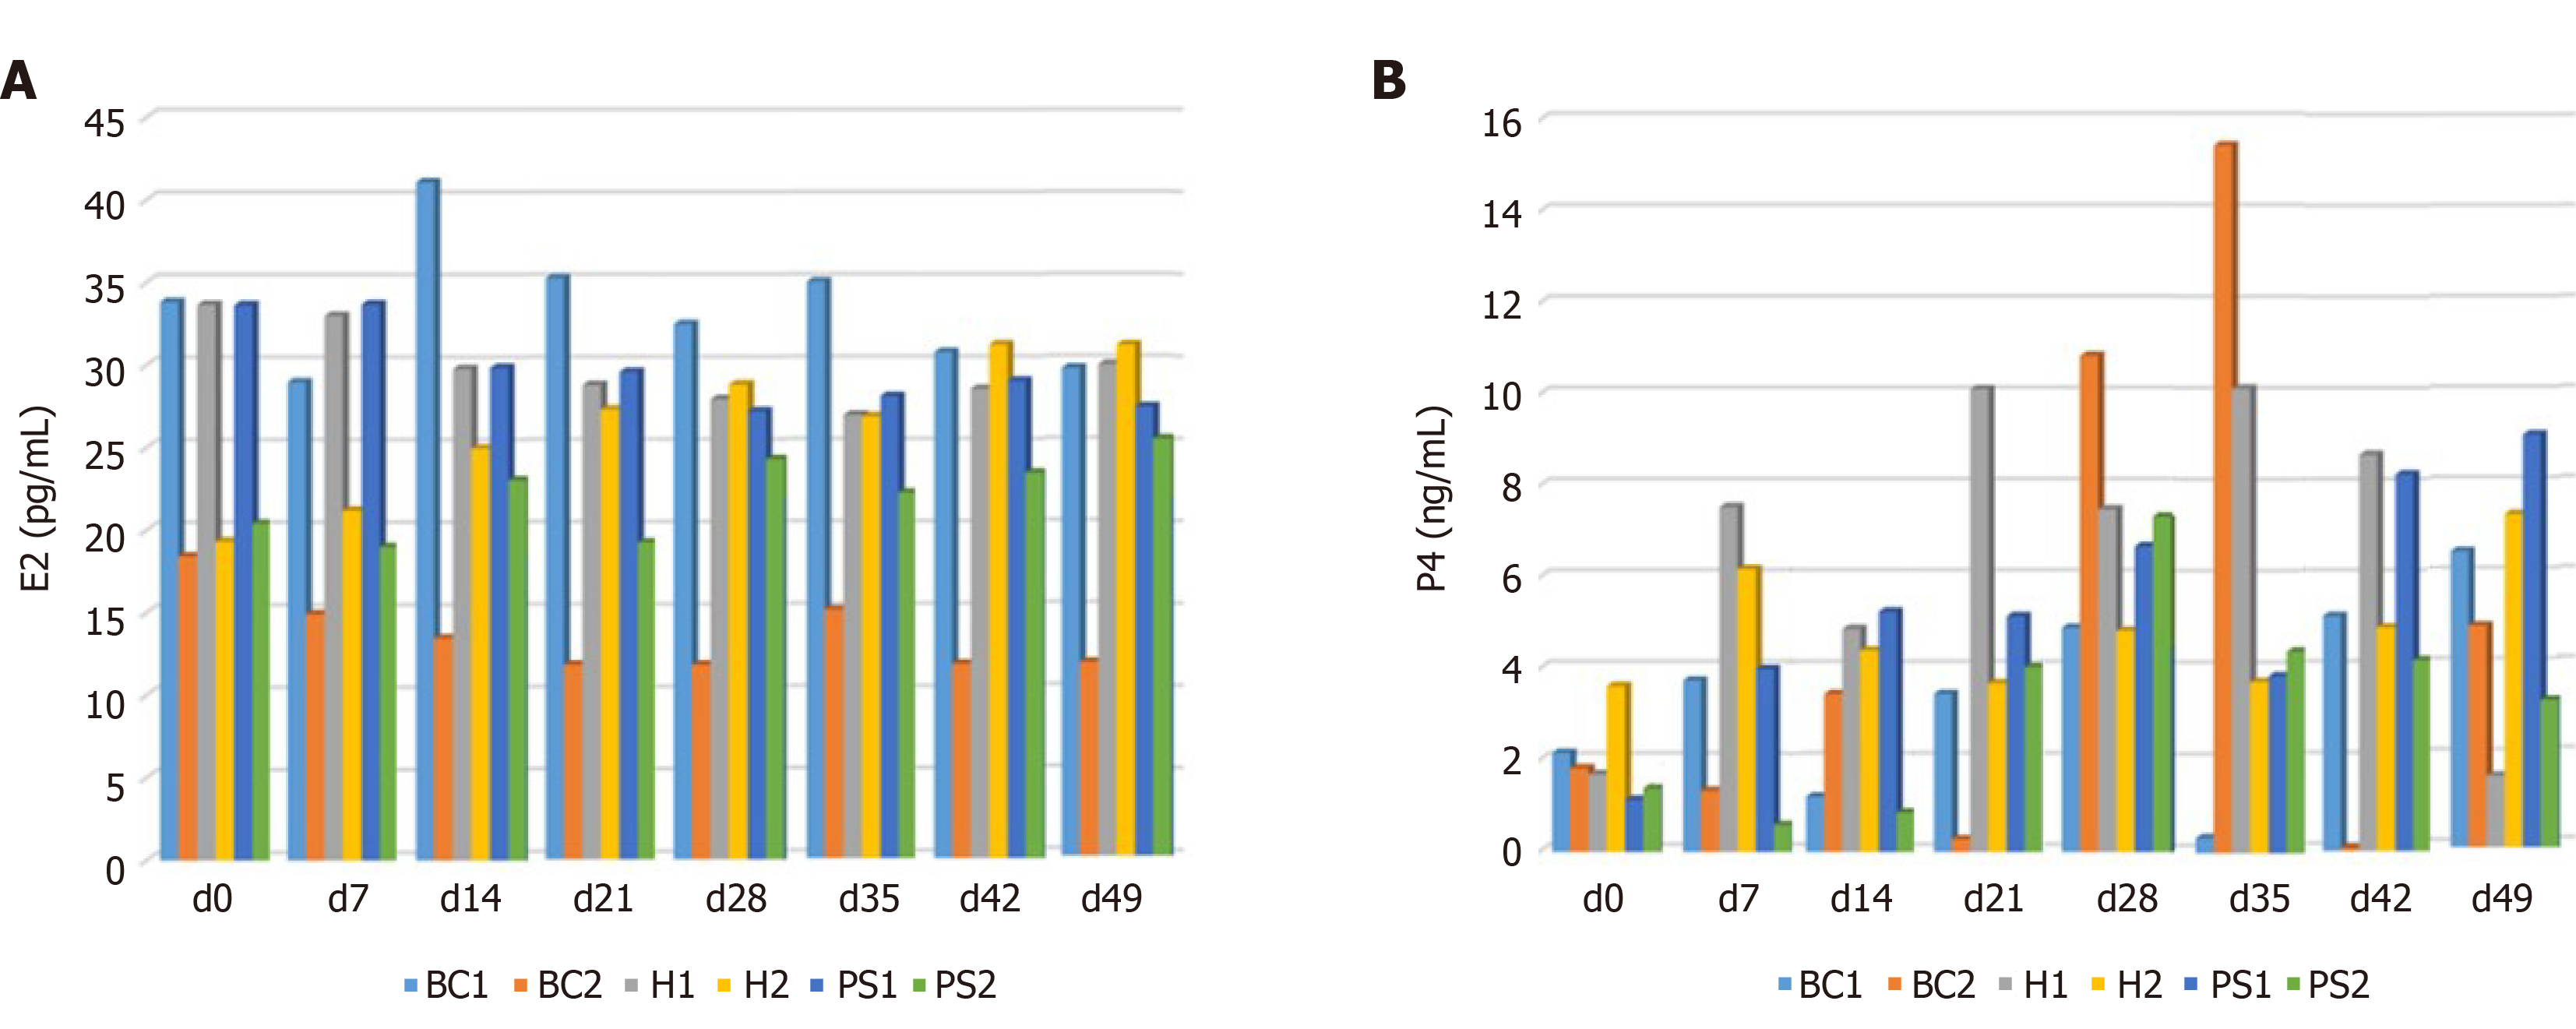
Figure 6 Comparison of estradiol and progesterone concentrations in each group.
A: All hormone and cattle placental stem cell (CPSC) treatment groups had no significant difference that might originate from individual variations; B: Concentration of progesterone (P4) increased in the hormone and CPSC treatment groups, but the elevation was unstable due to individual variations. BC1: Control group; BC2: Placebo group with follicular fluid drainage and saline injection; H1: Gonadotrophin-releasing hormone (GnRH) (250 μg)-prostaglandin (PG) (500 μg)-GnRH (250 μg) hormone treatment group without drainage of follicular fluid; H2: Hormone treatment group with drainage of follicular fluid; PS1: CPSC treatment group with follicular fluid drainage and ovarian injection of 1 × 10⁶ CPSCs; PS2: CPSC treatment group with follicular fluid drainage and ovarian injection of 1× 10⁶ CPSCs; E2: Estradiol.
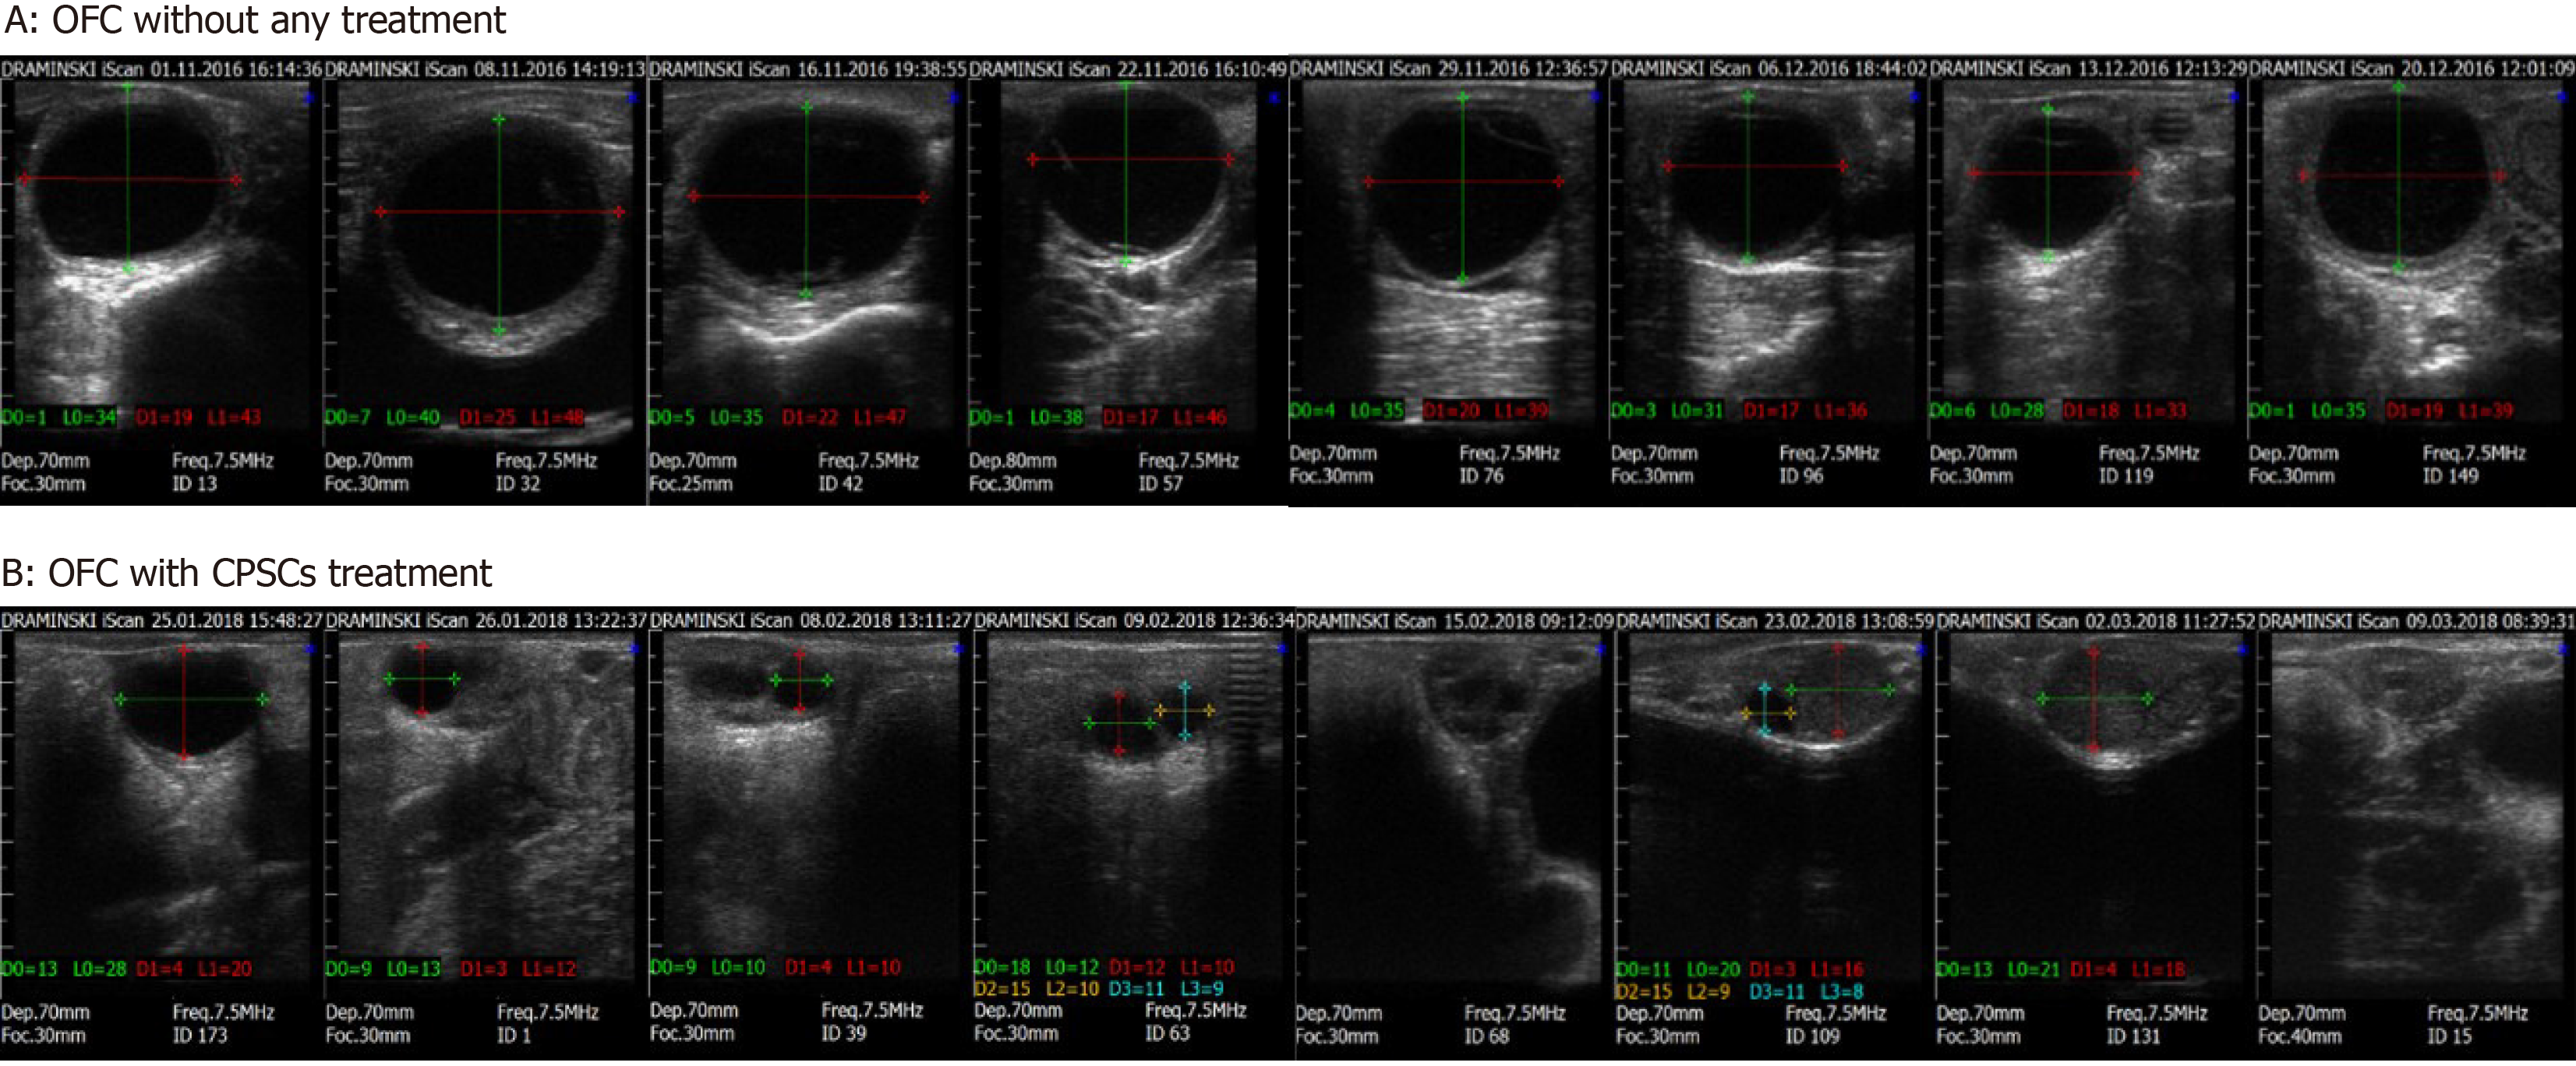
Figure 7 Ultrasonographic images of ovarian follicular cyst with and without cattle placental stem cell treatment.
The series of scanning graphs were taken from weeks 1 to 7; Green and yellow lines represent transverse diameters; Red and blue lines represent longitudinal diameters. A: Ovarian follicular cyst (OFC) persisted during week 7; B: The OFC subsided progressively 7 d after injection. Cattle placental stem cell (CPSC) treatment showed the therapeutic potential.
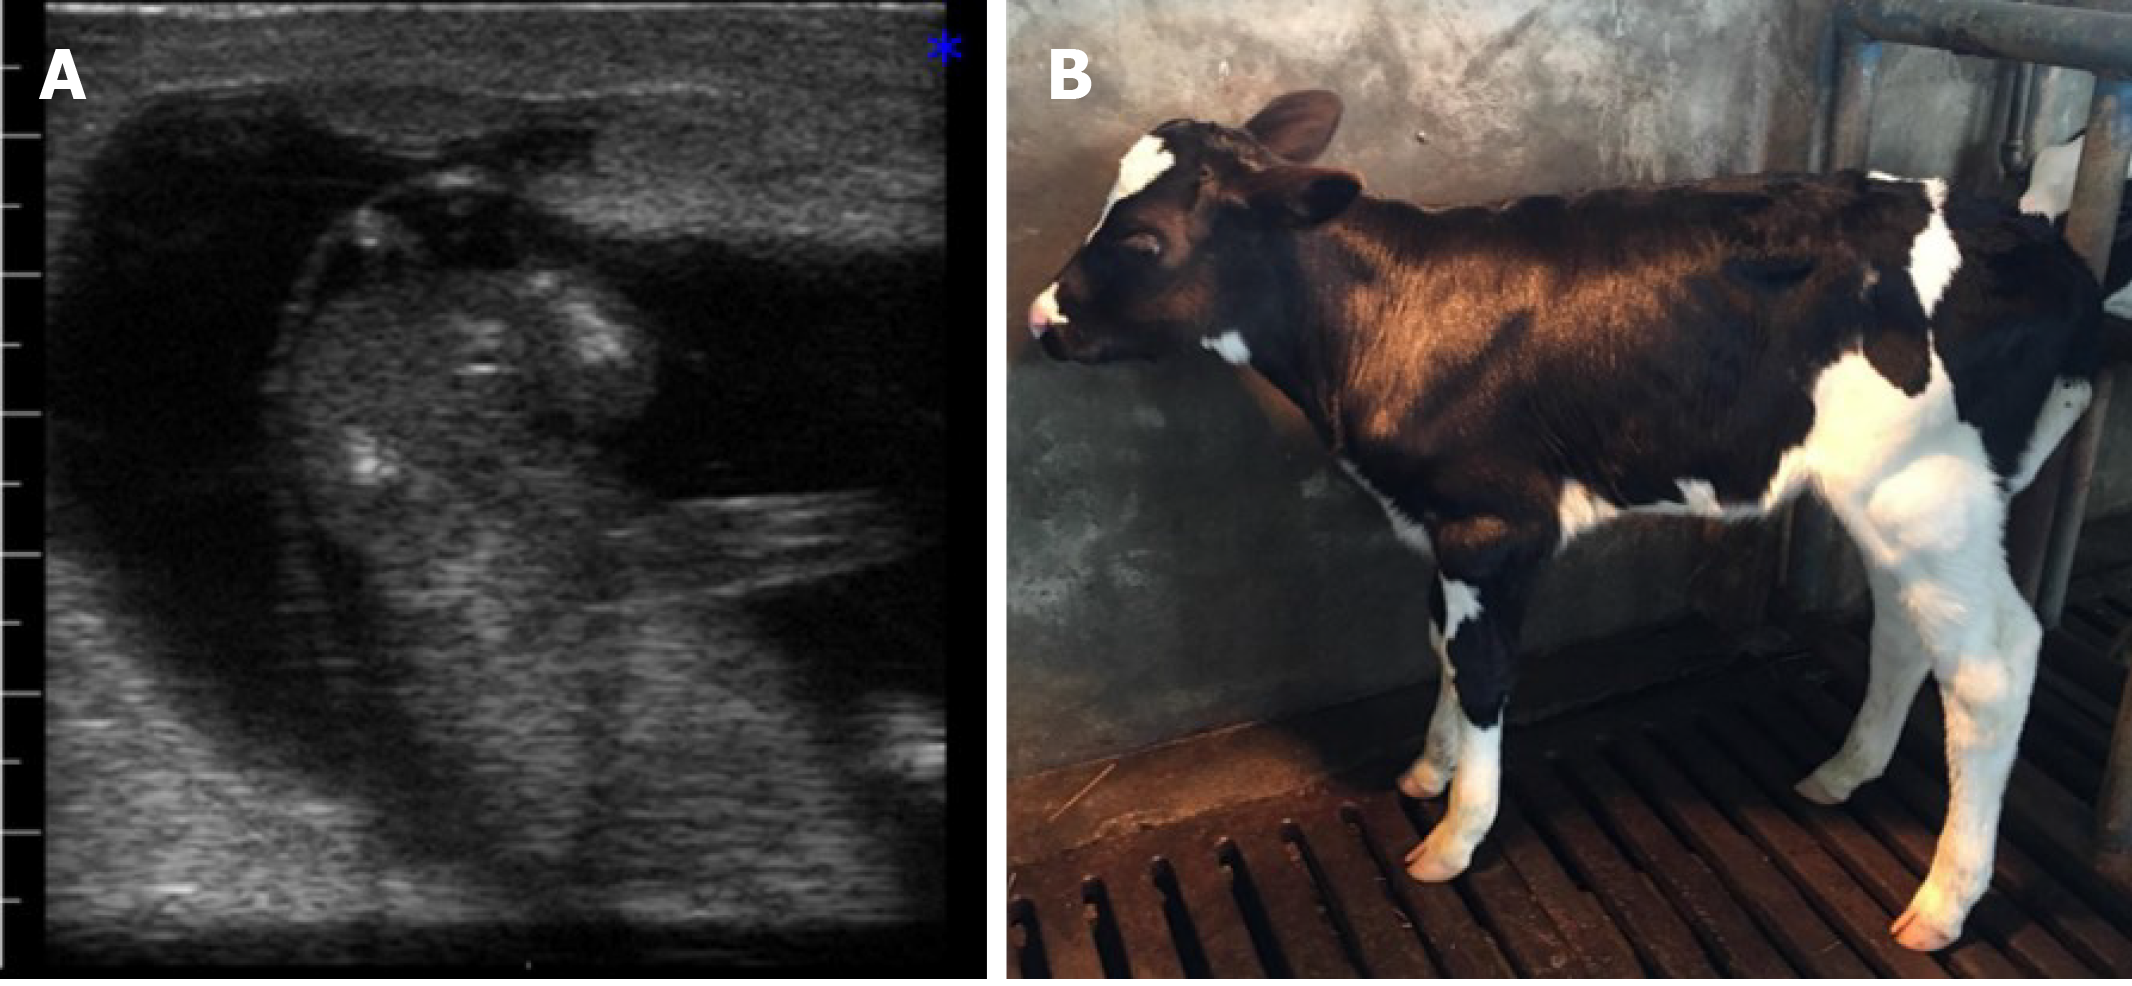
Figure 8 The heifer labored by the cow with ovarian follicular cyst after injection of one million cattle placental stem cells.
A: Ultrasound scan of the fetus; B: The healthy heifer grew up with normal function.
- Citation: Peng SY, Wu TH, Lin TY, Hii LY, Chan KS, Fu TY, Chang SC, Shen PC, Liu KY, Shaw SW.. Application of cattle placental stem cells for treating ovarian follicular cyst. World J Stem Cells 2020; 12(11): 1366-1376
- URL: https://www.wjgnet.com/1948-0210/full/v12/i11/1366.htm
- DOI: https://dx.doi.org/10.4252/wjsc.v12.i11.1366


