Copyright
©The Author(s) 2020.
World J Stem Cells. Oct 26, 2020; 12(10): 1152-1170
Published online Oct 26, 2020. doi: 10.4252/wjsc.v12.i10.1152
Published online Oct 26, 2020. doi: 10.4252/wjsc.v12.i10.1152
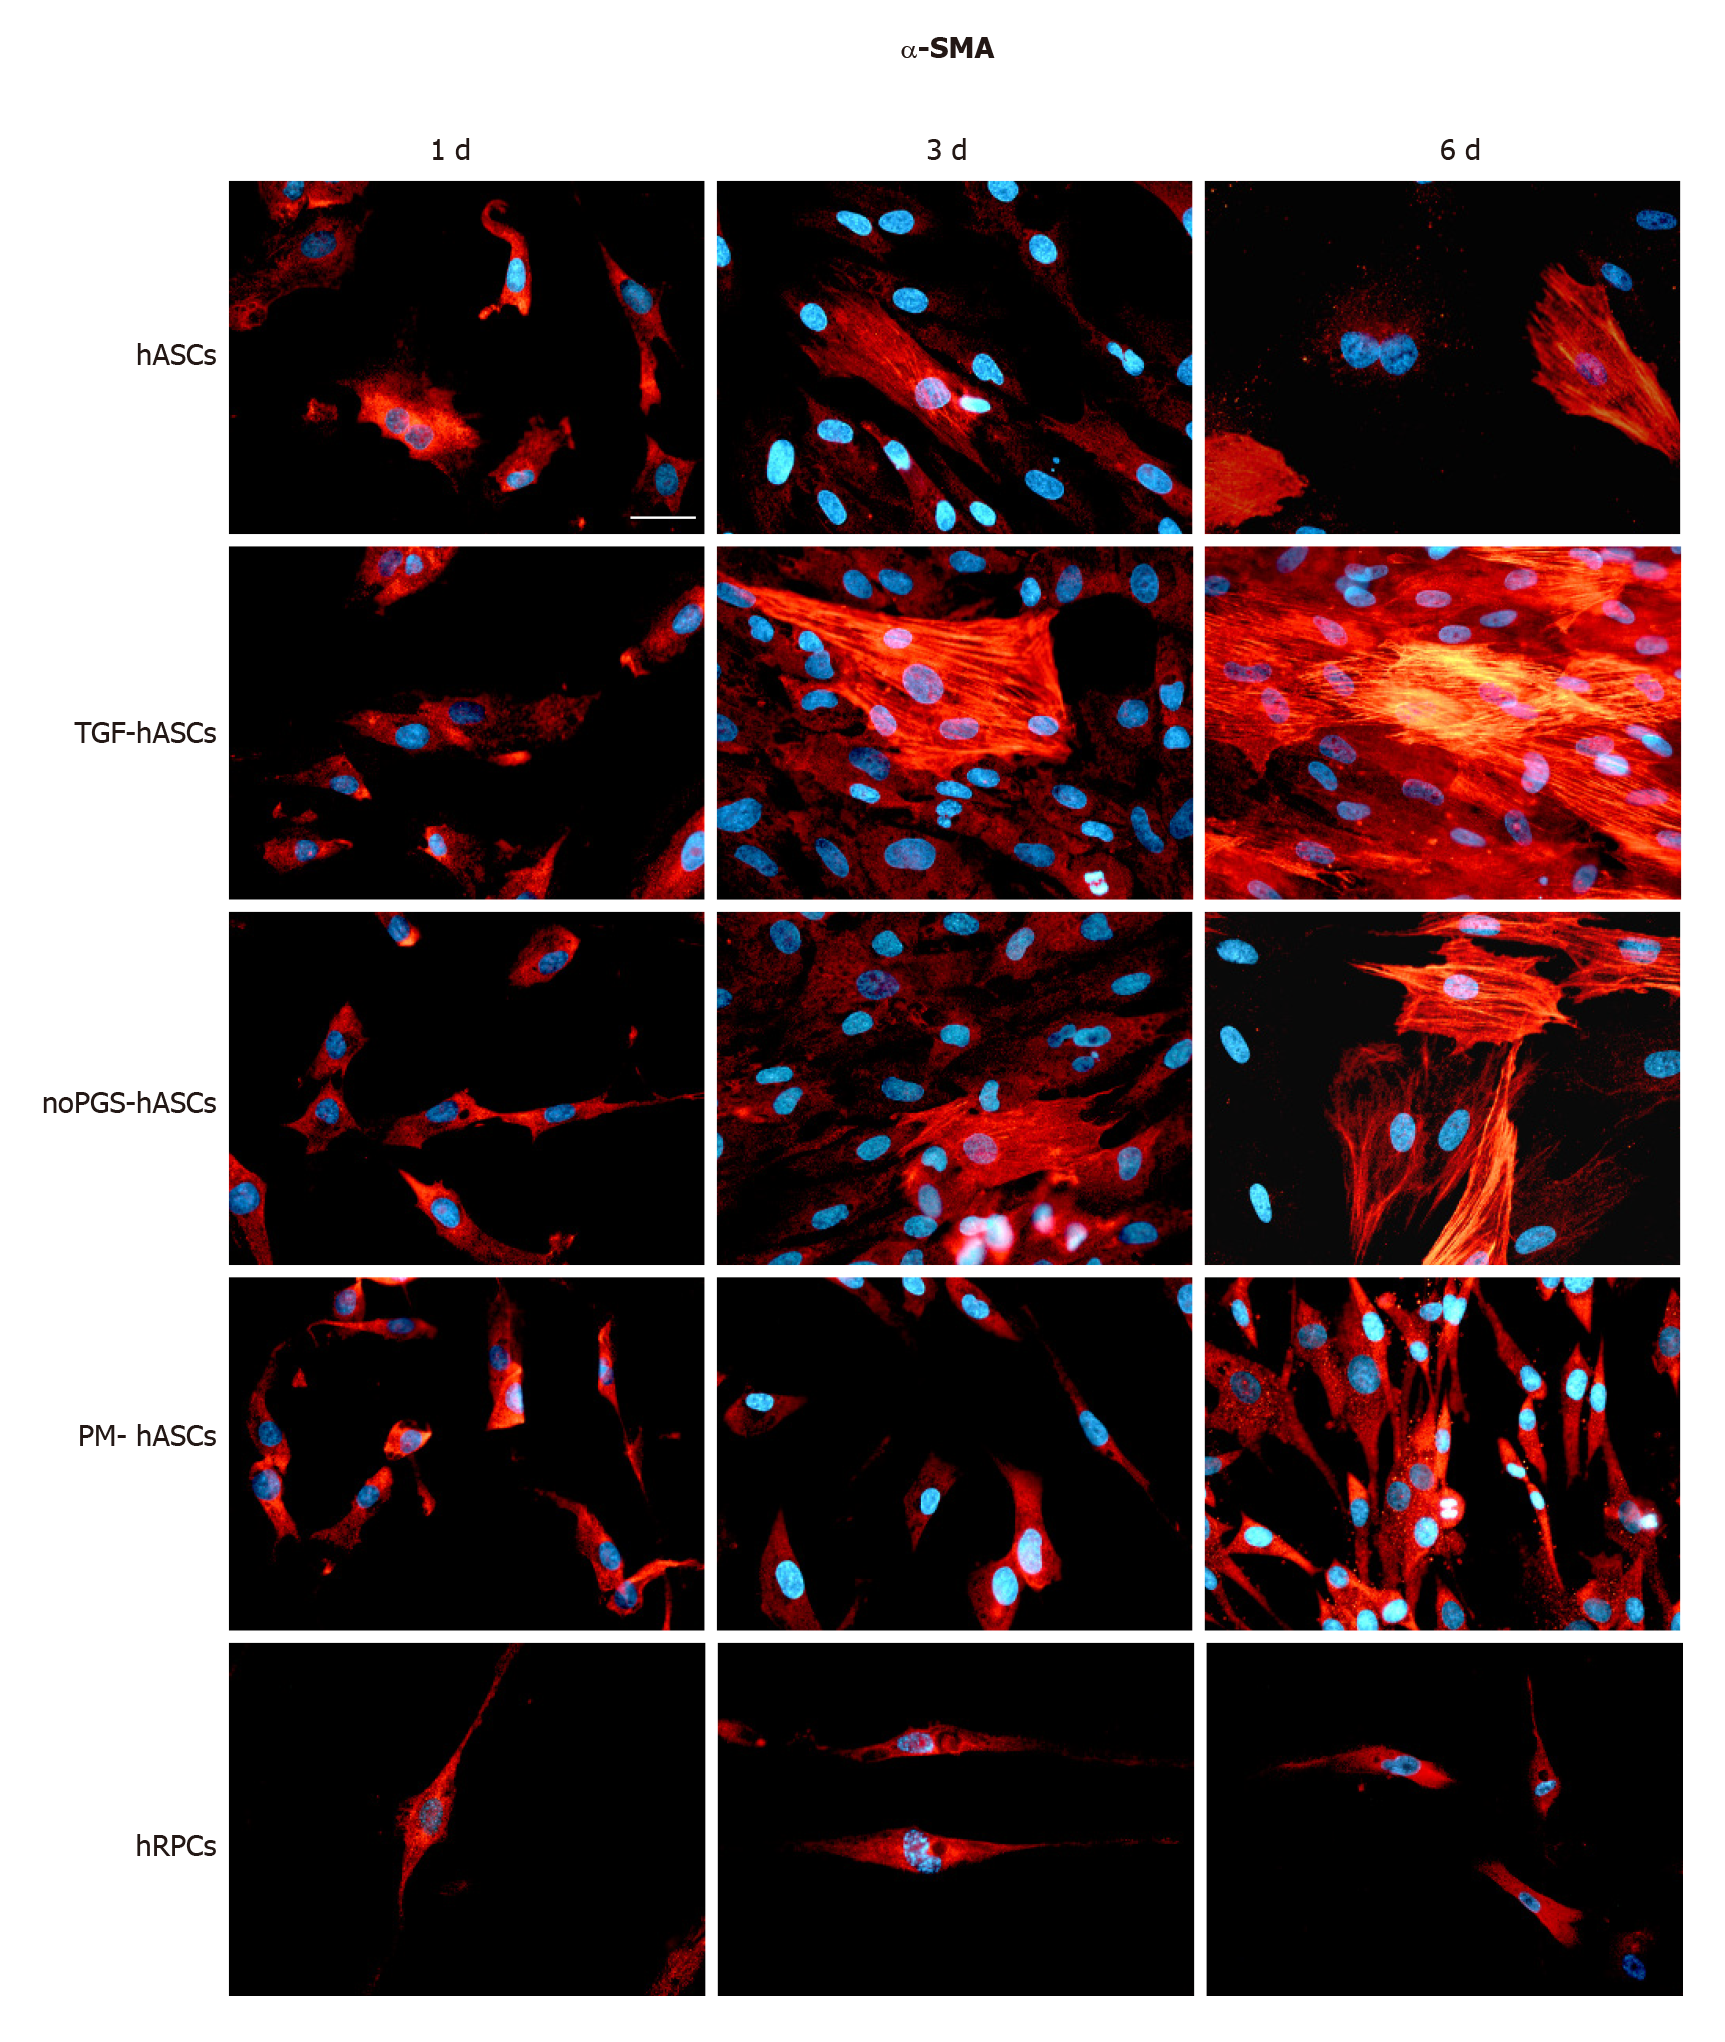
Figure 1 α-Smooth muscle actin immunoreactivity (red fluorescence) evaluated after one day (left column, 1 d), three days (middle column, 3 d) and six days (right column, 6 d) of cell growth.
First row: Human adipose-derived mesenchymal stem cells (hASCs) cultured in basal medium; Second row: hASCs in basal medium stimulated with transforming growth factor; Third row: hASCs cultured in pericyte medium without pericyte growth supplement; Fourth Row: hASCs cultured in complete pericyte medium; Fifth row: Human retinal pericyte cells cultured in complete pericyte medium (hRPCs). Photomicrographs show that only basal expression of α-SMA was detectable in hRPCs and all hASC groups at day 1 (left column). At day 3 and 6, a typical filamentous pattern of α-SMA was clearly detected in hASCs, hASCs in basal medium stimulated with transforming growth factor and hASCs cultured in pericyte medium without pericyte growth supplement, whereas the basal expression of α-SMA remained virtually unmodified in hASCs cultured in complete pericyte medium and hRPCs (last two rows). Blue fluorescence indicates DAPI staining of cell nuclei. Scale bar: 50 μm.
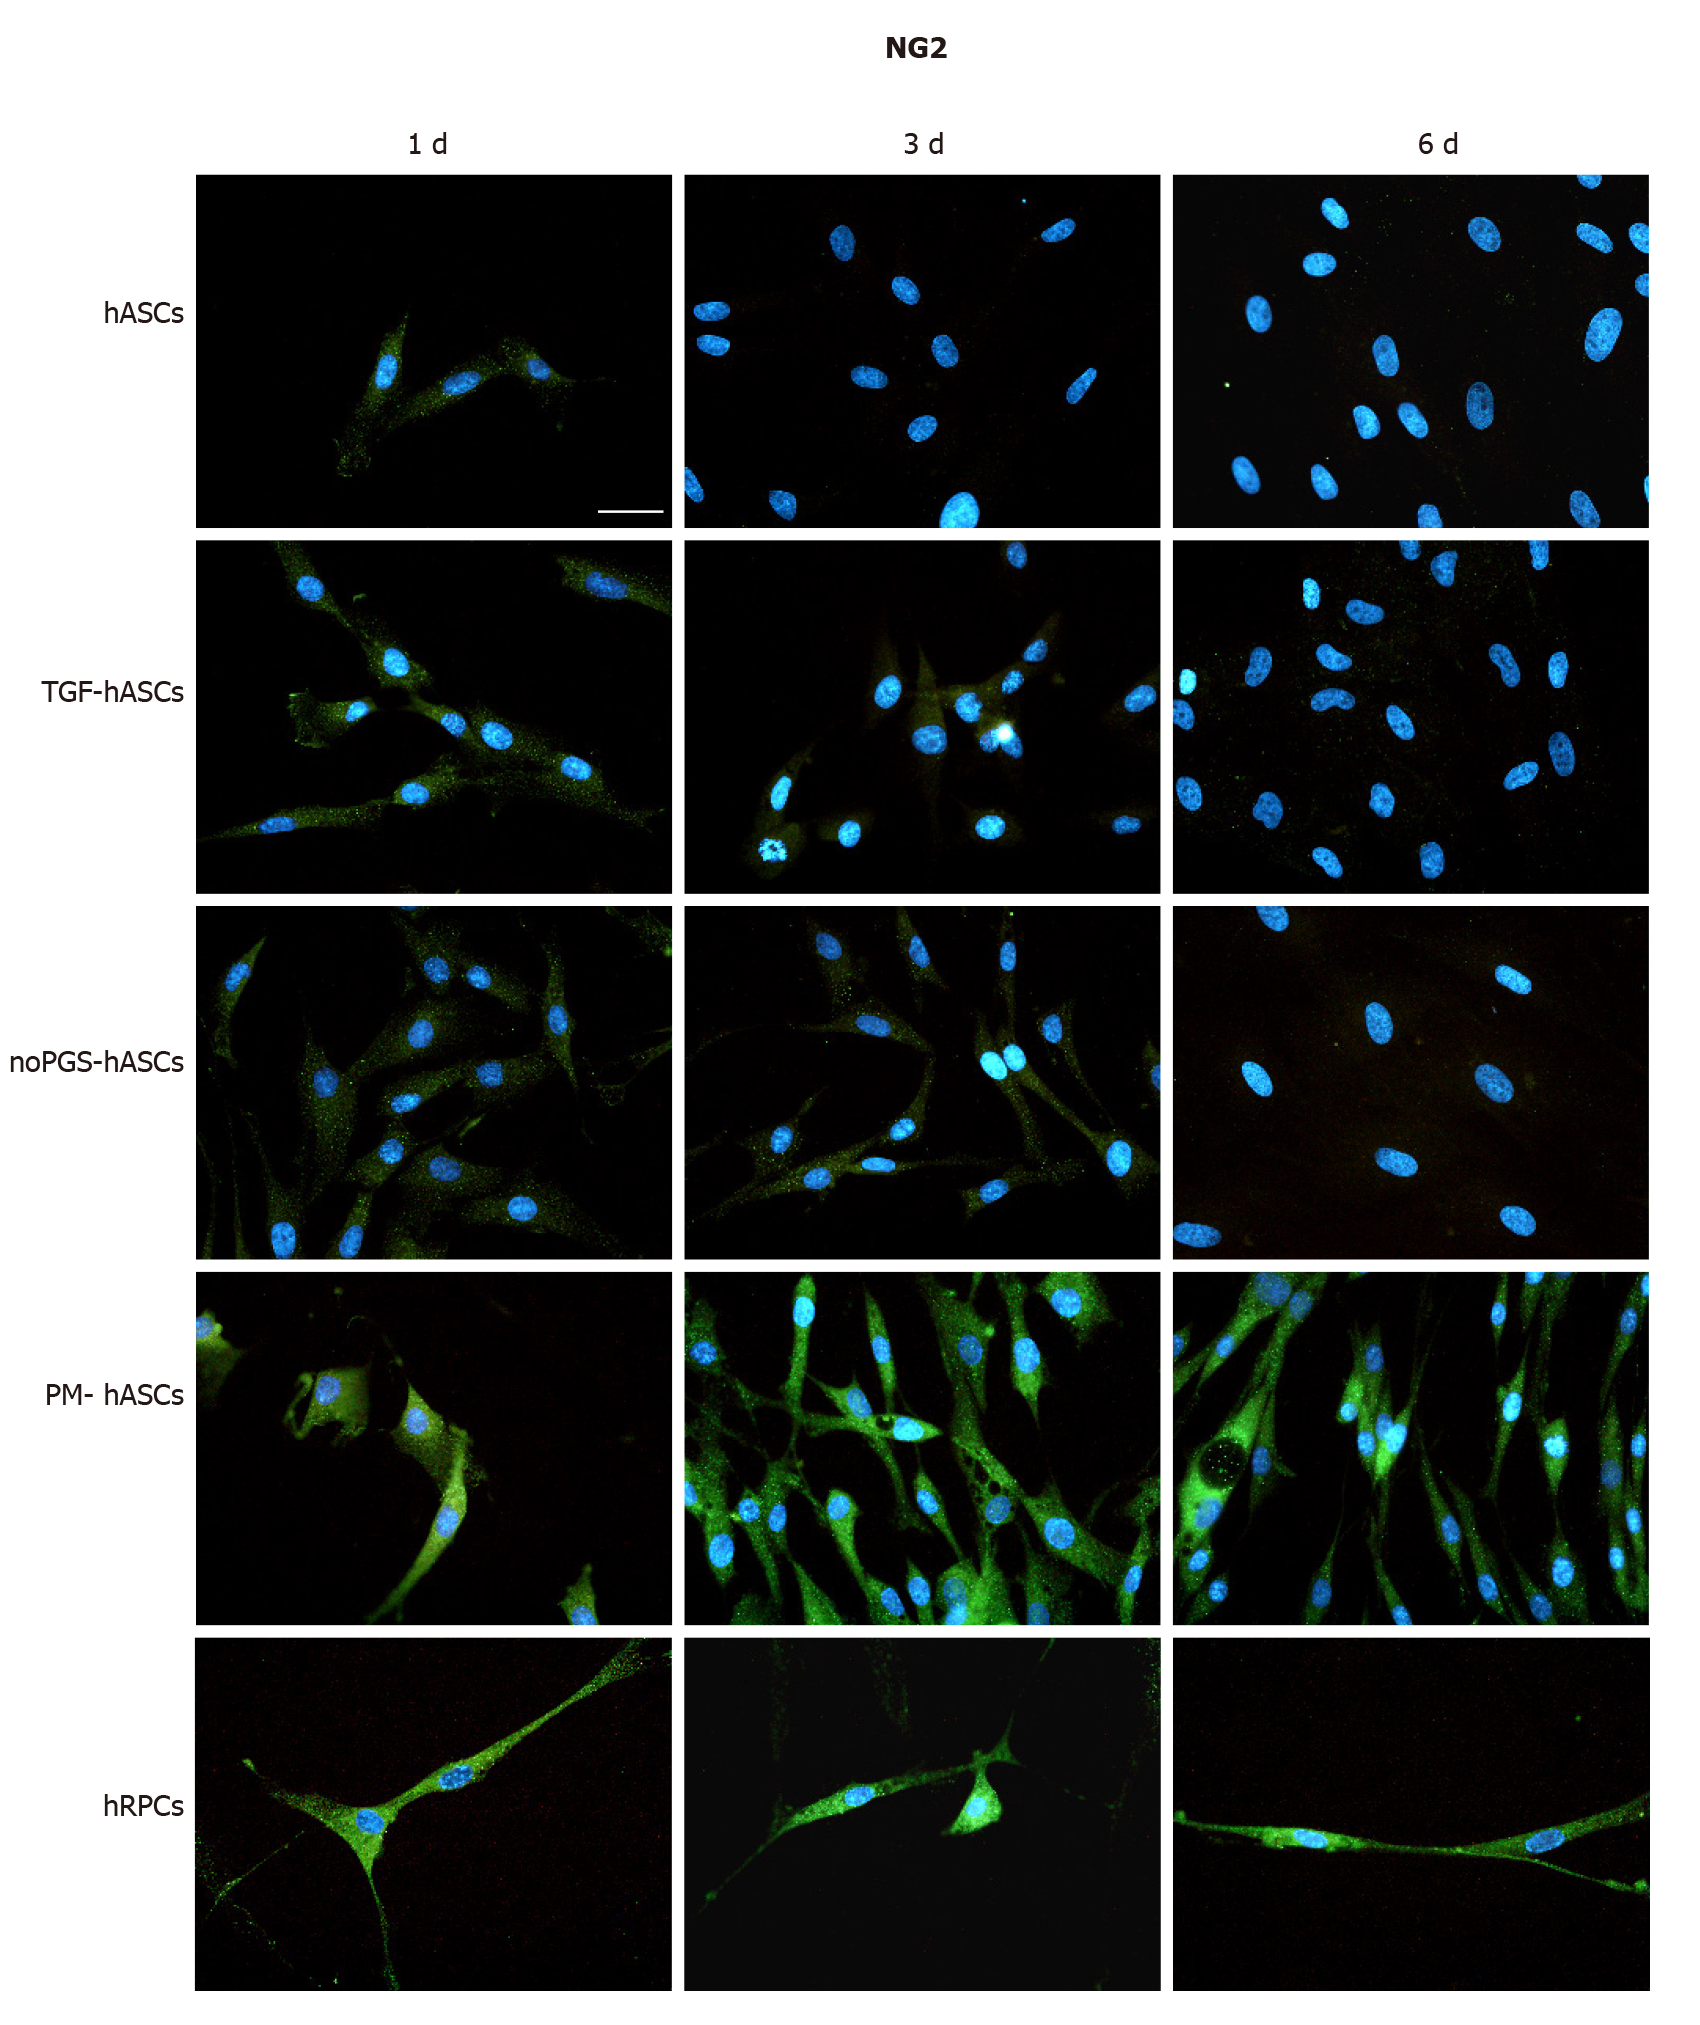
Figure 2 Neural/glial antigen 2 immunoreactivity (green fluorescence) evaluated after one day (left column, 1 d), three days (middle column, 3 d) and six days (right column, 6 d) of cell growth.
First row: Human adipose-derived mesenchymal stem cells (hASCs) cultured in basal medium; Second row: hASCs in basal medium stimulated with transforming growth factor; Third row: hASCs cultured in pericyte medium without pericyte growth supplement; Fourth Row: hASCs cultured in complete pericyte medium; Fifth row: Human retinal pericyte cells cultured in complete pericyte medium (hRPCs). Photomicrographs show that clear neural/glial antigen 2 immunoreactivity is present only in hASCs pre-cultured in complete pericyte medium and human retinal pericyte cells (last two rows). The immunostaining detected at day 1 is similar to that observed at day 3 and 6. Very weak immunostaining is visible in the other three hASC groups (first three rows). Blue fluorescence indicates DAPI staining of cell nuclei. Scale bar: 50 μm.
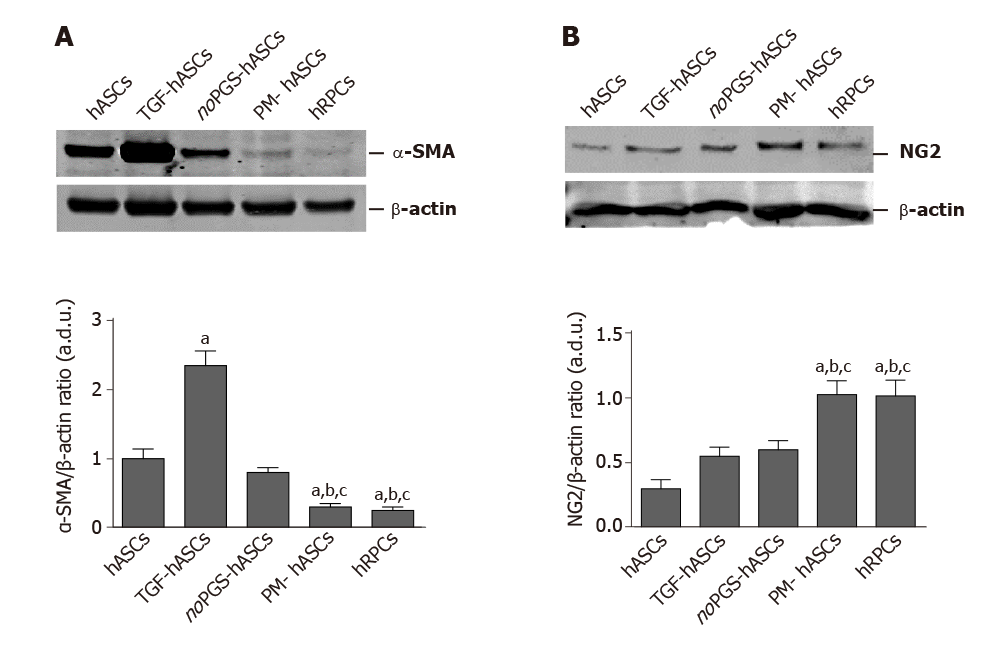
Figure 3 Western blot analysis of alpha smooth muscle actin and neural/glial antigen 2 expression in different groups of human adipose-derived mesenchymal stem cells and human retinal pericyte cells at 3 d of culture.
A: Western blot analysis of alpha smooth muscle actin expression; B: Western blot analysis of neural/glial antigen 2 expression. Histograms in A show that alpha smooth muscle actin levels measured in control human adipose-derived mesenchymal stem cells pre-cultured in basal medium (hASCs) are similar to hASCs pre-cultured in pericyte medium lacking pericyte growth supplement (noPGS-hASCs); much higher levels were found in hASCs pre-stimulated with transforming growth factor (TGF-hASCs); the lowest levels were observed in hASCs pre-cultured in complete pericyte medium (PM-hASCs), close to those for human retinal pericyte cells (hRPCs). Histograms in B show that neural/glial antigen 2 levels measured in control hASCs are slightly higher in TGF-hASCs and noPGS-hASCs; significant increases were observed in PM-hASCs, similar to those for hRPCs. All data represent mean ± SEM obtained from at least three independent experiments. Comparison between groups was evaluated by one-way ANOVA, followed by Tukey’s test. aIndicates significant difference (P < 0.05) vs hASCs; bIndicates significant difference (P < 0.05) vs TGF-hASCs; cIndicates significant difference (P < 0.05) vs noPGS-hASCs. α-SMA: Alpha smooth muscle actin; hASCs: Human adipose-derived mesenchymal stem cells pre-cultured in basal medium; hRPCs: Human retinal pericyte cells; NG2: Neural/glial antigen 2; noPGS-hASCs: hASCs pre-cultured in pericyte medium lacking pericyte growth supplement; PM-hASCs: hASCs pre-cultured in complete pericyte medium; TGF-hASCs: hASCs pre-stimulated with transforming growth factor.
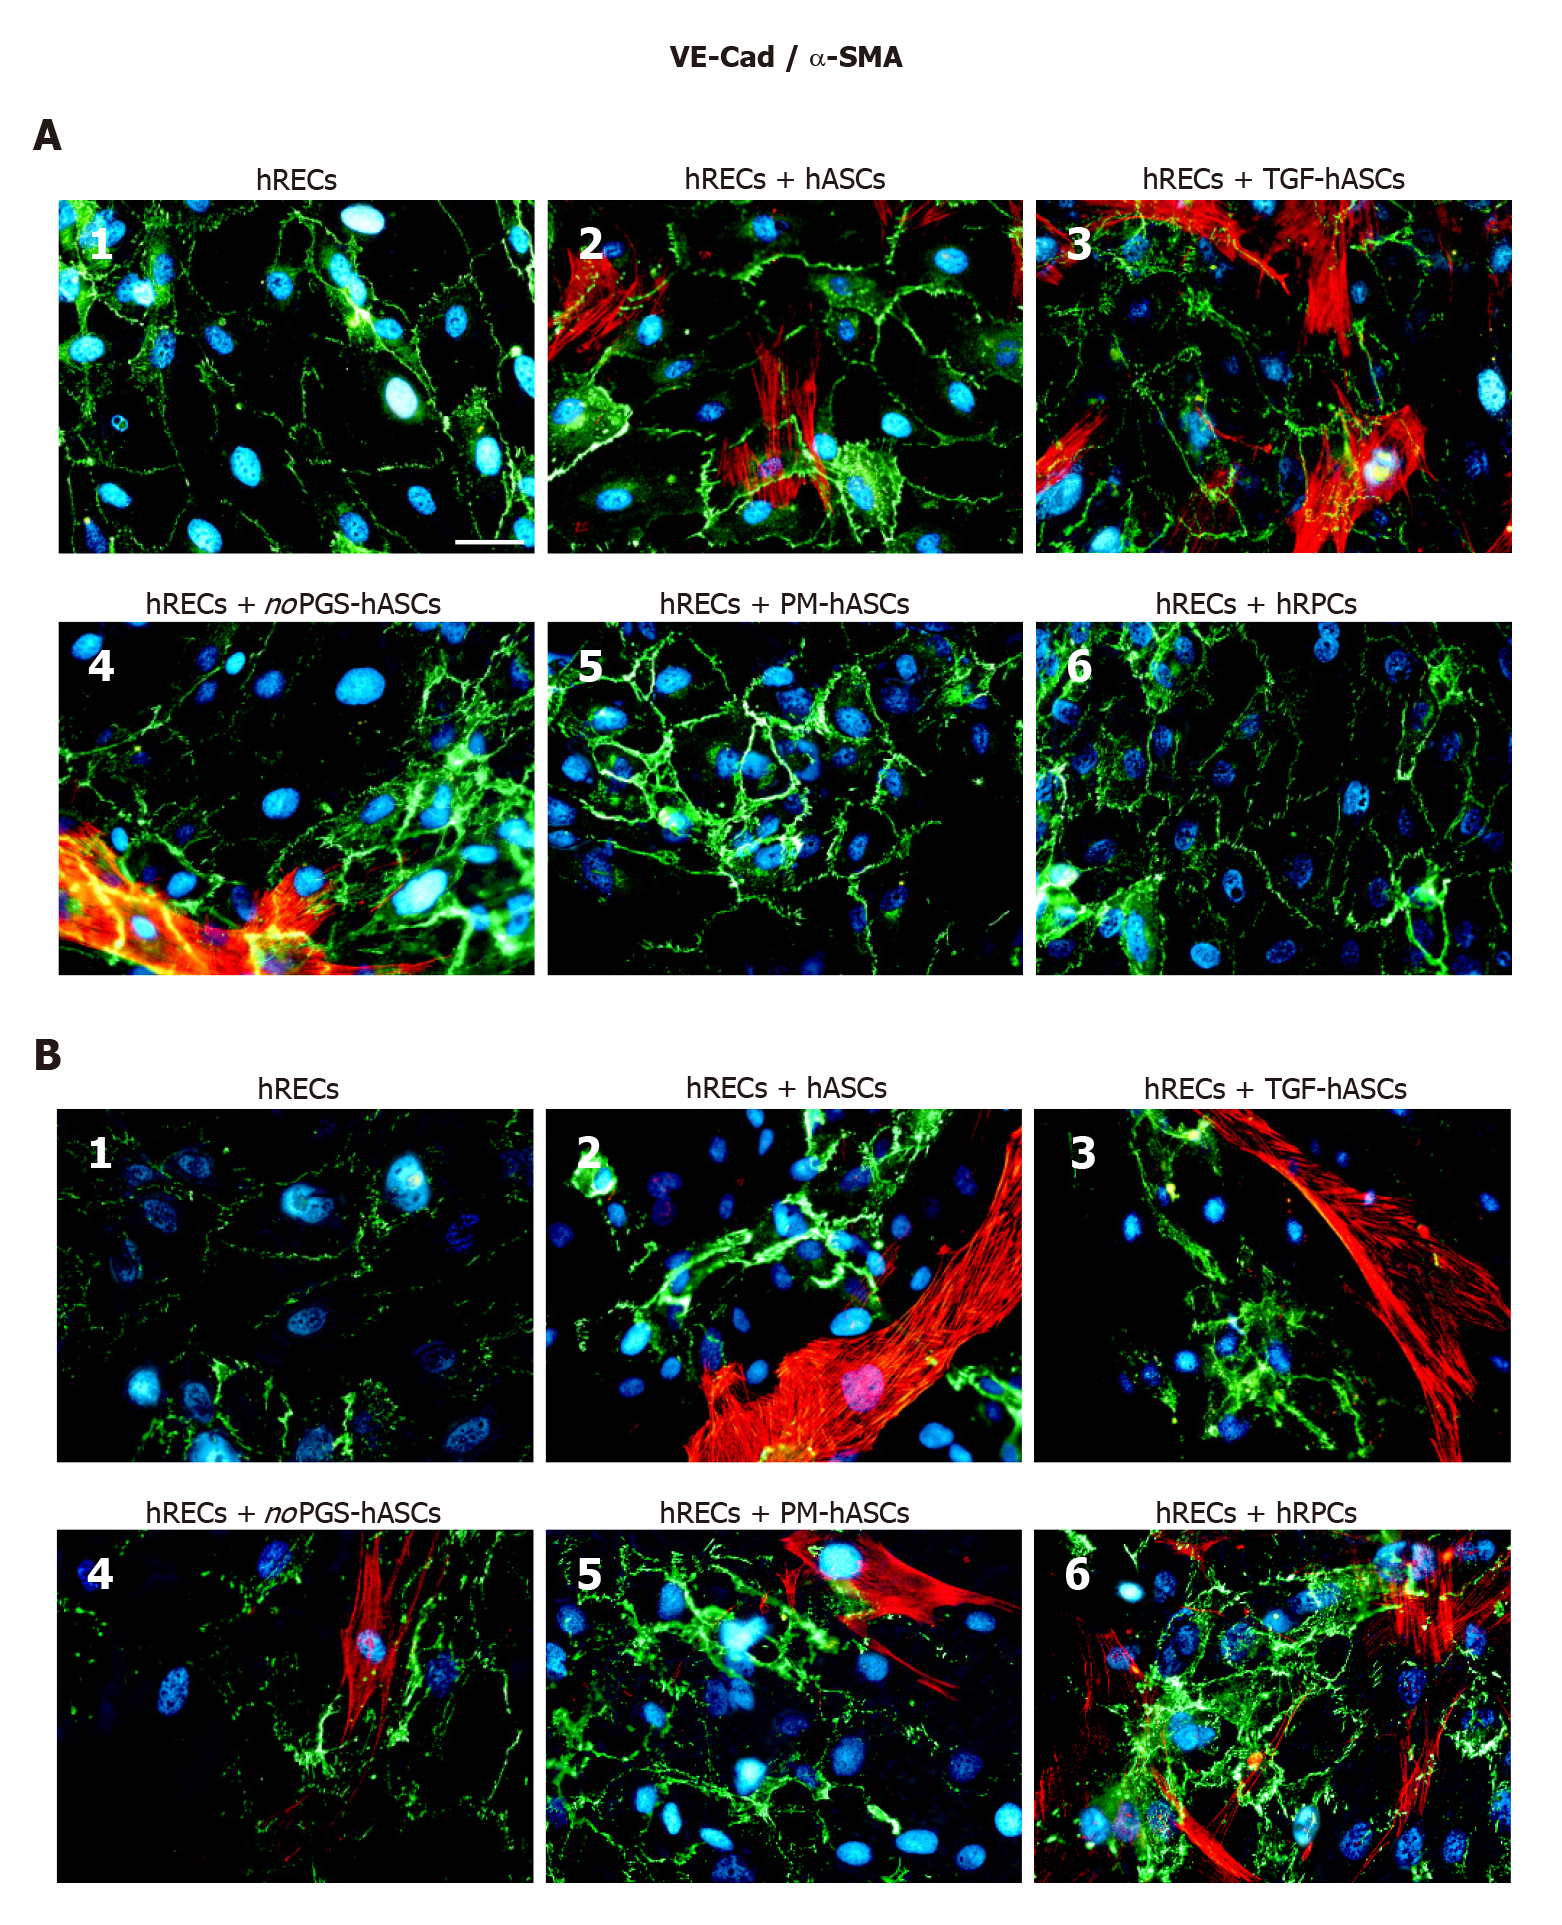
Figure 4 Double-labeling experiments of vascular endothelial-Cadherin (green immunofluorescence) and alpha smooth muscle actin (red immunofluorescence) in co-cultures of human retinal endothelial cells and human retinal pericyte cells or different groups of human adipose-derived mesenchymal stem cells.
A: Photomicrographs show results obtained after 1 d of co-culture; B: Photomicrographs show results obtained after 4 d of co-culture. Photomicrographs A1 and B1 refer to cultures of human retinal endothelial cells (hRECs) alone that were taken as a reference. In these cultures, only vascular endothelial-Cadherin (VE-Cad) immunostaining is present, showing the typical localization at the level of plasma membranes of adjacent cells. On day 1, when hRECs were co-cultured with different groups of human adipose-derived mesenchymal stem cells (A2-A5) or human retinal pericyte cells (hRPCs) (A6), VE-Cad immunostaining appeared more intense. A similar trend of VE-Cad immunostaining is recognizable after 4 d of co-culture (B2-B6). On day 1 of co-culture, an alpha smooth muscle actin (α-SMA) typical filamentous pattern is visible only in hASCs pre-cultured in their basal medium (A2), pre-stimulated with transforming growth factor (A3) or pre-cultured in pericyte medium lacking pericyte growth supplement (A4). No α-SMA immunostaining is detected in hRPCs (A6) or in hASCs pre-cultured in pericyte medium (A5). On day 4, α-SMA immunostaining is detectable also in these two conditions (B5, B6). No α-SMA immunoreactivity is noticeable in A1 and B1, which refer to cultures of hRECs alone. Blue fluorescence indicates DAPI staining of cell nuclei. Scale bar: 50 μm. α-SMA: Alpha smooth muscle actin; hASCs: Human adipose-derived mesenchymal stem cells pre-cultured in basal medium; hRECs: Human retinal endothelial cells; hRPCs: Human retinal pericyte cells; noPGS-hASCs: hASCs pre-cultured in pericyte medium lacking pericyte growth supplement; PM-hASCs: hASCs pre-cultured in complete pericyte medium; TGF-hASCs: hASCs pre-stimulated with transforming growth factor; VE-Cad: Vascular endothelial-Cadherin.
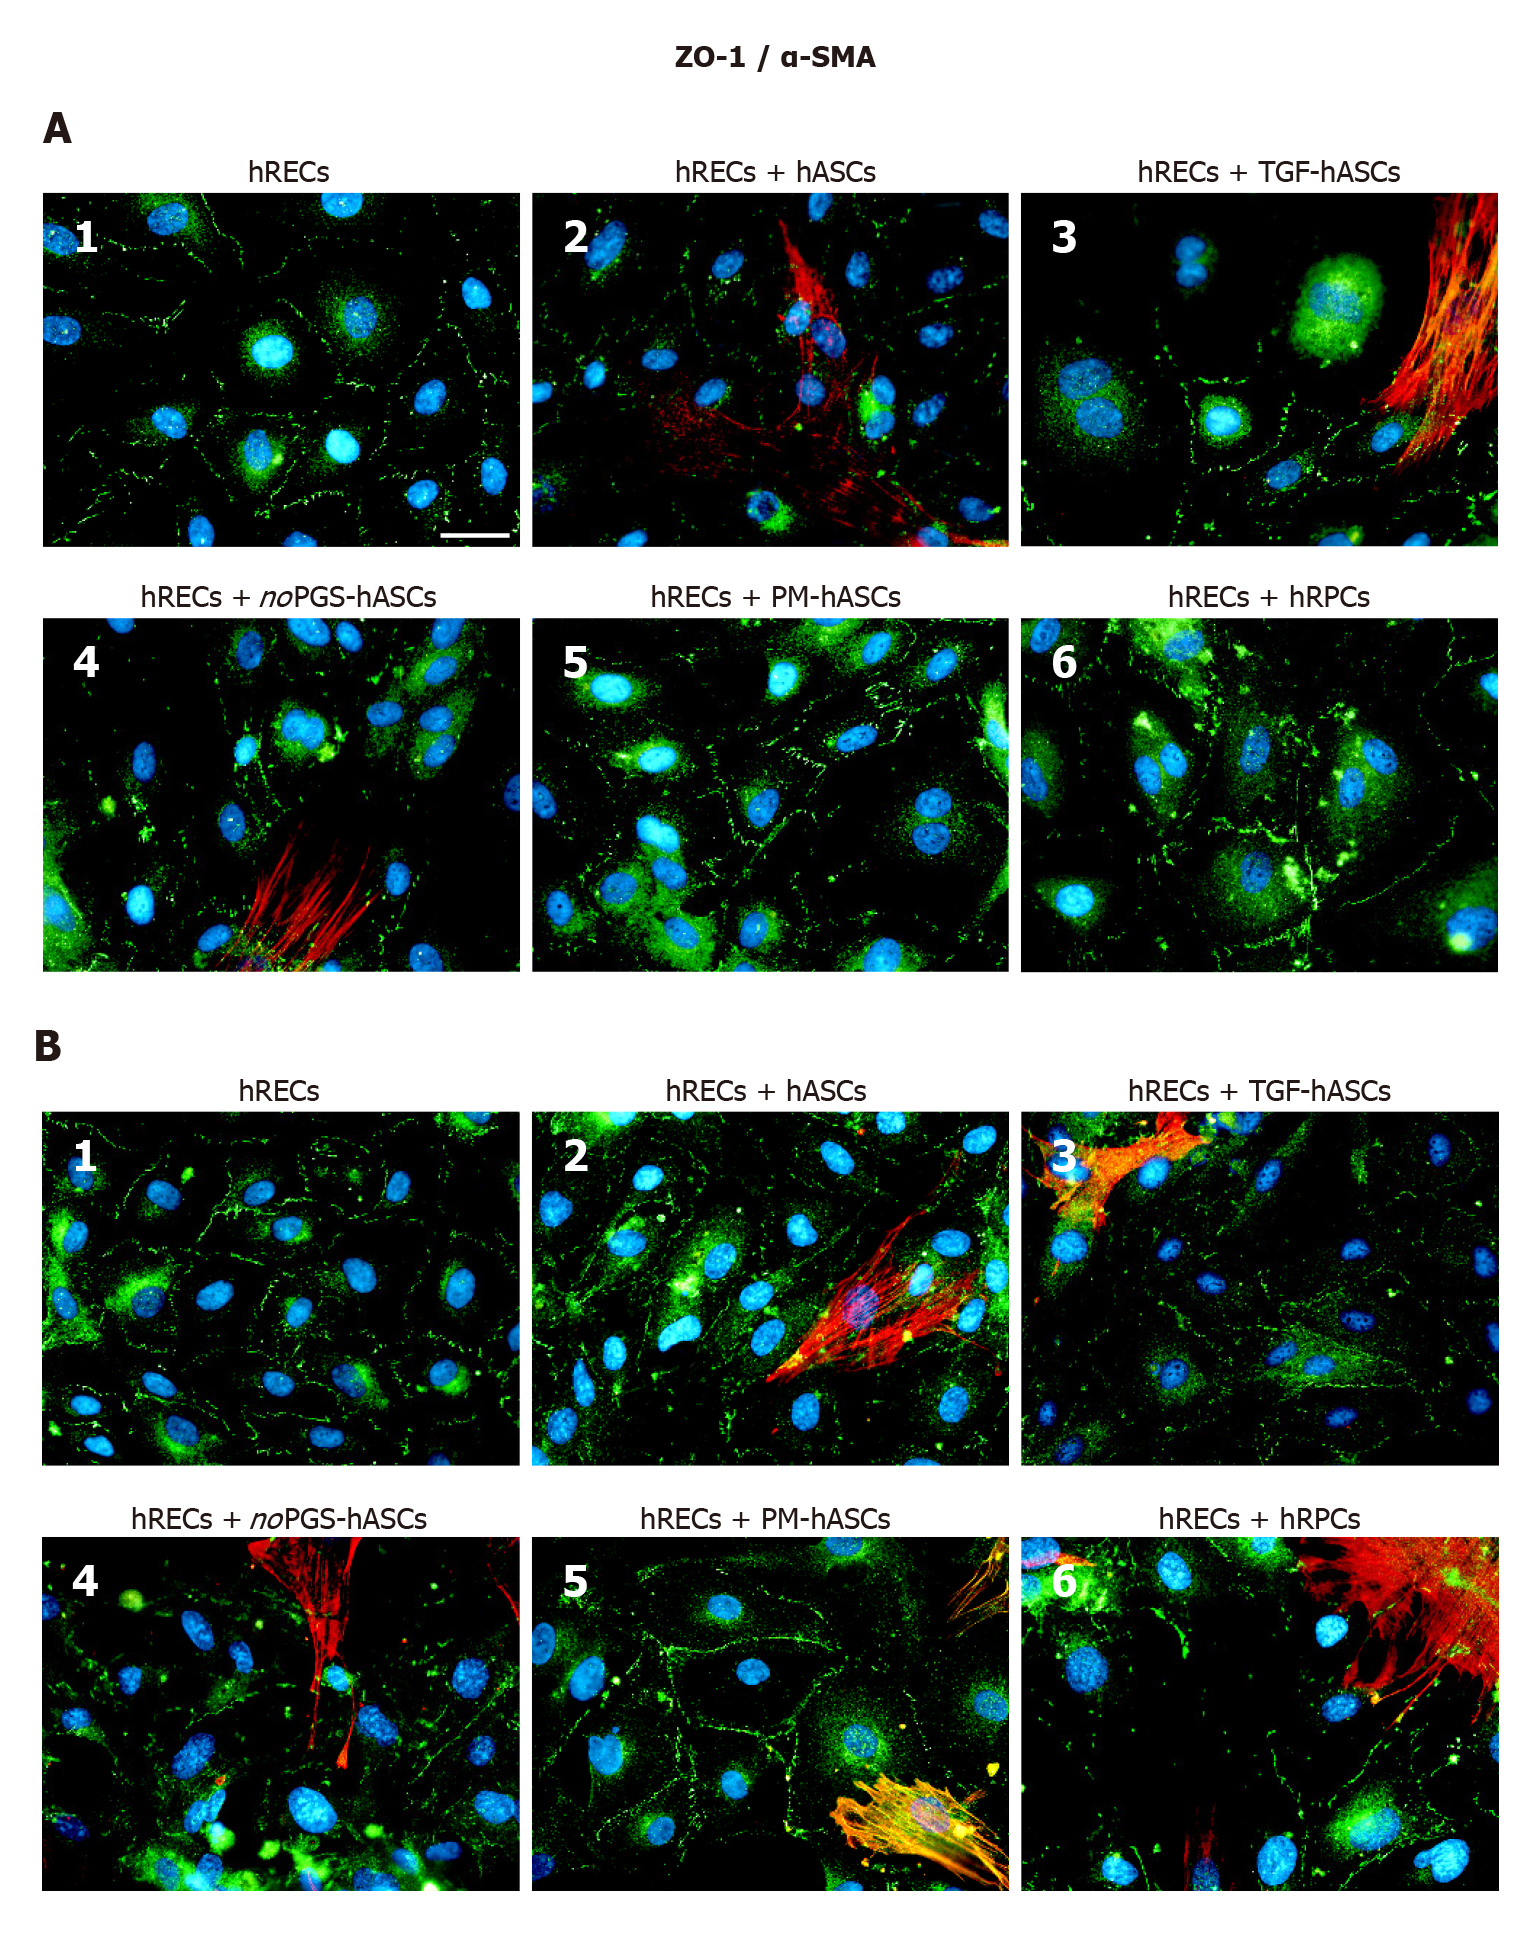
Figure 5 Double-labeling experiments of zonula occludens 1 (green immunofluorescence) and alpha smooth muscle actin (red immunofluorescence) in co-cultures of human retinal endothelial cells and human retinal pericyte cells or different groups of human adipose-derived mesenchymal stem cells.
A: Photomicrographs show results obtained after 1 d of co-culture; B: Photomicrographs show results obtained after 4 d of co-culture. Photomicrographs A1 and B1 refer to cultures of human retinal endothelial cells (hRECs) alone, which were taken as a reference. In these cultures, only zonula occludens 1 (ZO-1) immunostaining is present showing typical localization at the level of plasma membranes of adjacent cells. On day 1, when hRECs were co-cultured with different groups of human adipose-derived mesenchymal stem cells (A2-A5) or human retinal pericyte cells (hRPCs) (A6), ZO-1 immunostaining appears more intense. A similar trend of ZO-1 immunostaining is recognizable after 4 d of co-culture (B2-B6). On day 1 of co-culture, an alpha smooth muscle actin (α-SMA) typical filamentous pattern is clearly detectable only in hASCs pre-cultured in basal medium (A2), pre-stimulated with transforming growth factor (A3), or pre-cultured in pericyte medium lacking pericyte growth supplement (A4). However, no α-SMA immunostaining is detected in hRPCs (A6) or in hASCs pre-cultured in pericyte medium (A5). On day 4, α-SMA immunostaining is also detectable in these two conditions (B5, B6). No α-SMA immunoreactivity is noticeable in A1 and B1, which refer to cultures of hRECs alone. Blue fluorescence indicates DAPI staining of cell nuclei. Scale bar: 50 μm. α-SMA, alpha smooth muscle actin; hASCs: Human adipose-derived mesenchymal stem cells; hRECs: Human retinal endothelial cells; hRPCs: Human retinal pericyte cells; TGF-hASCs, hASCs pre-stimulated with transforming growth factor; noPGS-hASCs: hASCs pre-cultured in pericyte medium lacking pericyte growth supplement; PM-hASCs: hASCs pre-cultured in complete pericyte medium; ZO-1: Zonula occludens 1.
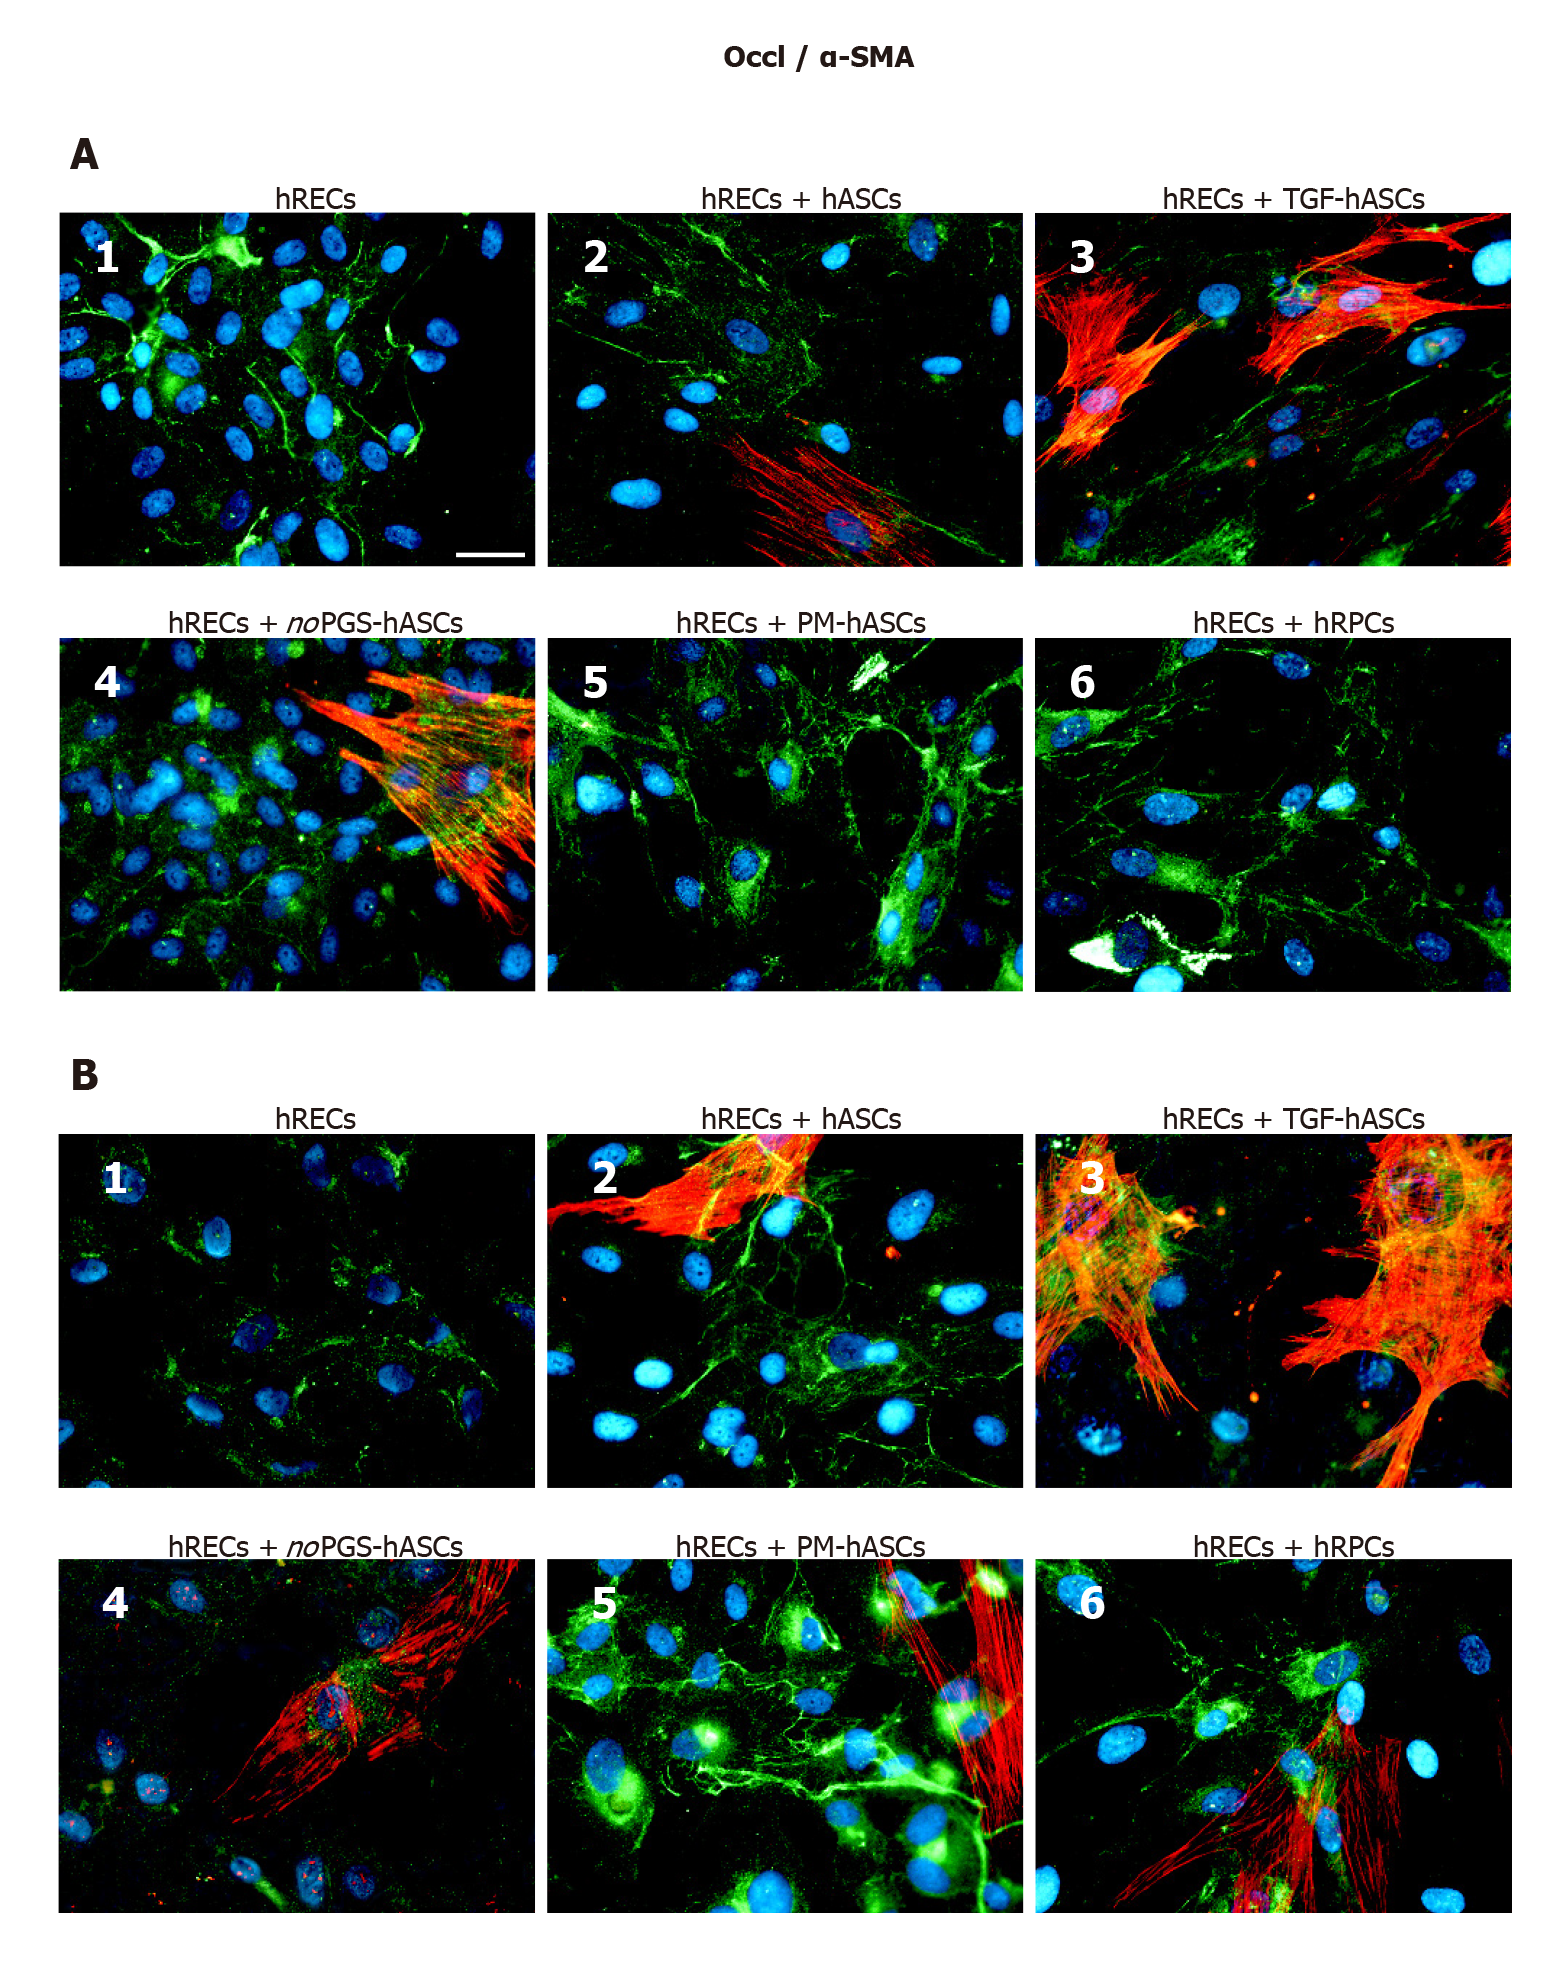
Figure 6 Double-labeling experiments of Occludin (green immunofluorescence) and alpha smooth muscle actin (red immunofluorescence) in co-cultures of human retinal endothelial cells and human retinal pericyte cells or different groups of human adipose-derived mesenchymal stem cells.
A: Photomicrographs show results obtained after 1 d of co-culture; B: Photomicrographs show results obtained after 4 d of co-culture. Photomicrographs A1 and B1 refer to cultures of human retinal endothelial cells (hRECs) alone, which were taken as a reference. In these cultures, only Occludin (Occl) immunostaining is present. On day 1, when hRECs were co-cultured with different groups of human adipose-derived mesenchymal stem cells (A2-A5) or human retinal pericyte cells (hRPCs) (A6), Occl immunostaining appears more intense. A similar trend of Occl immunostaining is recognizable after 4 d of co-culture (B2-B6). On day 1 of co-culture, an alpha smooth muscle actin (α-SMA) typical filamentous pattern is clearly detectable only in hASCs pre-cultured in basal medium (A2), pre-stimulated with transforming growth factor (A3), or pre-cultured in pericyte medium lacking pericyte growth supplement (A4). On the contrary, no α-SMA immunostaining is detected in hRPCs (A6) or in hASCs pre-cultured in PM (A5). On day 4, α-SMA immunostaining is detectable also in these two conditions (B5, B6). No α-SMA immunoreactivity is noticeable in A1 and B1, which refer to cultures of hRECs alone. Blue fluorescence indicates DAPI staining of cell nuclei. Scale bar: 50 μm. α-SMA: Alpha smooth muscle actin; hASCs: Human adipose-derived mesenchymal stem cells pre-cultured in basal medium; hRECs: Human retinal endothelial cells; hRPCs: Human retinal pericyte cells; TGF-hASCs: hASCs pre-stimulated with transforming growth factor; noPGS-hASCs: hASCs pre-cultured in pericyte medium lacking pericyte growth supplement; Occl: Occludin; PM-hASCs: hASCs pre-cultured in complete pericyte medium.
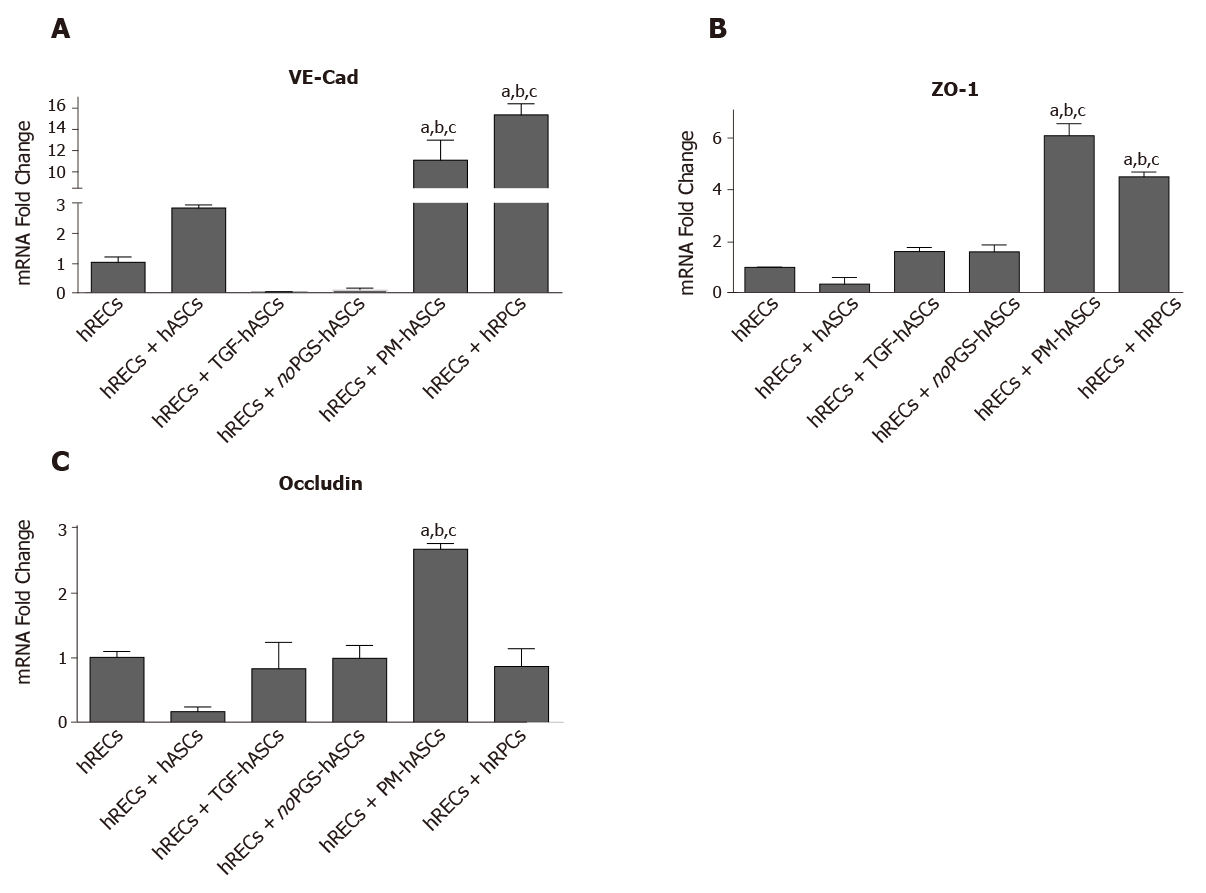
Figure 7 mRNA levels of junction proteins in human retinal endothelial cells after 4 days of co-culture with human retinal pericyte cells or different groups of human adipose-derived mesenchymal stem cells.
A: Histogram bars represent mRNA fold changes for vascular endothelial-Cadherin; B: Zonula occludens-1; and C: Occludin. Results are referred to the control levels of human retinal endothelial cells and normalized to the RNA expression of the housekeeping reference ribosomal gene 18S. All data represent mean ± SEM obtained from at least three independent experiments. Comparison between groups was evaluated by one-way ANOVA, followed by Tukey’s test. aIndicates significant difference (P < 0.05) vs human retinal endothelial cells; bIndicates significant difference (P < 0.05) vs human adipose-derived mesenchymal stem cells pre-stimulated with transforming growth factor; cIndicates significant difference (P < 0.05) vs human adipose-derived mesenchymal stem cells pre-cultured in pericyte medium lacking pericyte growth supplement.
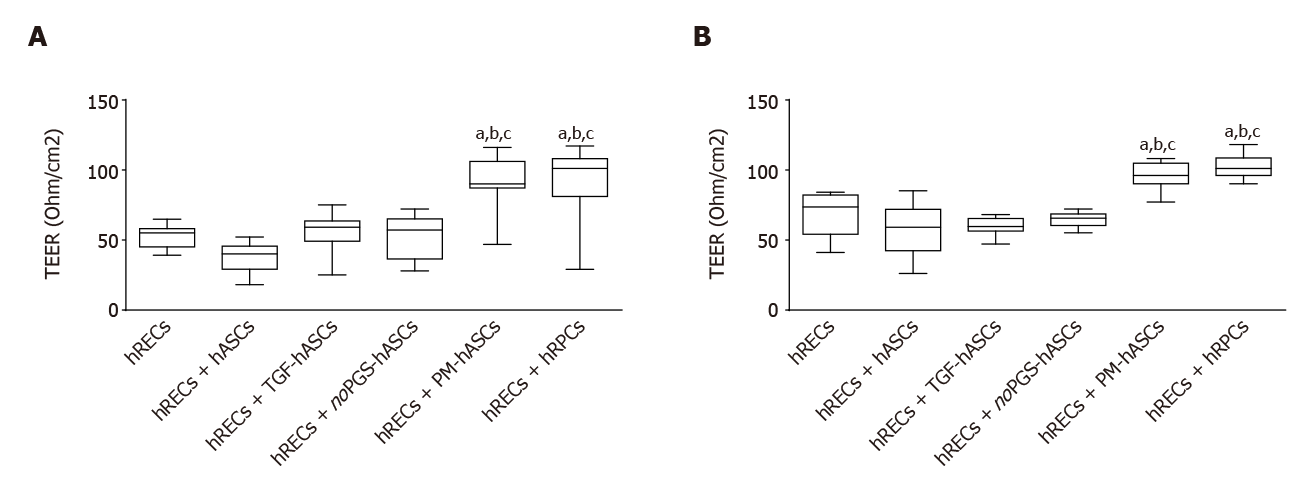
Figure 8 Evaluation of the barrier integrity by trans-endothelial electrical resistance in human retinal endothelial cells monocultures or in co-cultures of human retinal endothelial cells with pericytes (human retinal pericyte cells) or different groups of human adipose-derived mesenchymal stem cells.
A: Trans-endothelial electrical resistance values measured on day 3; B: Trans-endothelial electrical resistance values measured on day 6. Trans-endothelial electrical resistance values measured on day 3 (A) and day 6 (B) show that significant increases were observed only when human retinal endothelial cells (hRECs) were co-cultured with human adipose-derived mesenchymal stem cells pre-cultured in complete pericyte medium or human retinal pericyte cells. Values are expressed as Ohm/cm2 and calculated by the formula: (Average resistance of experimental wells - average resistance of blank wells) × 0.33 (area of the transwell membrane). Values were gathered from three independent experiments carried out in duplicate (n = 6). The boxes define the 25th and 75th percentile; the center line is the median; the whiskers are the range. aIndicates significant difference (P < 0.05) vs hRECs; bIndicates significant difference (P < 0.05) vs hASCs pre-stimulated with transforming growth factor; cIndicates significant difference (P < 0.05) vs hASCs pre-cultured in pericyte medium lacking pericyte growth supplement. hASCs: Human adipose-derived mesenchymal stem cells pre-cultured in basal medium; hRECs: Human retinal endothelial cells; hRPCs: Human retinal pericyte cells; TGF-hASCs: hASCs pre-stimulated with transforming growth factor; noPGS-hASCs: hASCs pre-cultured in pericyte medium lacking pericyte growth supplement; PM-hASCs: hASCs pre-cultured in complete pericyte medium.
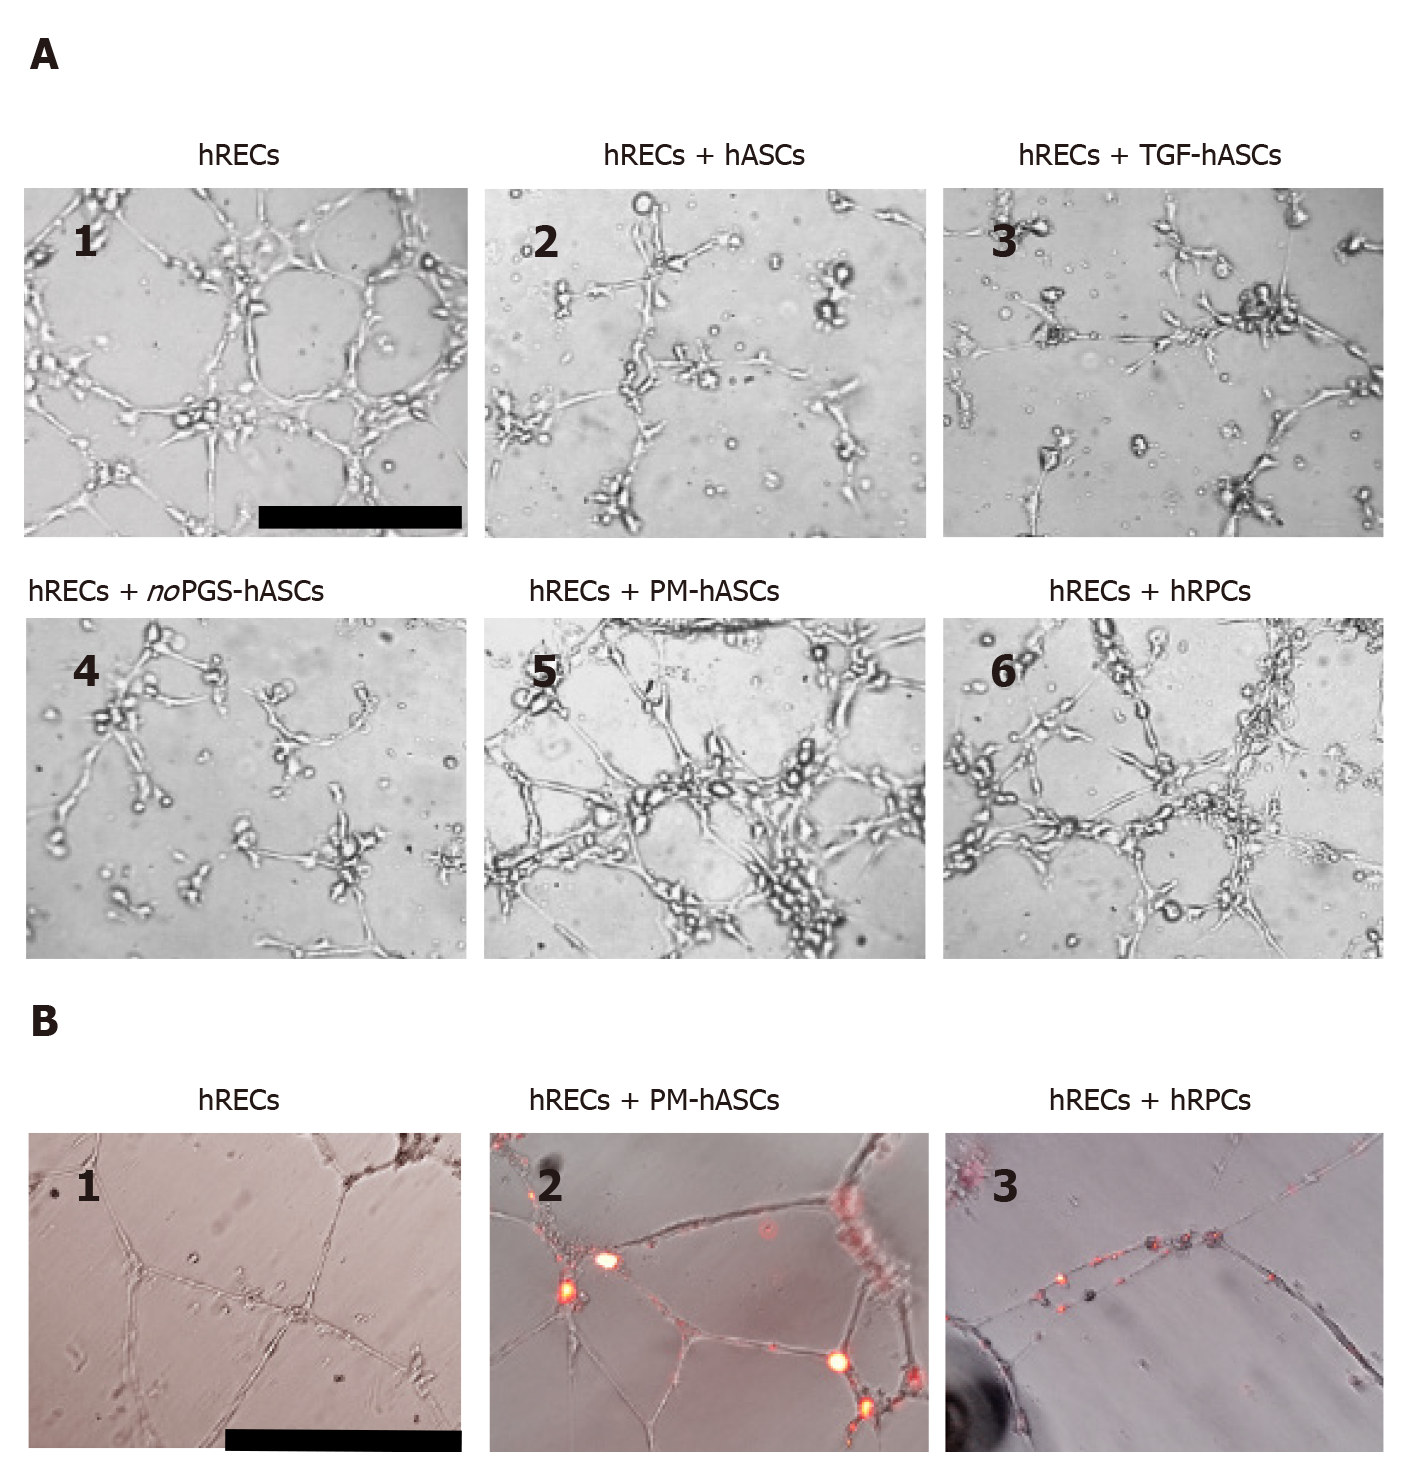
Figure 9 In vitro three-dimensional cell cultures in Matrigel.
A: After 6 h from seeding, human retinal endothelial cells (hRECs) cultured on Matrigel spontaneously form tubular microvessel-like structures (1). This predisposition appears enhanced when hRECs are co-cultured with human retinal pericyte cells (hRPCs) (6) or hASCs pre-cultured in complete pericyte medium (PM-hASCs) (5). No evident improvements are detectable if hRECs are co-cultured with control hASCs (2), hASCs pre-stimulated with transforming growth factor (3) or hASCs pre-cultured in pericyte medium lacking pericyte growth supplement (4). Scale bar: 100 μm. B: Typical tubular microvessel-like structures spontaneously formed by hRECs after 20 h from seeding (1). In 2 and 3, PM-hASCs and hRPCs, prelabeled with DiI (red fluorescence), were co-cultured with hRECs. In these cases, both cell types occupied the identical location in proximity to the tubular formations. Scale bar: 50 μm. hASCs: Human adipose derived mesenchymal stem cells pre-cultured in basal medium; hRECs: Human retinal endothelial cells; hRPCs: Human retinal pericyte cells; TGF-hASCs: hASCs pre-stimulated with transforming growth factor; noPGS-hASCs: hASCs pre-cultured in pericyte medium lacking pericyte growth supplement; PM-hASCs: hASCs pre-cultured in complete pericyte medium.
- Citation: Mannino G, Gennuso F, Giurdanella G, Conti F, Drago F, Salomone S, Lo Furno D, Bucolo C, Giuffrida R. Pericyte-like differentiation of human adipose-derived mesenchymal stem cells: An in vitro study. World J Stem Cells 2020; 12(10): 1152-1170
- URL: https://www.wjgnet.com/1948-0210/full/v12/i10/1152.htm
- DOI: https://dx.doi.org/10.4252/wjsc.v12.i10.1152


