Copyright
©The Author(s) 2019.
World J Stem Cells. Feb 26, 2019; 11(2): 84-99
Published online Feb 26, 2019. doi: 10.4252/wjsc.v11.i2.84
Published online Feb 26, 2019. doi: 10.4252/wjsc.v11.i2.84
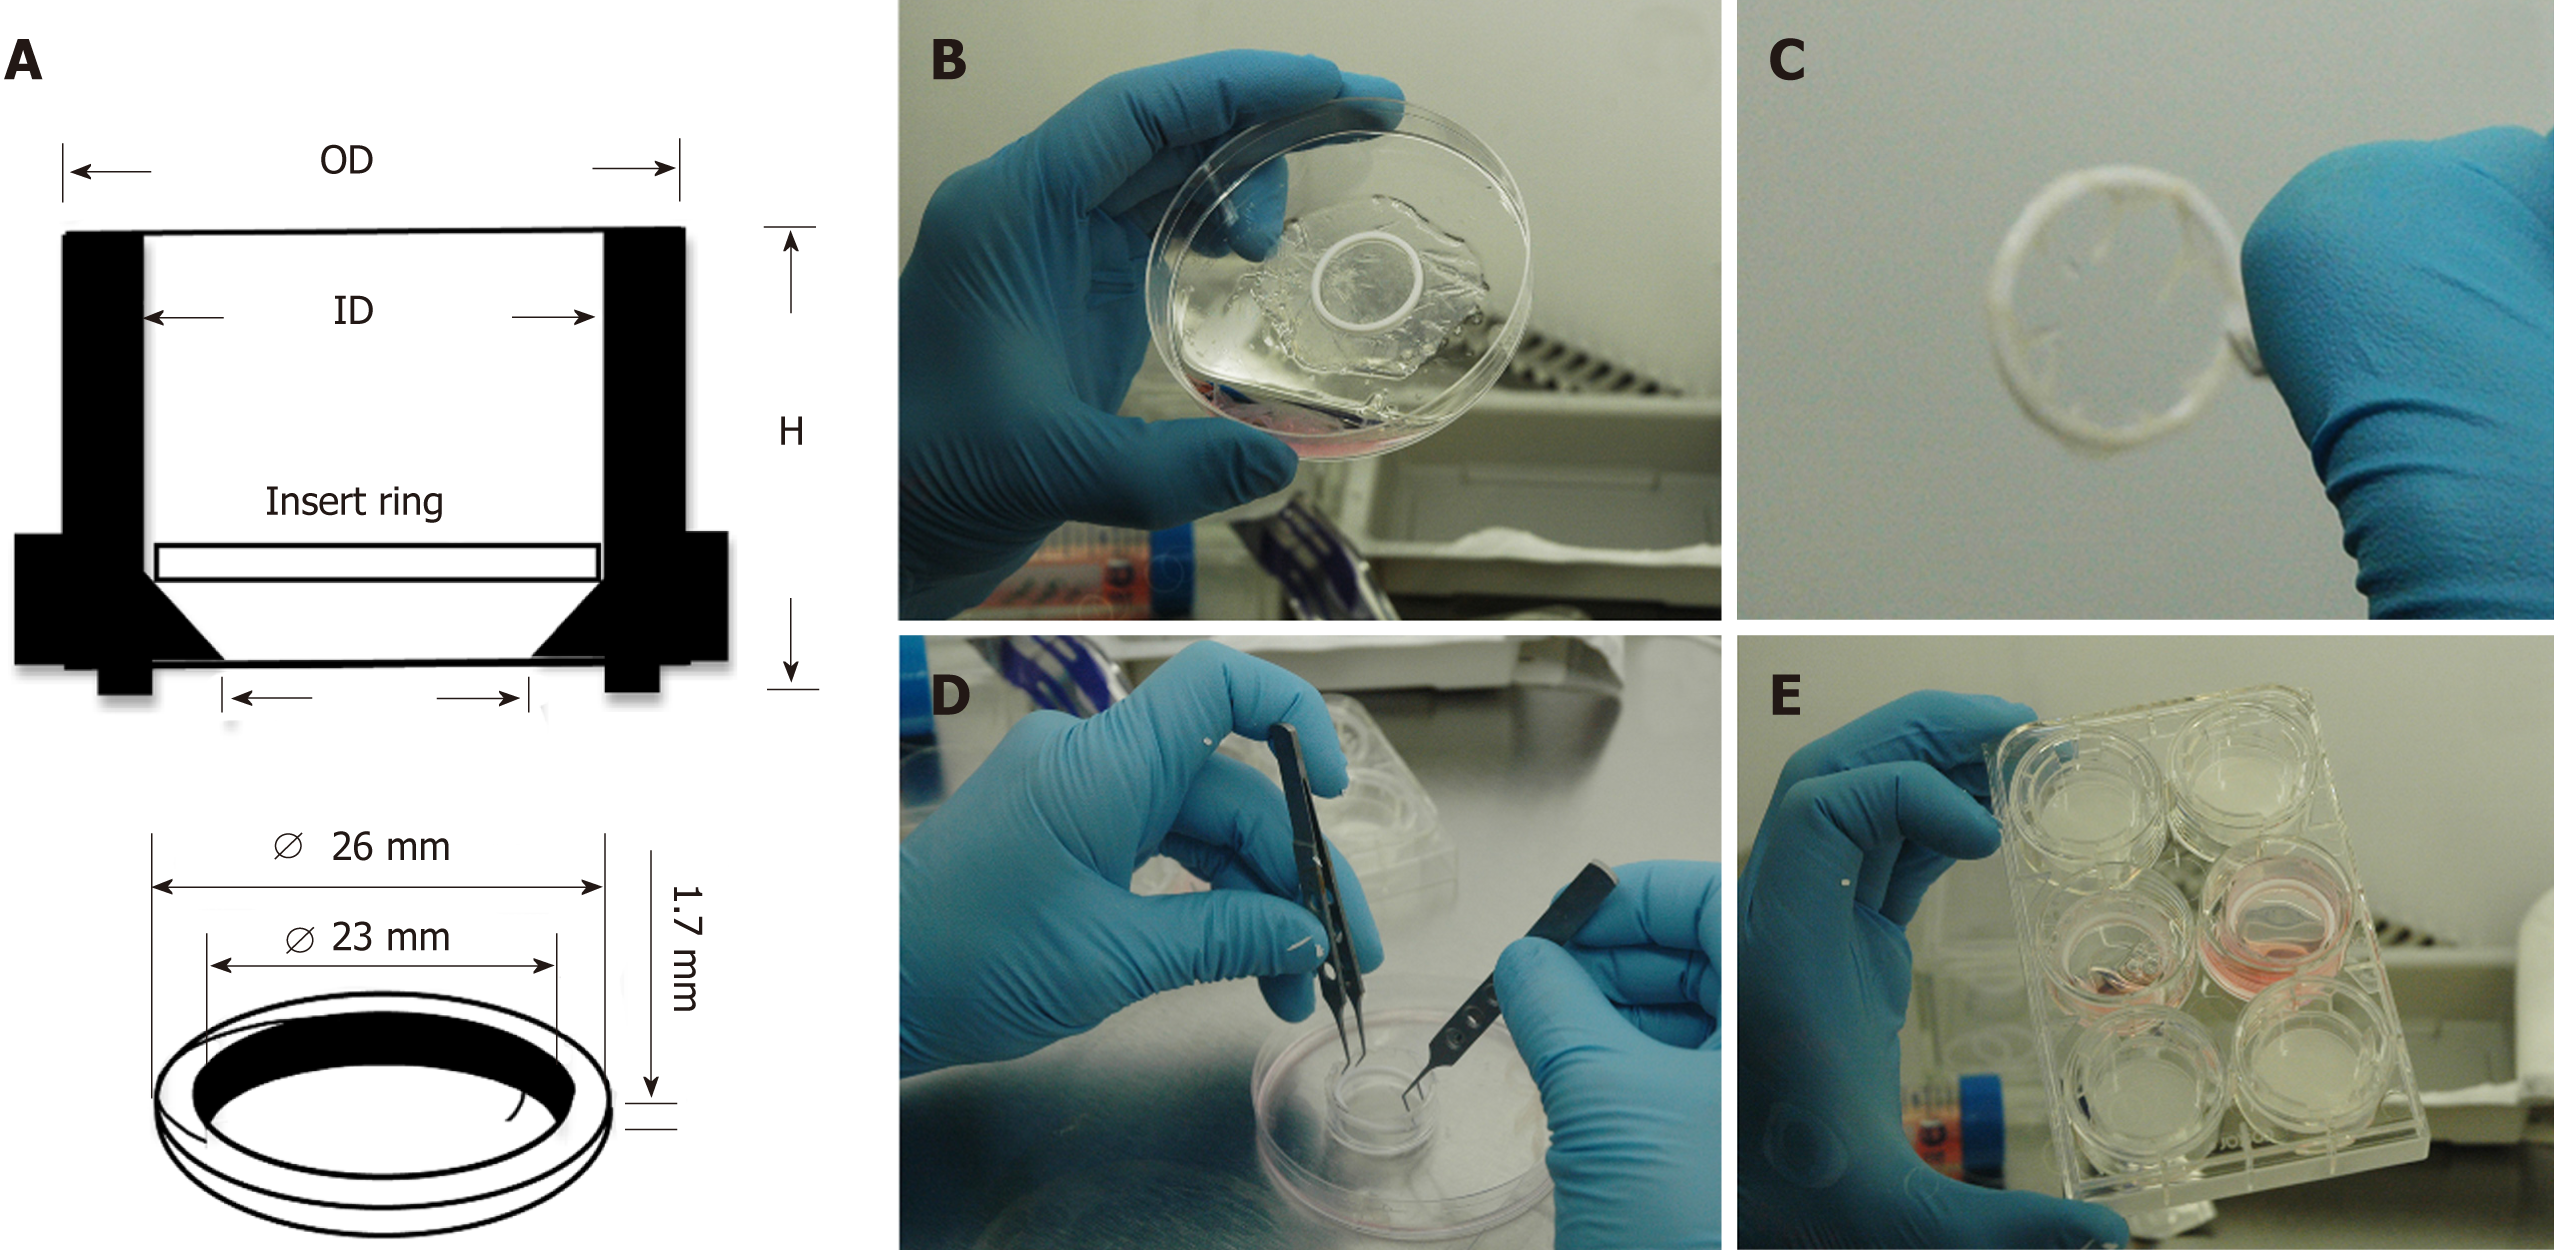
Figure 1 Culture system enabling seeding of corneal-stroma derived stem cells on amniotic membrane.
A: Schematic showing dimensions and arrangement of polytetrafluoroethylene (PTFE) O-ring inside 30 mm tissue culture insert; B: The PTFE ring is placed on the epithelial side of hydrated amniotic membrane (AM); C: The AM is firmly wrapped over the O-ring edges leaving a taut membrane surface for cell seeding; D: The O-ring containing the AM is placed within the tissue culture insert; E: The tissue culture insert is placed within a 6-well plate and culture medium applied.
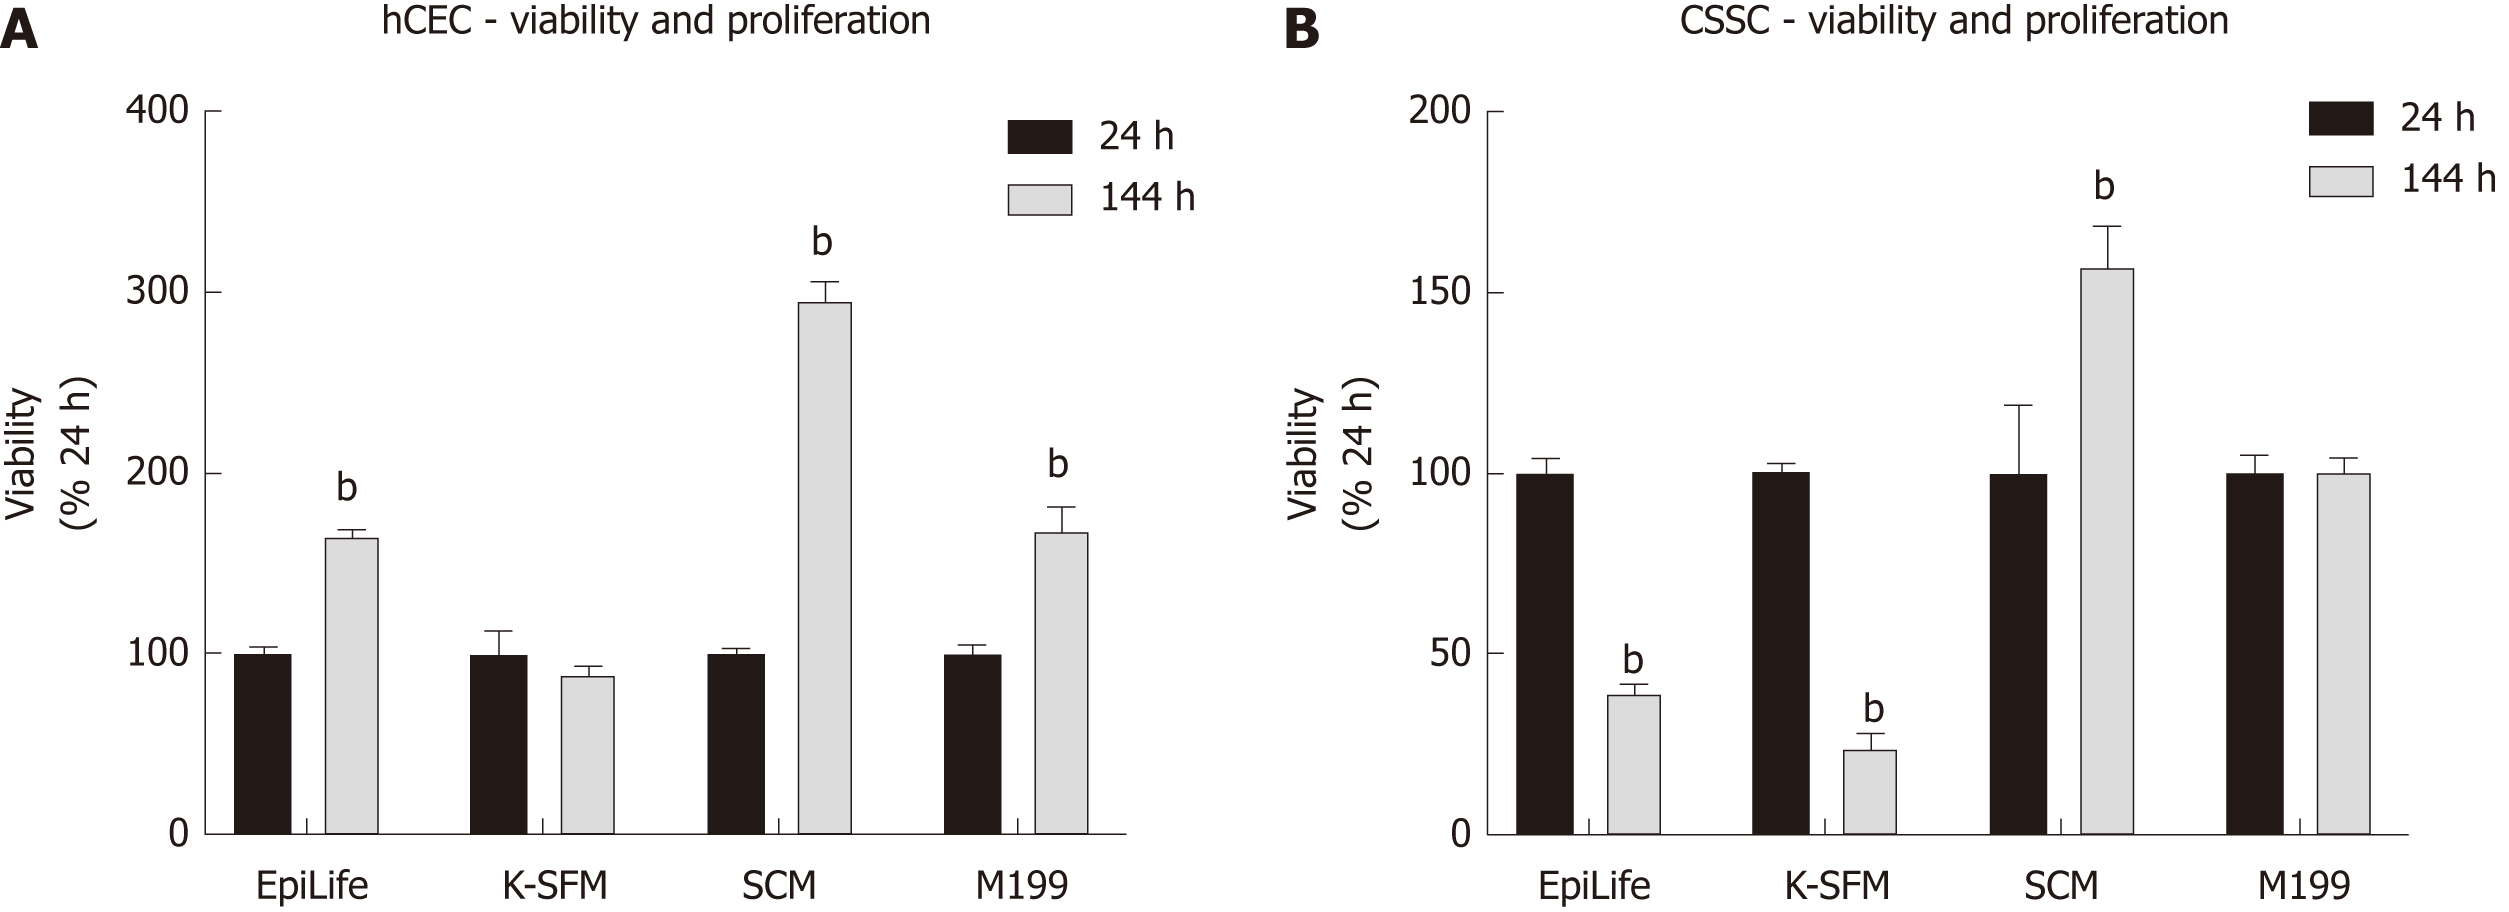
Figure 2 Effect of culture medium on human corneal epithelial cells and corneal-stroma derived stem cells viability and proliferation.
A, B: Human corneal epithelial cells (A) and corneal-stroma derived stem cells (B) were seeded in EpiLife, keratinocyte-serum free medium, stem cell medium, and M199. Presto Blue viability assay was performed at 24 h and 144 h. Each time point is represented relative to the viability in that media type at 24 h. Data shown as mean ± SEM of six replicates (n = 6) each with 3 samples. Statistical significance compared to 24 h, analysed by two-way ANOVA, represented by bP ≤ 0.0001. CSSC: Corneal-stroma derived stem cells; hCEC: Human corneal epithelial cells; K-SFM: Keratinocyte-serum free medium; SCM: Stem cell medium.
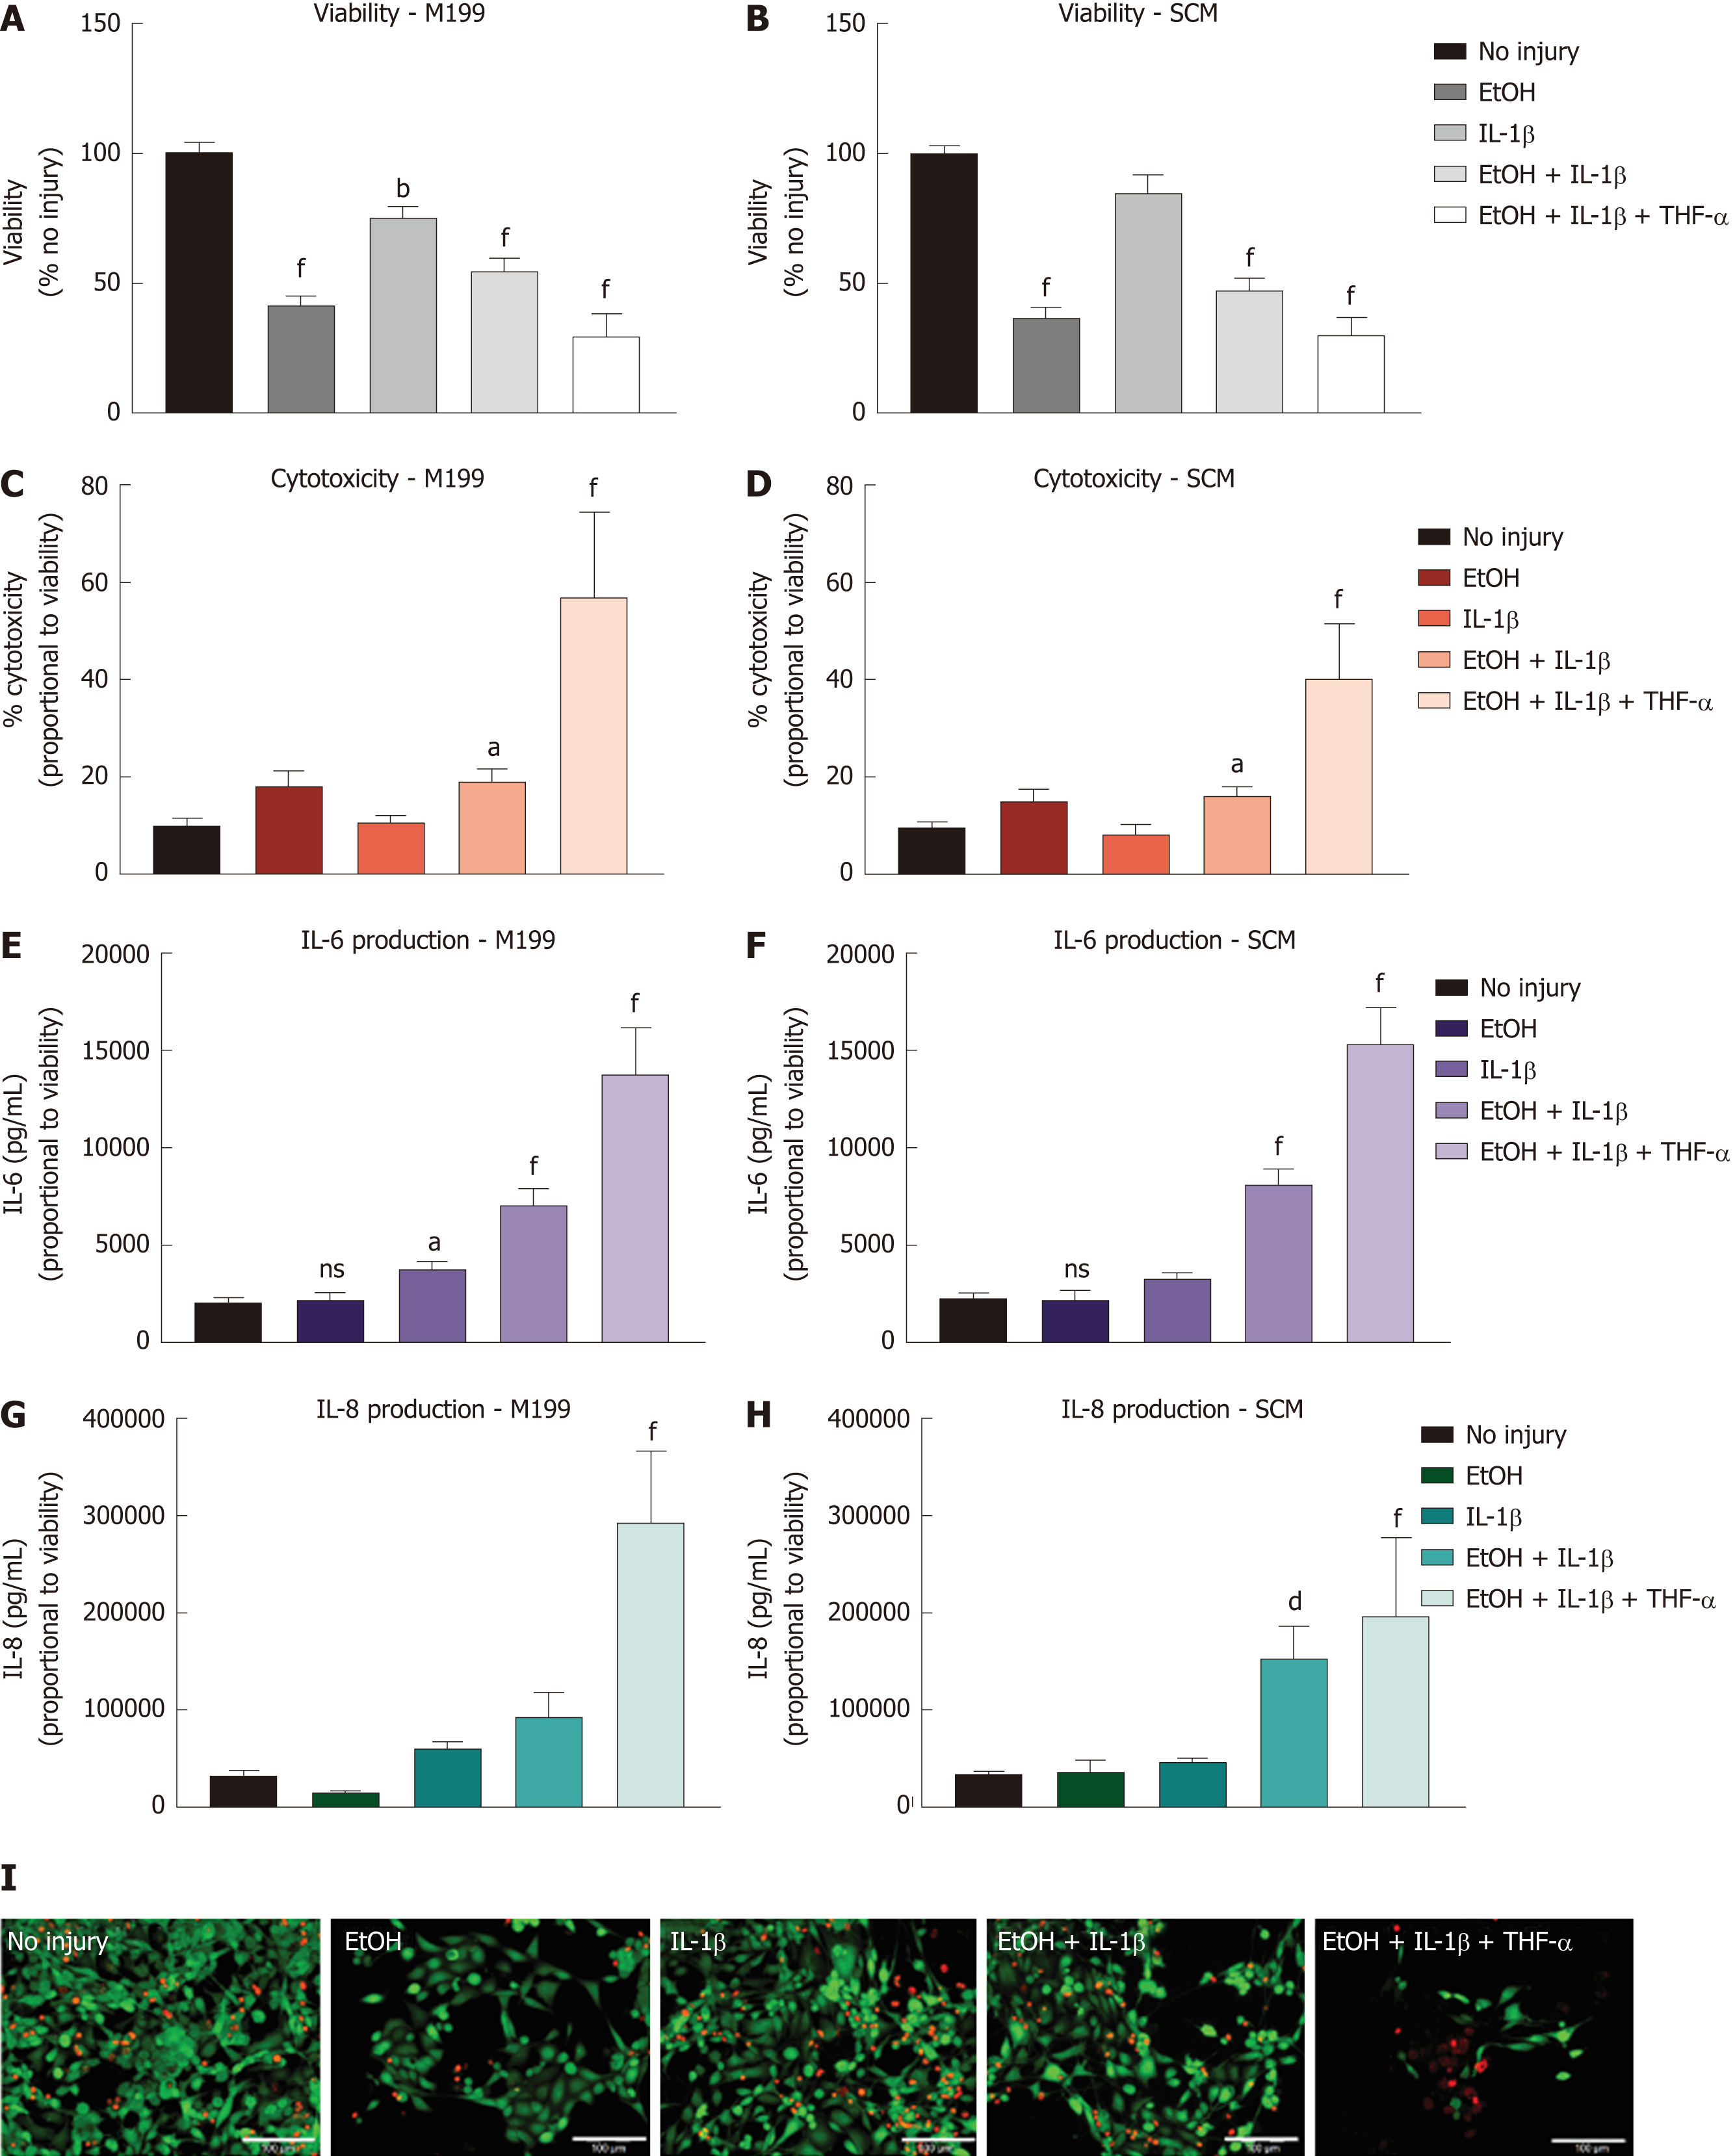
Figure 3 Injury model optimisation for human corneal epithelial cells.
Injury model optimisation was performed with human corneal epithelial cells (hCEC) cultured in both M199 (A, C, E, G) and stem cell medium (B, D, F, H). Injuries consisted of the following treatments: 20% (v/v) ethanol (EtOH); 1 ng/mL interleukin (IL)-1β in the medium; 20% (v/v) EtOH with 1 ng/mL IL-1β in the medium; and 20% (v/v) EtOH with 1 ng/mL IL-1β and 10 ng/mL TNF-α in the medium. A, B: PrestoBlue viability assay performed 72 h after the different treatments. Data represented relative to reading for no injury control; C, D: LDH assay performed on supernatant 72 h after injury. Data displayed as percentage cytotoxicity and relative to cell viability; E, F: Concentration of IL-6 in the supernatant 72 h after injury. Data displayed relative to cell viability; G, H: Concentration of IL-8 in the supernatant 72 h after injury. Data displayed relative to cell viability. Data for all graphs shown as mean ± SEM of five independent experiments, with three to six replicates each. Statistical significance compared to no injury controls analysed by one-way ANOVA represented by aP ≤ 0.05, bP ≤ 0.01, dP ≤ 0.001, fP ≤ 0.0001; I: LIVE/DEAD staining performed on hCEC cultured in stem cell medium for hCEC untreated control (A), 20% (v/v) EtOH (B), 1 ng/mL IL-1β (C), EtOH + 1 ng/mL IL-1β (D), EtOH + 10 ng/mL IL-1β (E), and EtOH+ 1 ng/mL IL-1β + 10 ng/mL TNF-α (F). Live staining (green) is shown with FITC, and dead staining (red) is shown with TRITC. Scale bar = 100 µm. hCEC: Human corneal epithelial cells; IL: Interleukin; SCM: Stem cell medium; TNF: Tumour necrosis factor.
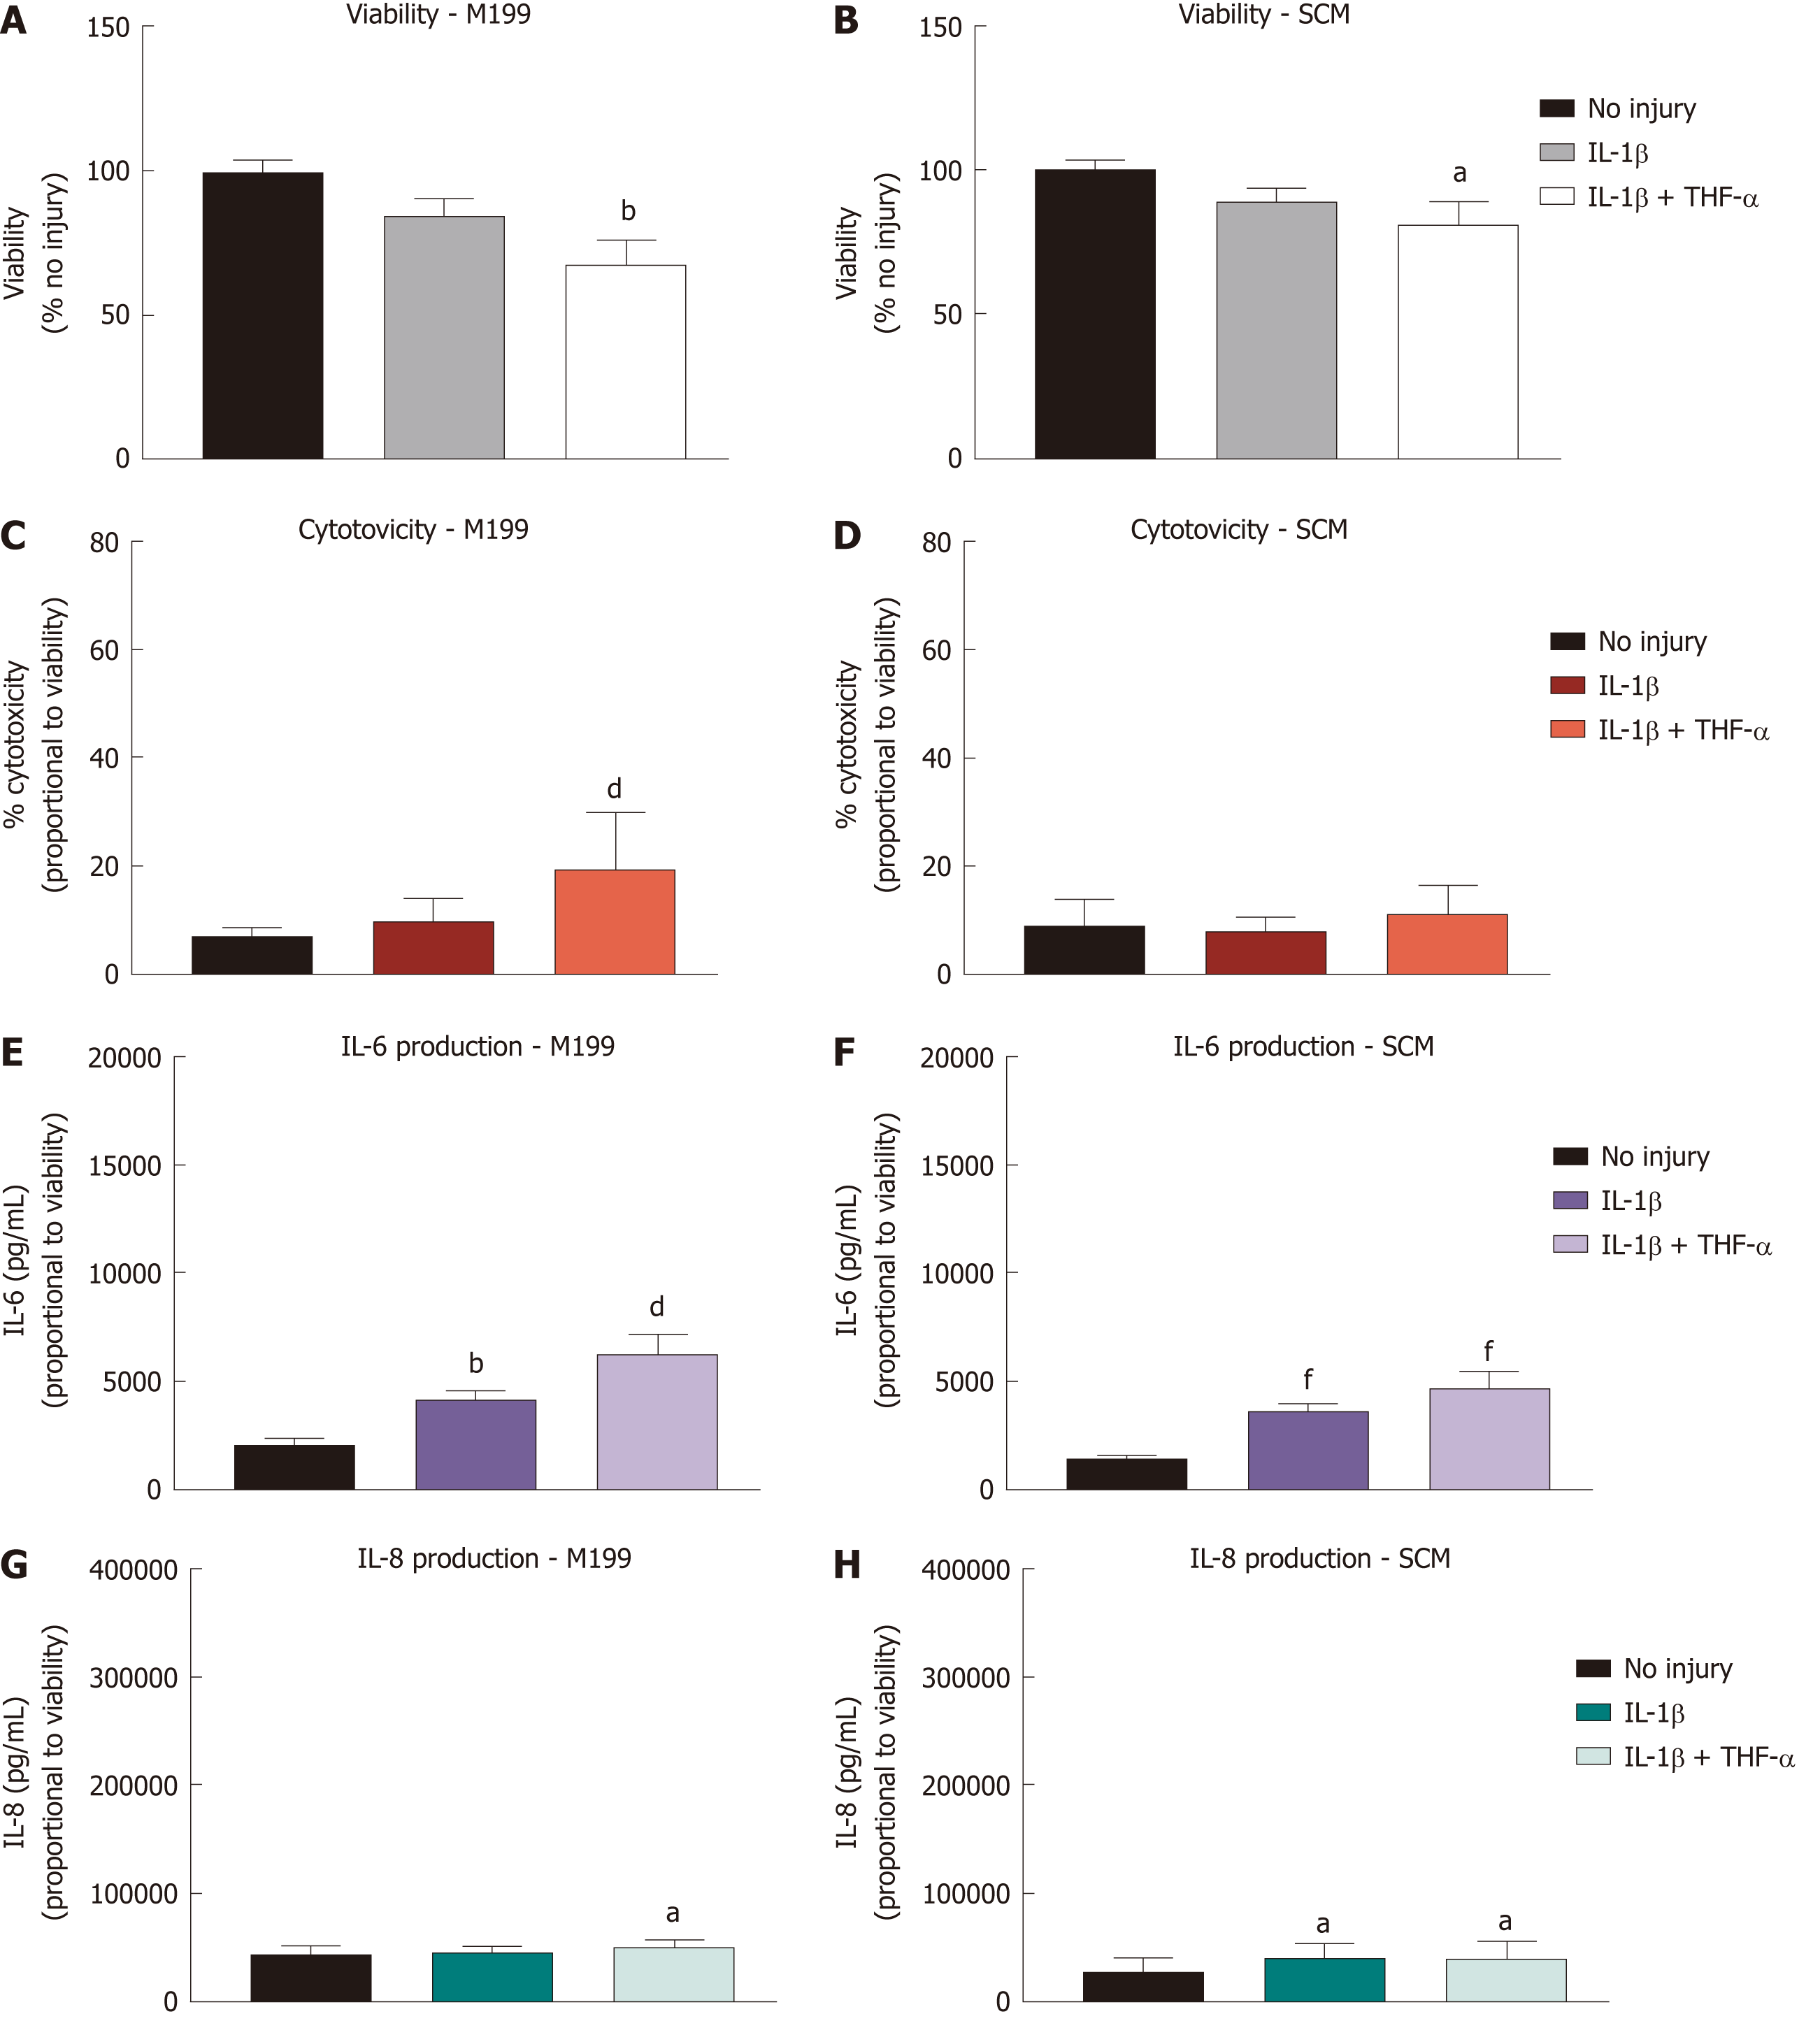
Figure 4 Effect of treatment with pro-inflammatory cytokines on corneal-stroma derived stem cells.
Treatment of corneal-stroma derived stem cells cultured in stem cell medium or M199 with 1 ng/mL IL-1β with/without 10 ng/mL tumour necrosis factor-α was performed for 72 h. A: PrestoBlue viability assay after 72 h stimulation. Data represented relative to reading for no injury control; B: Lactate dehydrogenase cytotoxicity assay performed on cell supernatants after 72 h treatment. Data displayed as percentage cytotoxicity and relative to cell viability; C: Concentration of IL-6 in the supernatant 72 h after injury. Data displayed relative to cell viability; D: Concentration of IL-8 in the supernatant 72 h after injury. Data displayed relative to cell viability. Data for all graphs shown as mean ± SEM of five independent experiments with three to six replicates each. Statistical significance compared to no injury controls analysed by one-way ANOVA represented by aP ≤ 0.05, bP ≤ 0.01, dP ≤ 0.001, fP ≤ 0.0001. IL: Interleukin; TNF: Tumour necrosis factor; SCM: Stem cell medium.
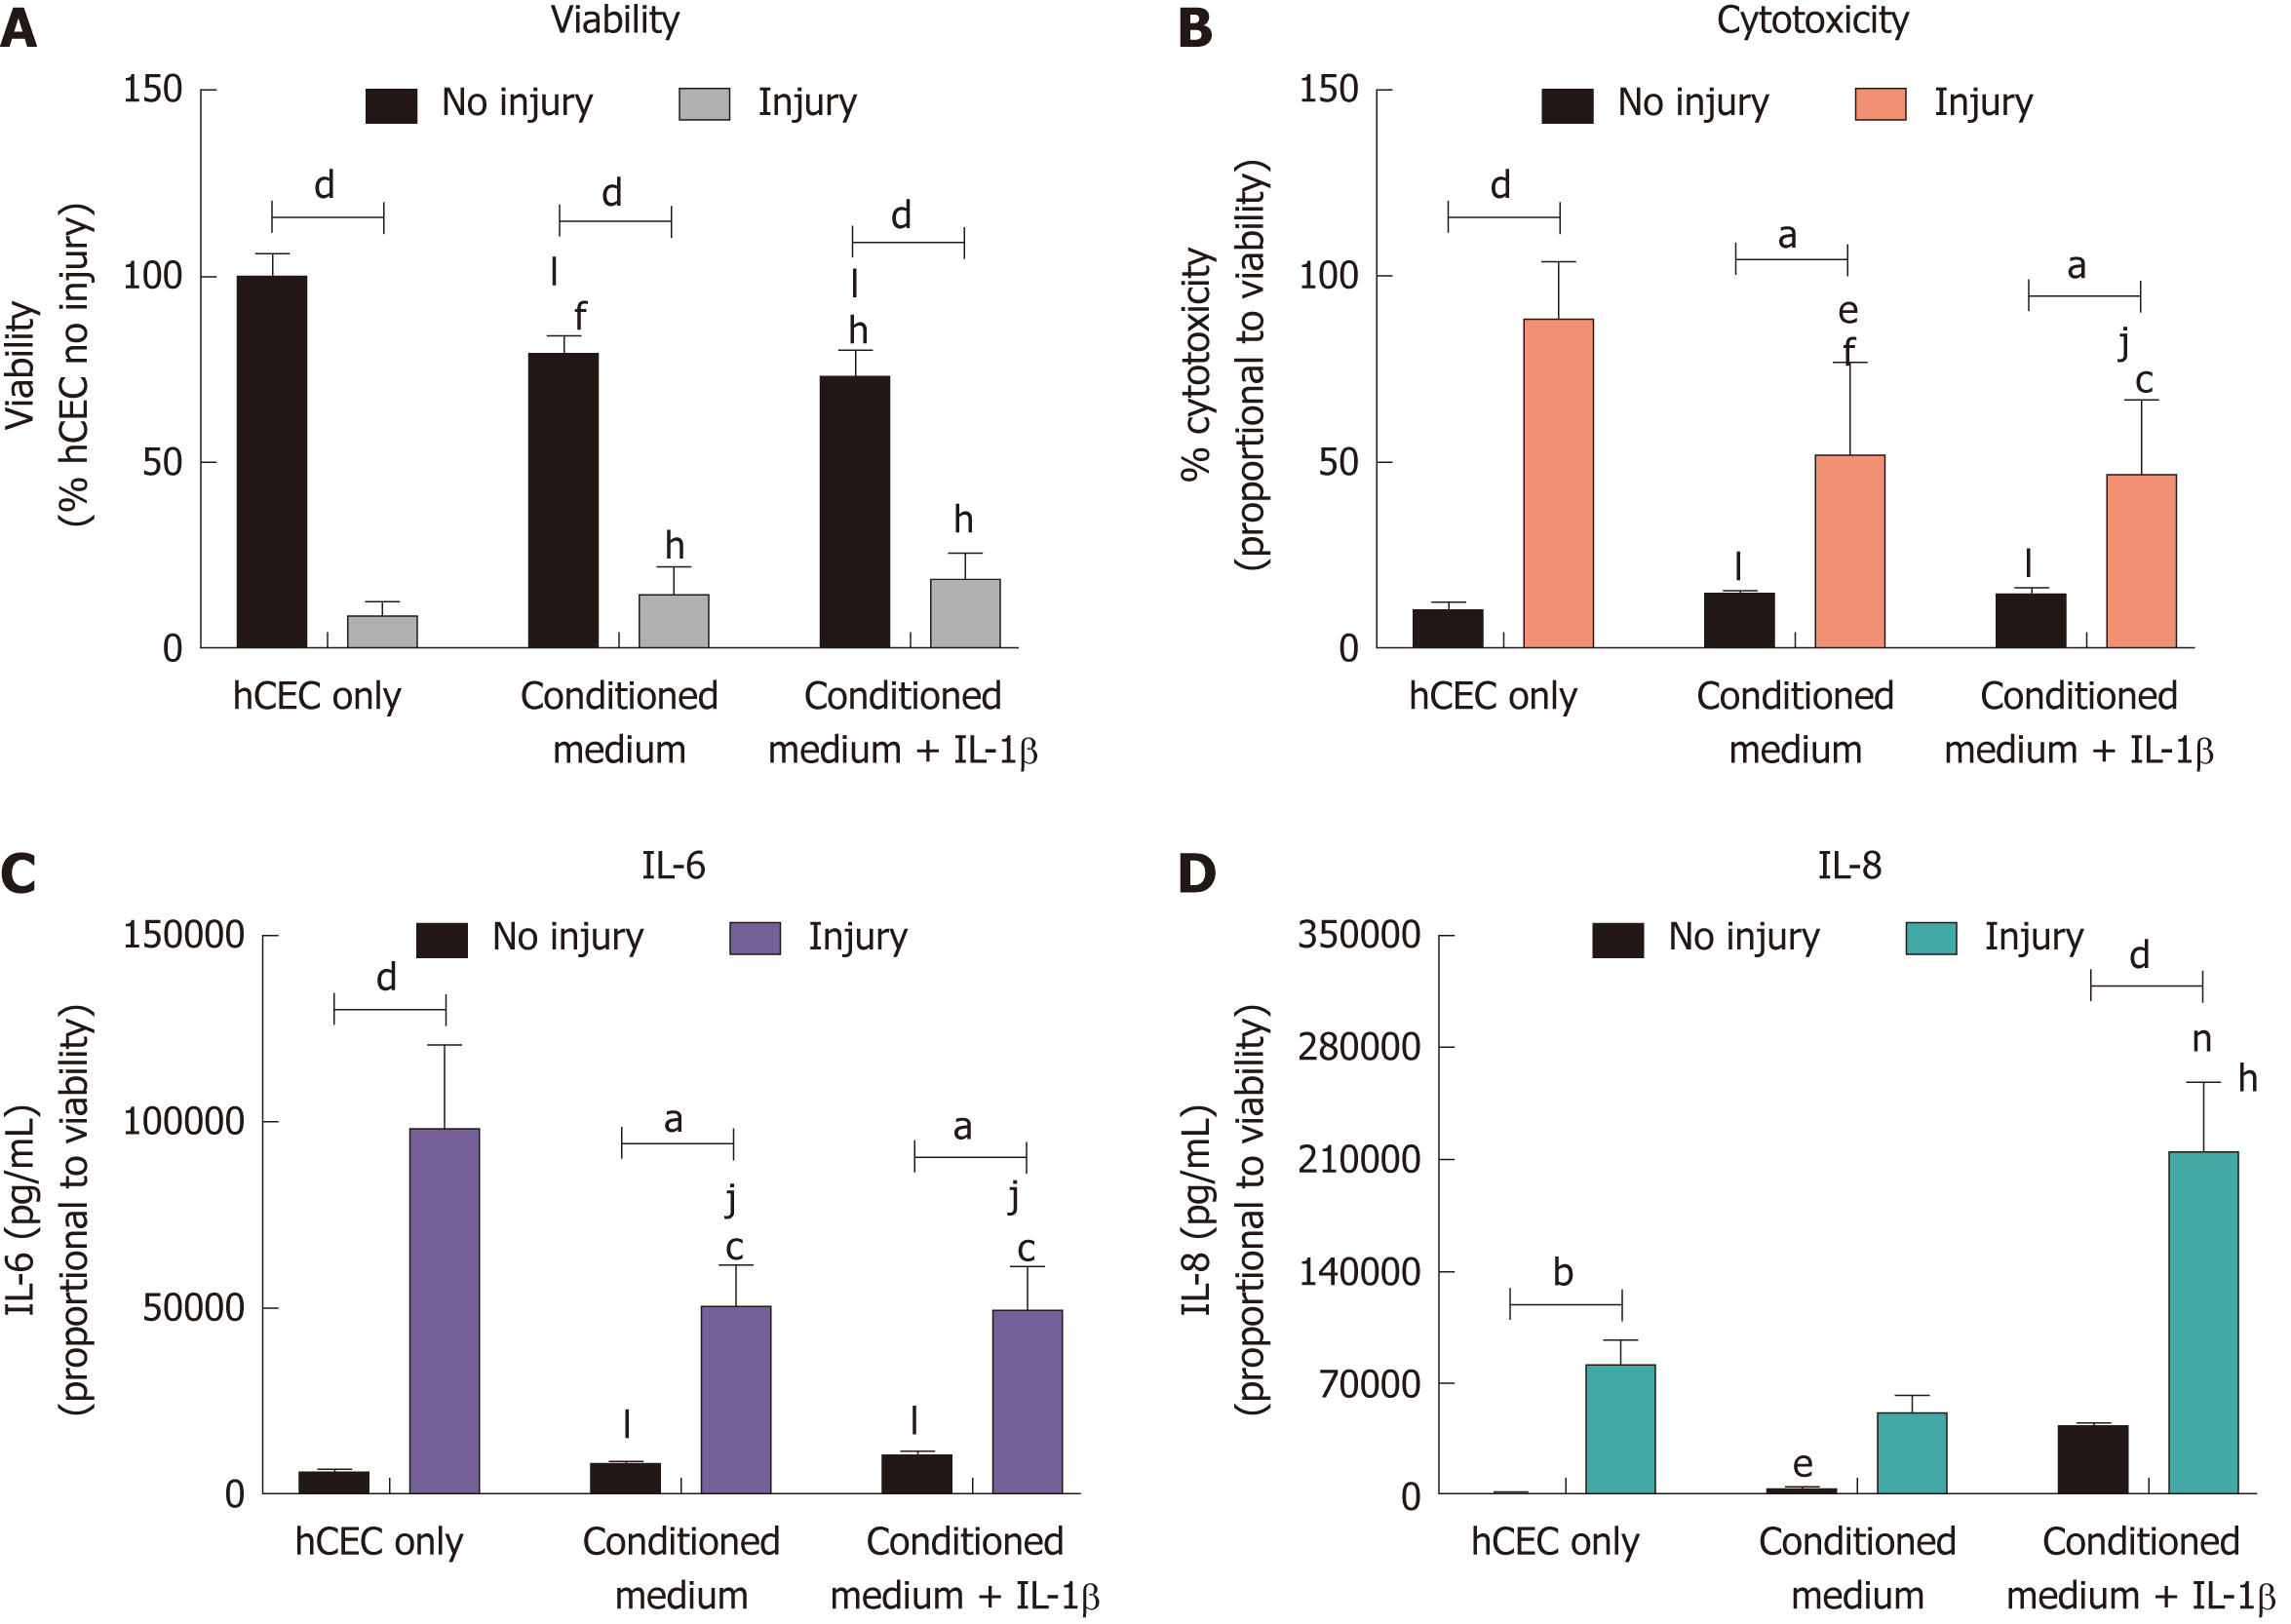
Figure 5 Effect of corneal-stroma derived stem cells-conditioned medium on human corneal epithelial cells treated with the injury model.
Human corneal epithelial cells (hCEC) were treated with an injury model consisting of 30 s ethanol treatment followed by stimulation with 1 ng/mL IL-1β for 72 h. Medium conditioned by corneal-stroma derived stem cells with and without pre-treatment with IL-1β was applied to the hCEC after ethanol treatment during stimulation with IL-1β. A: PrestoBlue viability assay after 72 h. Data represented relative to reading for hCEC no injury control; B: Lactate dehydrogenase cytotoxicity assay performed on cell supernatants after 72 h treatment. Data displayed as percentage cytotoxicity and relative to cell viability; C: Concentration of IL-6 in the supernatant 72 h after injury. Data displayed relative to cell viability; D: Concentration of IL-8 in the supernatant 72 h after injury. Data displayed relative to cell viability. Data shown as mean ± SEM of three independent experiments with four to six replicates each. Statistical significance analysed by two-way ANOVA. Significance compared to non-injured, same treatment represented by aP ≤ 0.05, bP ≤ 0.01, dP ≤ 0.0001. Significance compared to hCEC, no injury represented by cP ≤ 0.05, fP ≤ 0.01, hP ≤ 0.0001. Significance compared to hCEC, injury represented by eP ≤ 0.05, jP ≤ 0.01, nP ≤ 0.001, lP ≤ 0.0001. hCEC: Human corneal epithelial cells; IL: Interleukin.
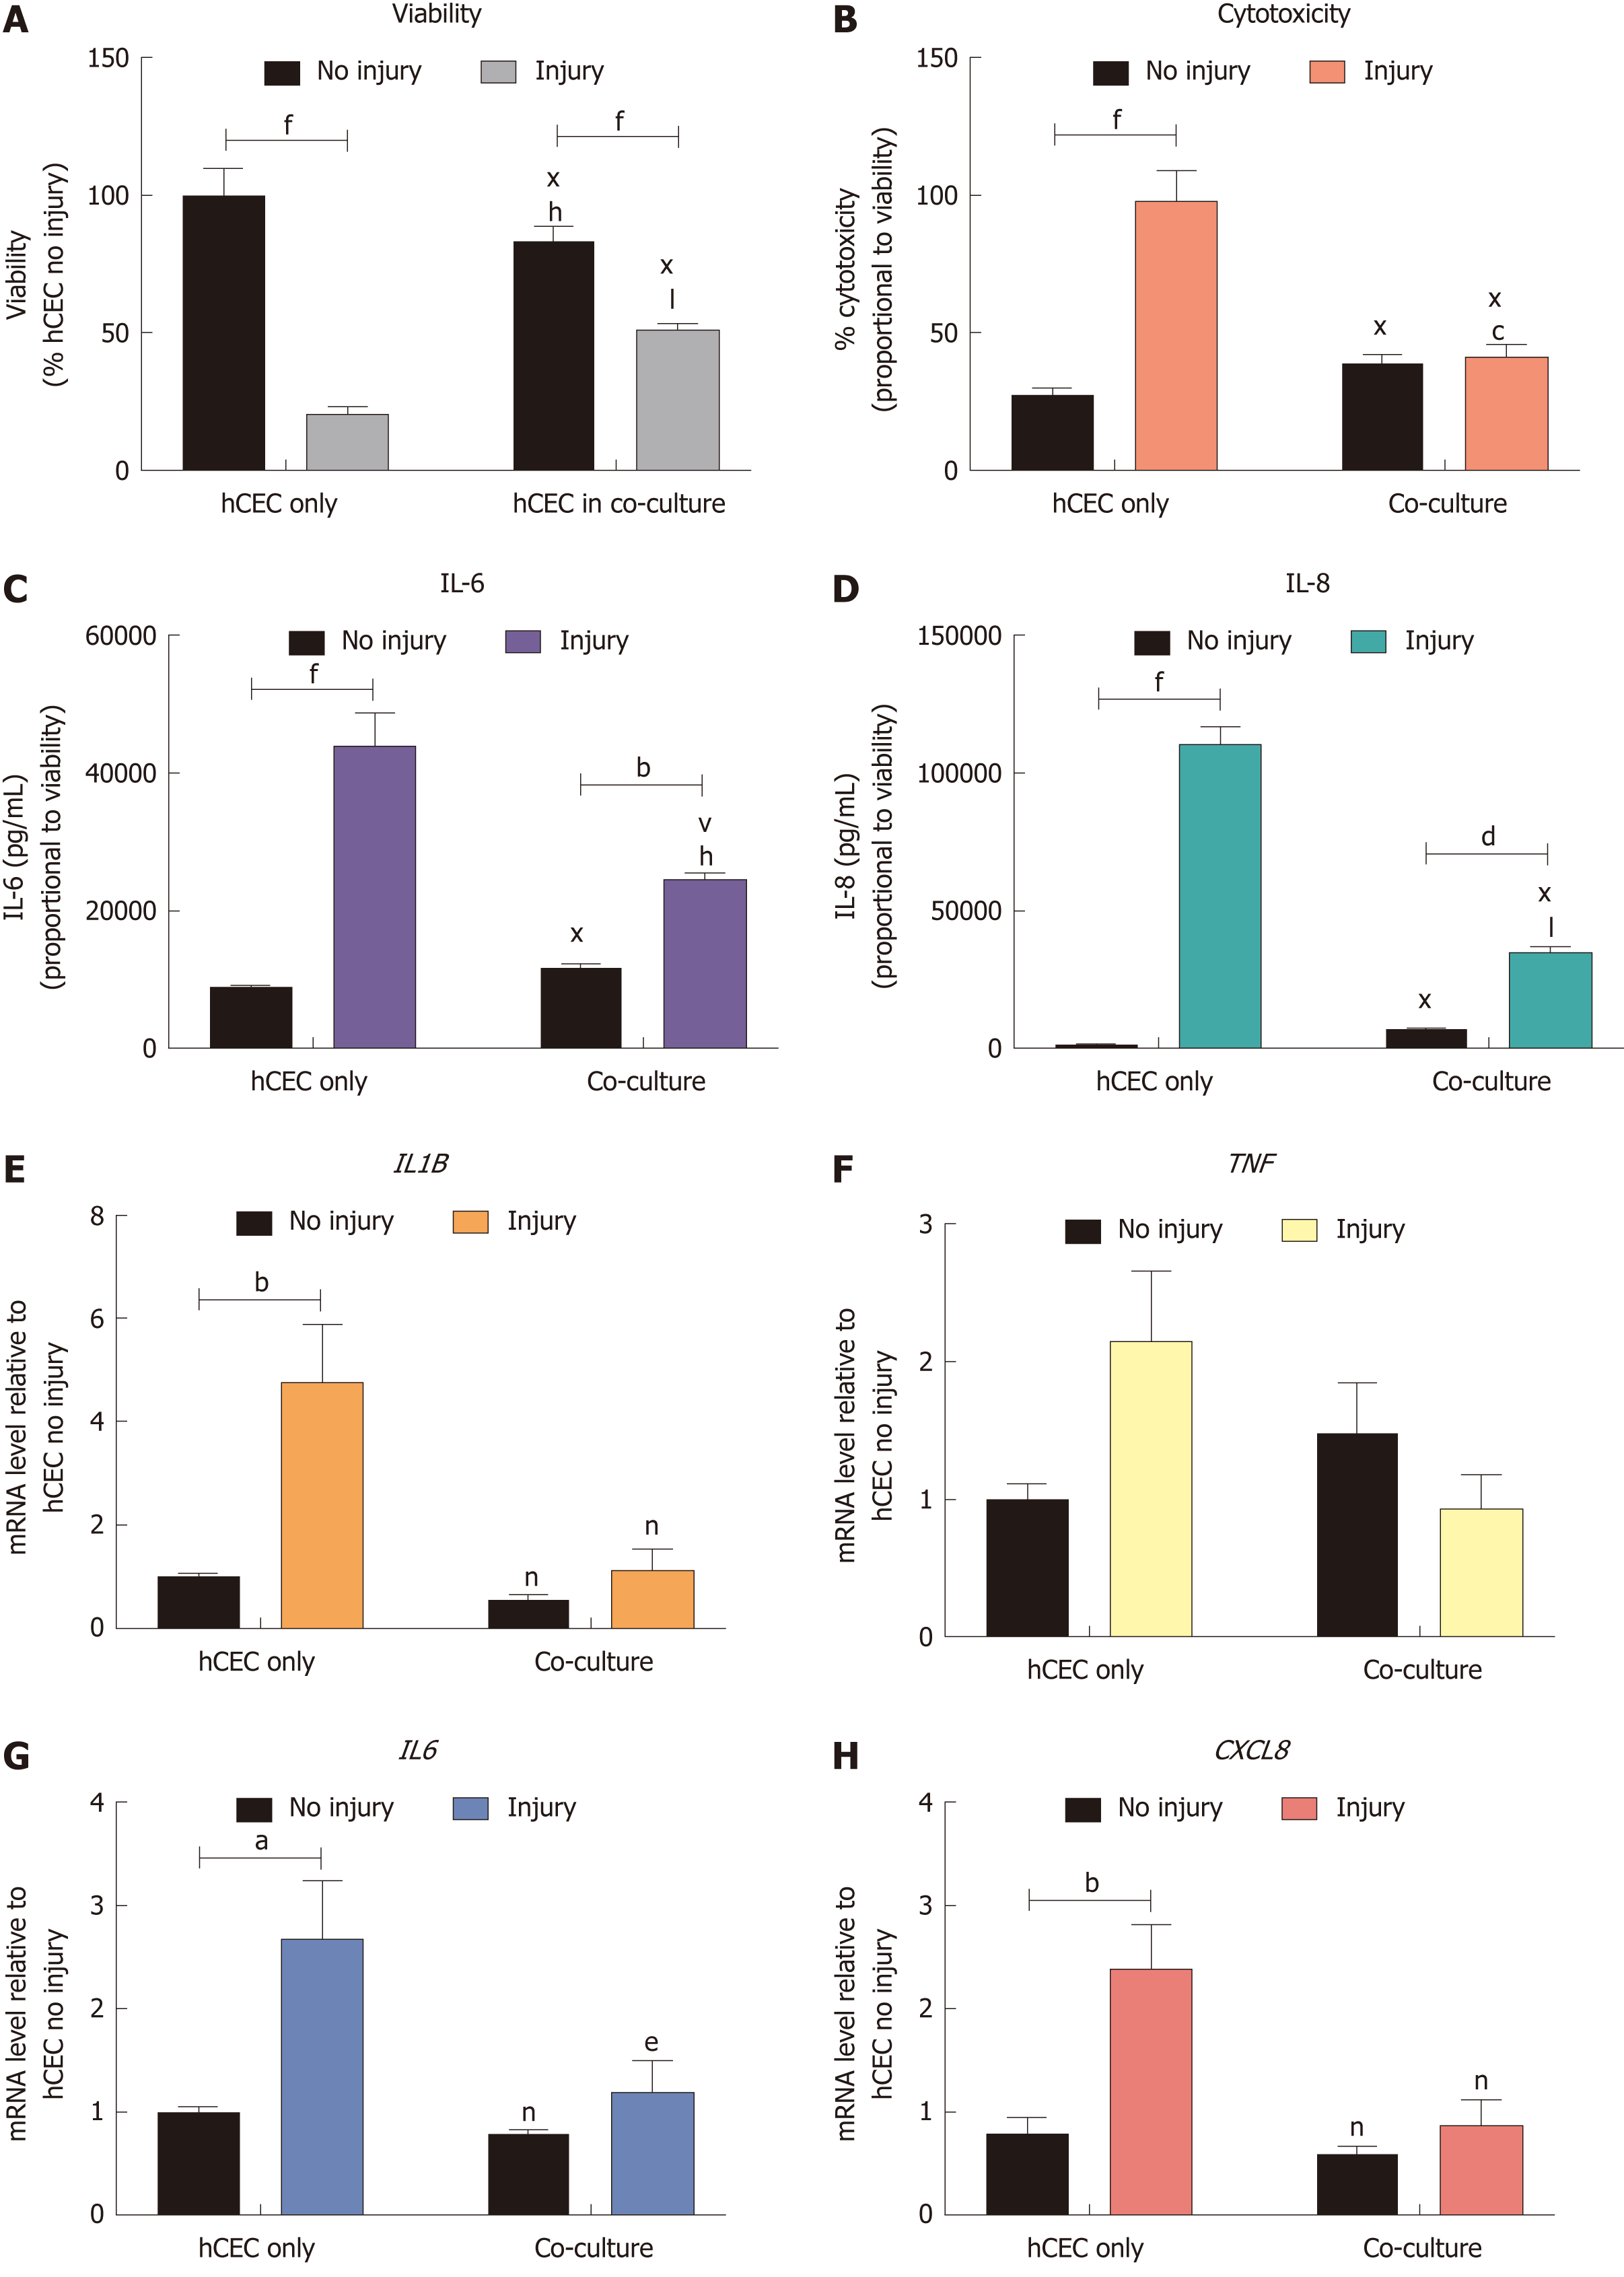
Figure 6 Effect of co-culture with corneal-stroma derived stem cells on human corneal epithelial cells response after injury.
Human corneal epithelial cells (hCEC) were treated with an injury model consisting of 30 s ethanol treatment followed by stimulation with 1 ng/mL IL-1β for 72 h. During IL-1β stimulation corneal-stroma derived stem cells (CSSC) were co-cultured with CSSC in a transwell system. A: PrestoBlue viability assay after 72 h. Data represented relative to reading for hCEC only, no injury control; B: Lactate dehydrogenase cytotoxicity assay performed on cell supernatants after 72 h treatment. Data displayed as percentage cytotoxicity and relative to cell viability; C: Concentration of IL-6 in the supernatant 72 h after injury. Data displayed relative to cell viability; D: Concentration of IL-8 in the supernatant 72 h after injury. Data displayed relative to cell viability; E-H: RT-qPCR performed to show mRNA expression of IL1B (E), TNF (F), IL6 (G), and CXCL8 (H). Expression of each target gene normalised to GAPDH and represented relative to hCEC only, no injury. Data for all graphs shown as mean ± SEM of three independent experiments with five replicates each. Statistical significance analysed by two-way ANOVA. Significance compared to non-injured, same group, represented by aP ≤ 0.05, bP ≤ 0.01, dP ≤ 0.001, fP ≤ 0.0001. Significance compared to hCEC only, no injury represented by cP ≤ 0.05, hP ≤ 0.01, jP ≤ 0.001, lP ≤ 0.0001. Significance compared to hCEC, injury represented by eP ≤ 0.05, nP ≤ 0.01, vP ≤ 0.001, xP ≤ 0.0001. CSSC: Corneal-stroma derived stem cells; hCEC: Human corneal epithelial cells; IL: Interleukin.
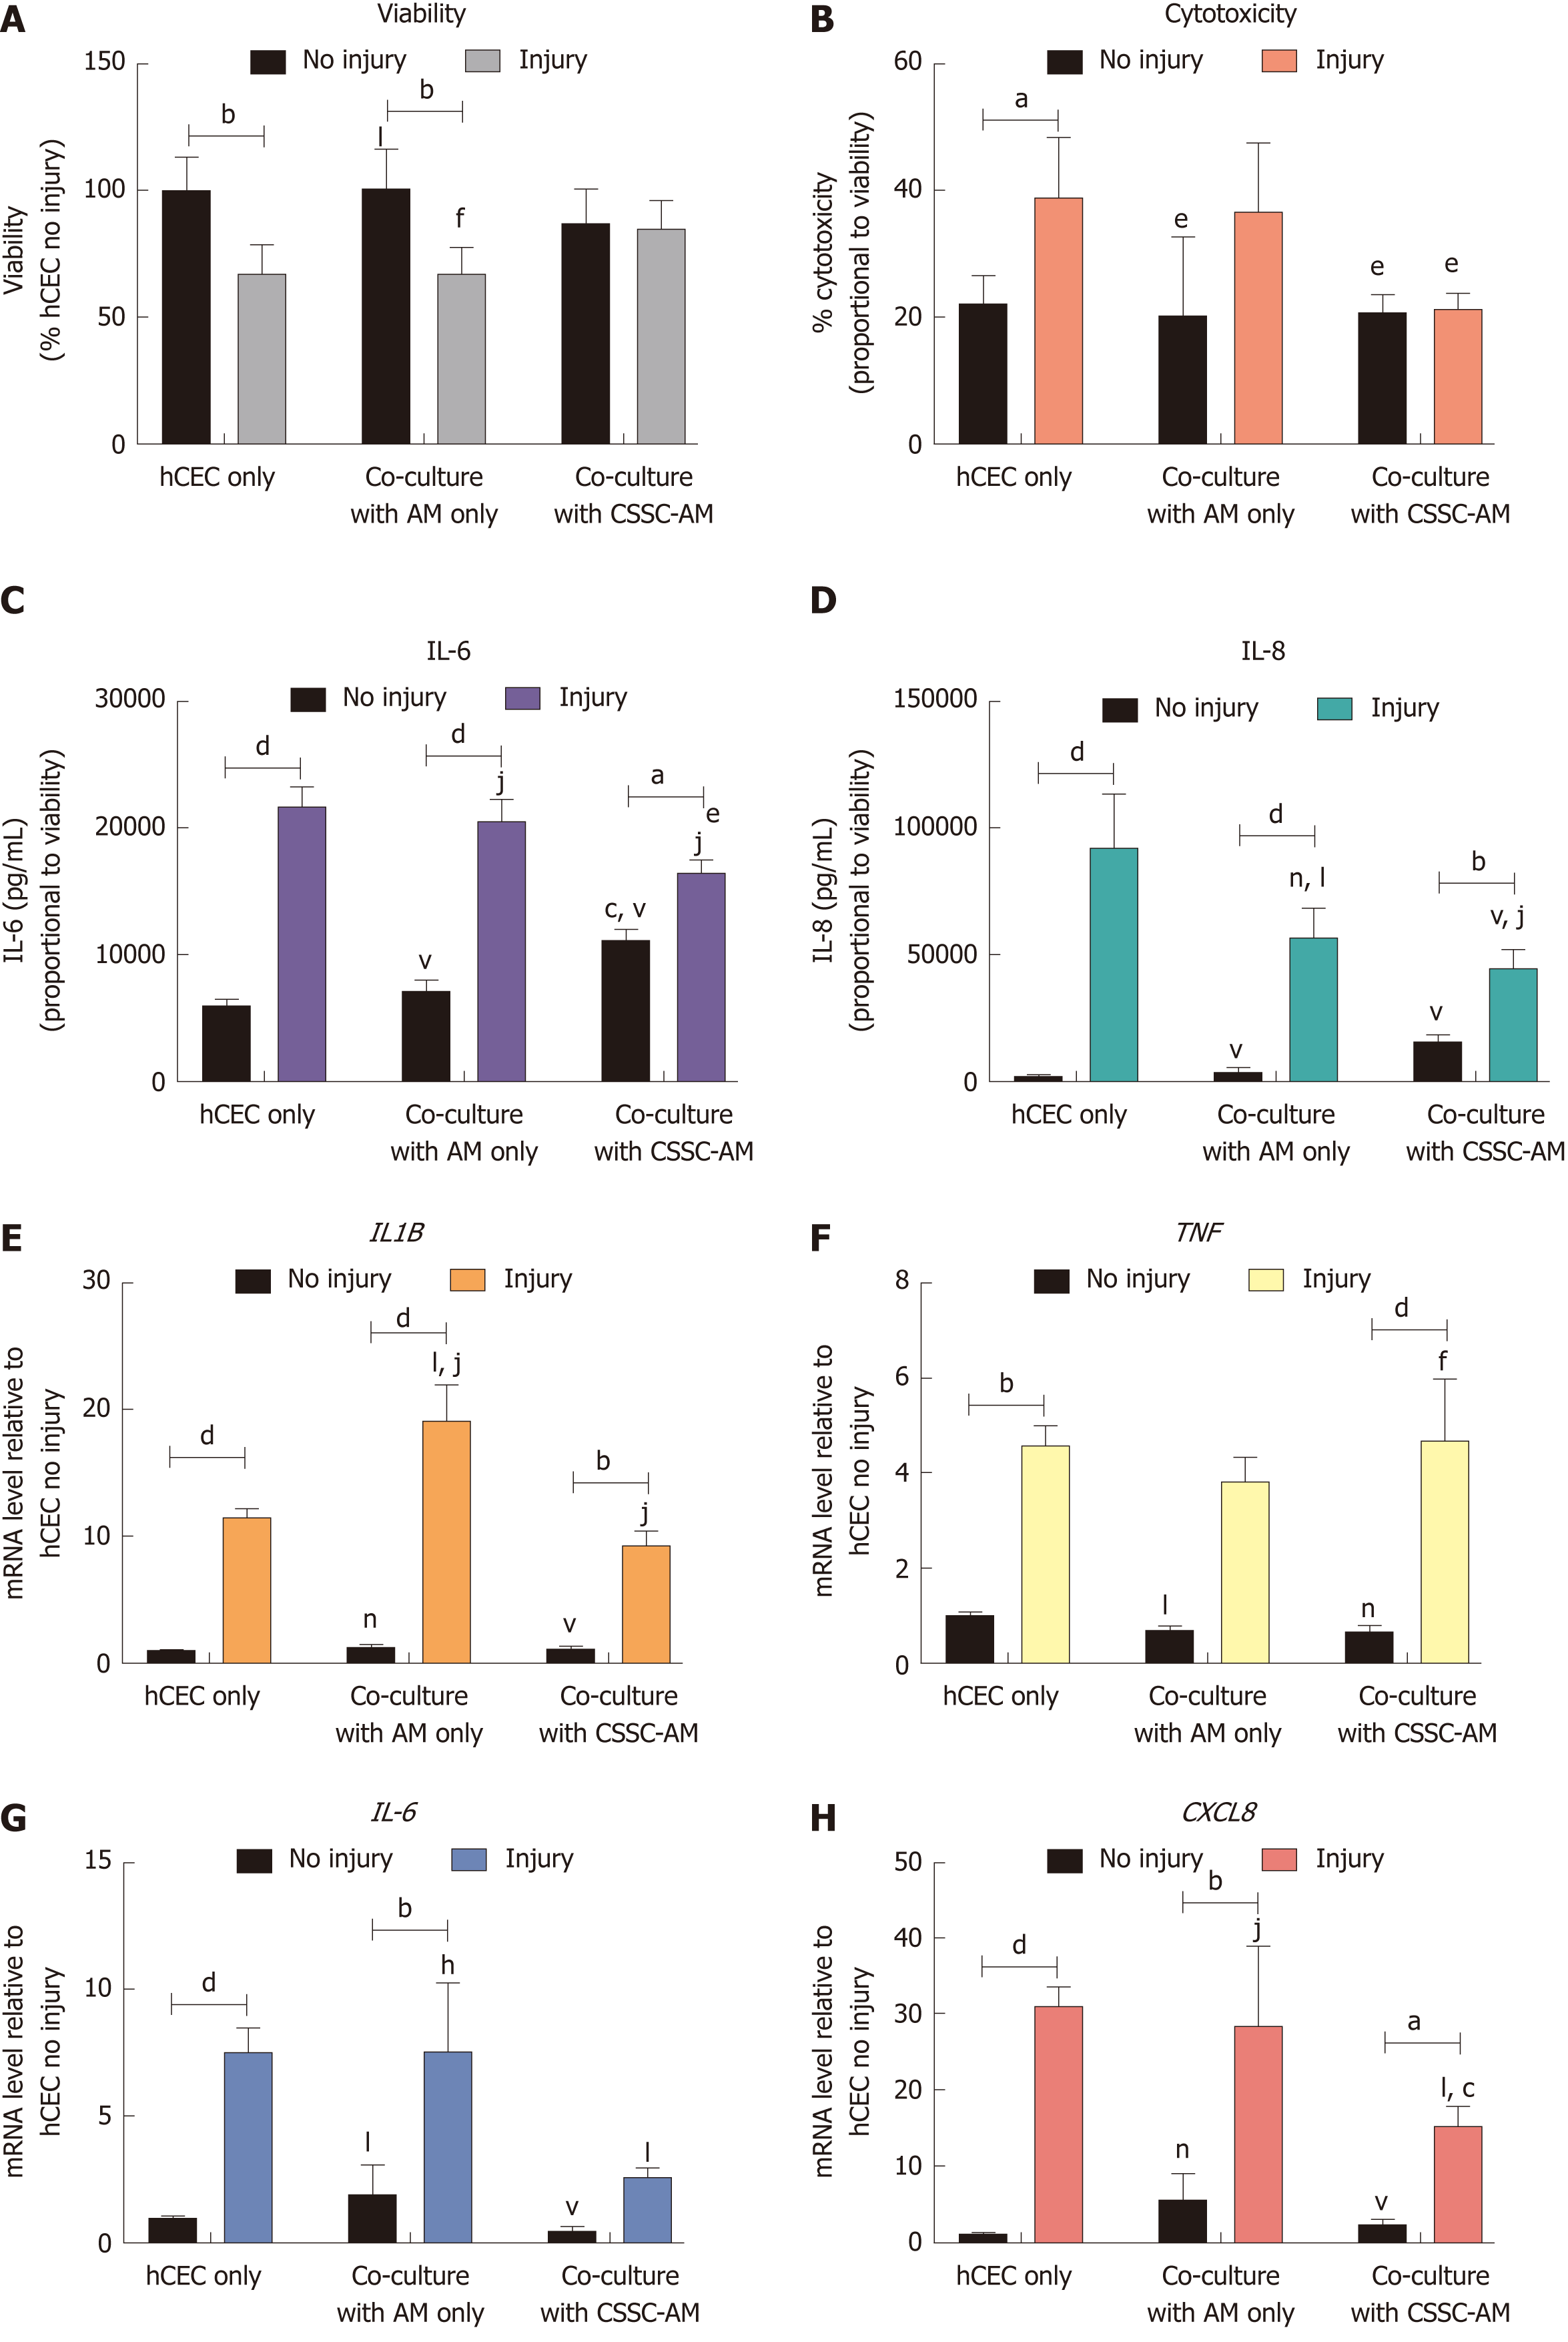
Figure 7 Effect of co-culture with corneal-stroma derived stem cells-amniotic membrane constructs on human corneal epithelial cells response after injury.
Human corneal epithelial cells (hCEC) were treated with an injury model consisting of 30 s ethanol treatment followed by stimulation with 1 ng/mL IL-1β for 72 h. During IL-1β stimulation hCEC were co-cultured with either amniotic membrane (AM) only or a corneal-stroma derived stem cells-AM construct. A: PrestoBlue viability assay after 72 h. Data represented relative to reading for hCEC only, no injury control; B: Lactate dehydrogenase cytotoxicity assay performed on cell supernatants after 72 h treatment. Data displayed as percentage cytotoxicity and relative to cell viability; C: Concentration of IL-6 in the supernatant 72 h after injury. Data displayed relative to cell viability; D: Concentration of IL-8 in the supernatant 72 h after injury. Data displayed relative to cell viability; E-H: RT-qPCR performed to show mRNA expression of IL1B (E), TNF (F), IL6 (G), and CXCL8 (H). Expression of each target gene normalised to GAPDH and represented relative to hCEC only, no injury. Data for all graphs shown as mean ± SEM of three independent experiments with five replicates each. Statistical significance analysed by two-way ANOVA. Significance compared to non-injured, same group, represented by aP ≤ 0.05, bP ≤ 0.01, dP ≤ 0.0001. Significance compared to hCEC only, no injury represented by cP ≤ 0.05, fP ≤ 0.01, hP ≤ 0.001, jP ≤ 0.0001. Significance compared to hCEC, injury represented by eP ≤ 0.05, lP ≤ 0.01, nP ≤ 0.001, vP ≤ 0.0001. AM: Amniotic membrane; CSSC: Corneal-stroma derived stem cells; hCEC: Human corneal epithelial cells; IL: Interleukin.
- Citation: Orozco Morales ML, Marsit NM, McIntosh OD, Hopkinson A, Sidney LE. Anti-inflammatory potential of human corneal stroma-derived stem cells determined by a novel in vitro corneal epithelial injury model. World J Stem Cells 2019; 11(2): 84-99
- URL: https://www.wjgnet.com/1948-0210/full/v11/i2/84.htm
- DOI: https://dx.doi.org/10.4252/wjsc.v11.i2.84


