Copyright
©The Author(s) 2019.
World J Stem Cells. Feb 26, 2019; 11(2): 84-99
Published online Feb 26, 2019. doi: 10.4252/wjsc.v11.i2.84
Published online Feb 26, 2019. doi: 10.4252/wjsc.v11.i2.84
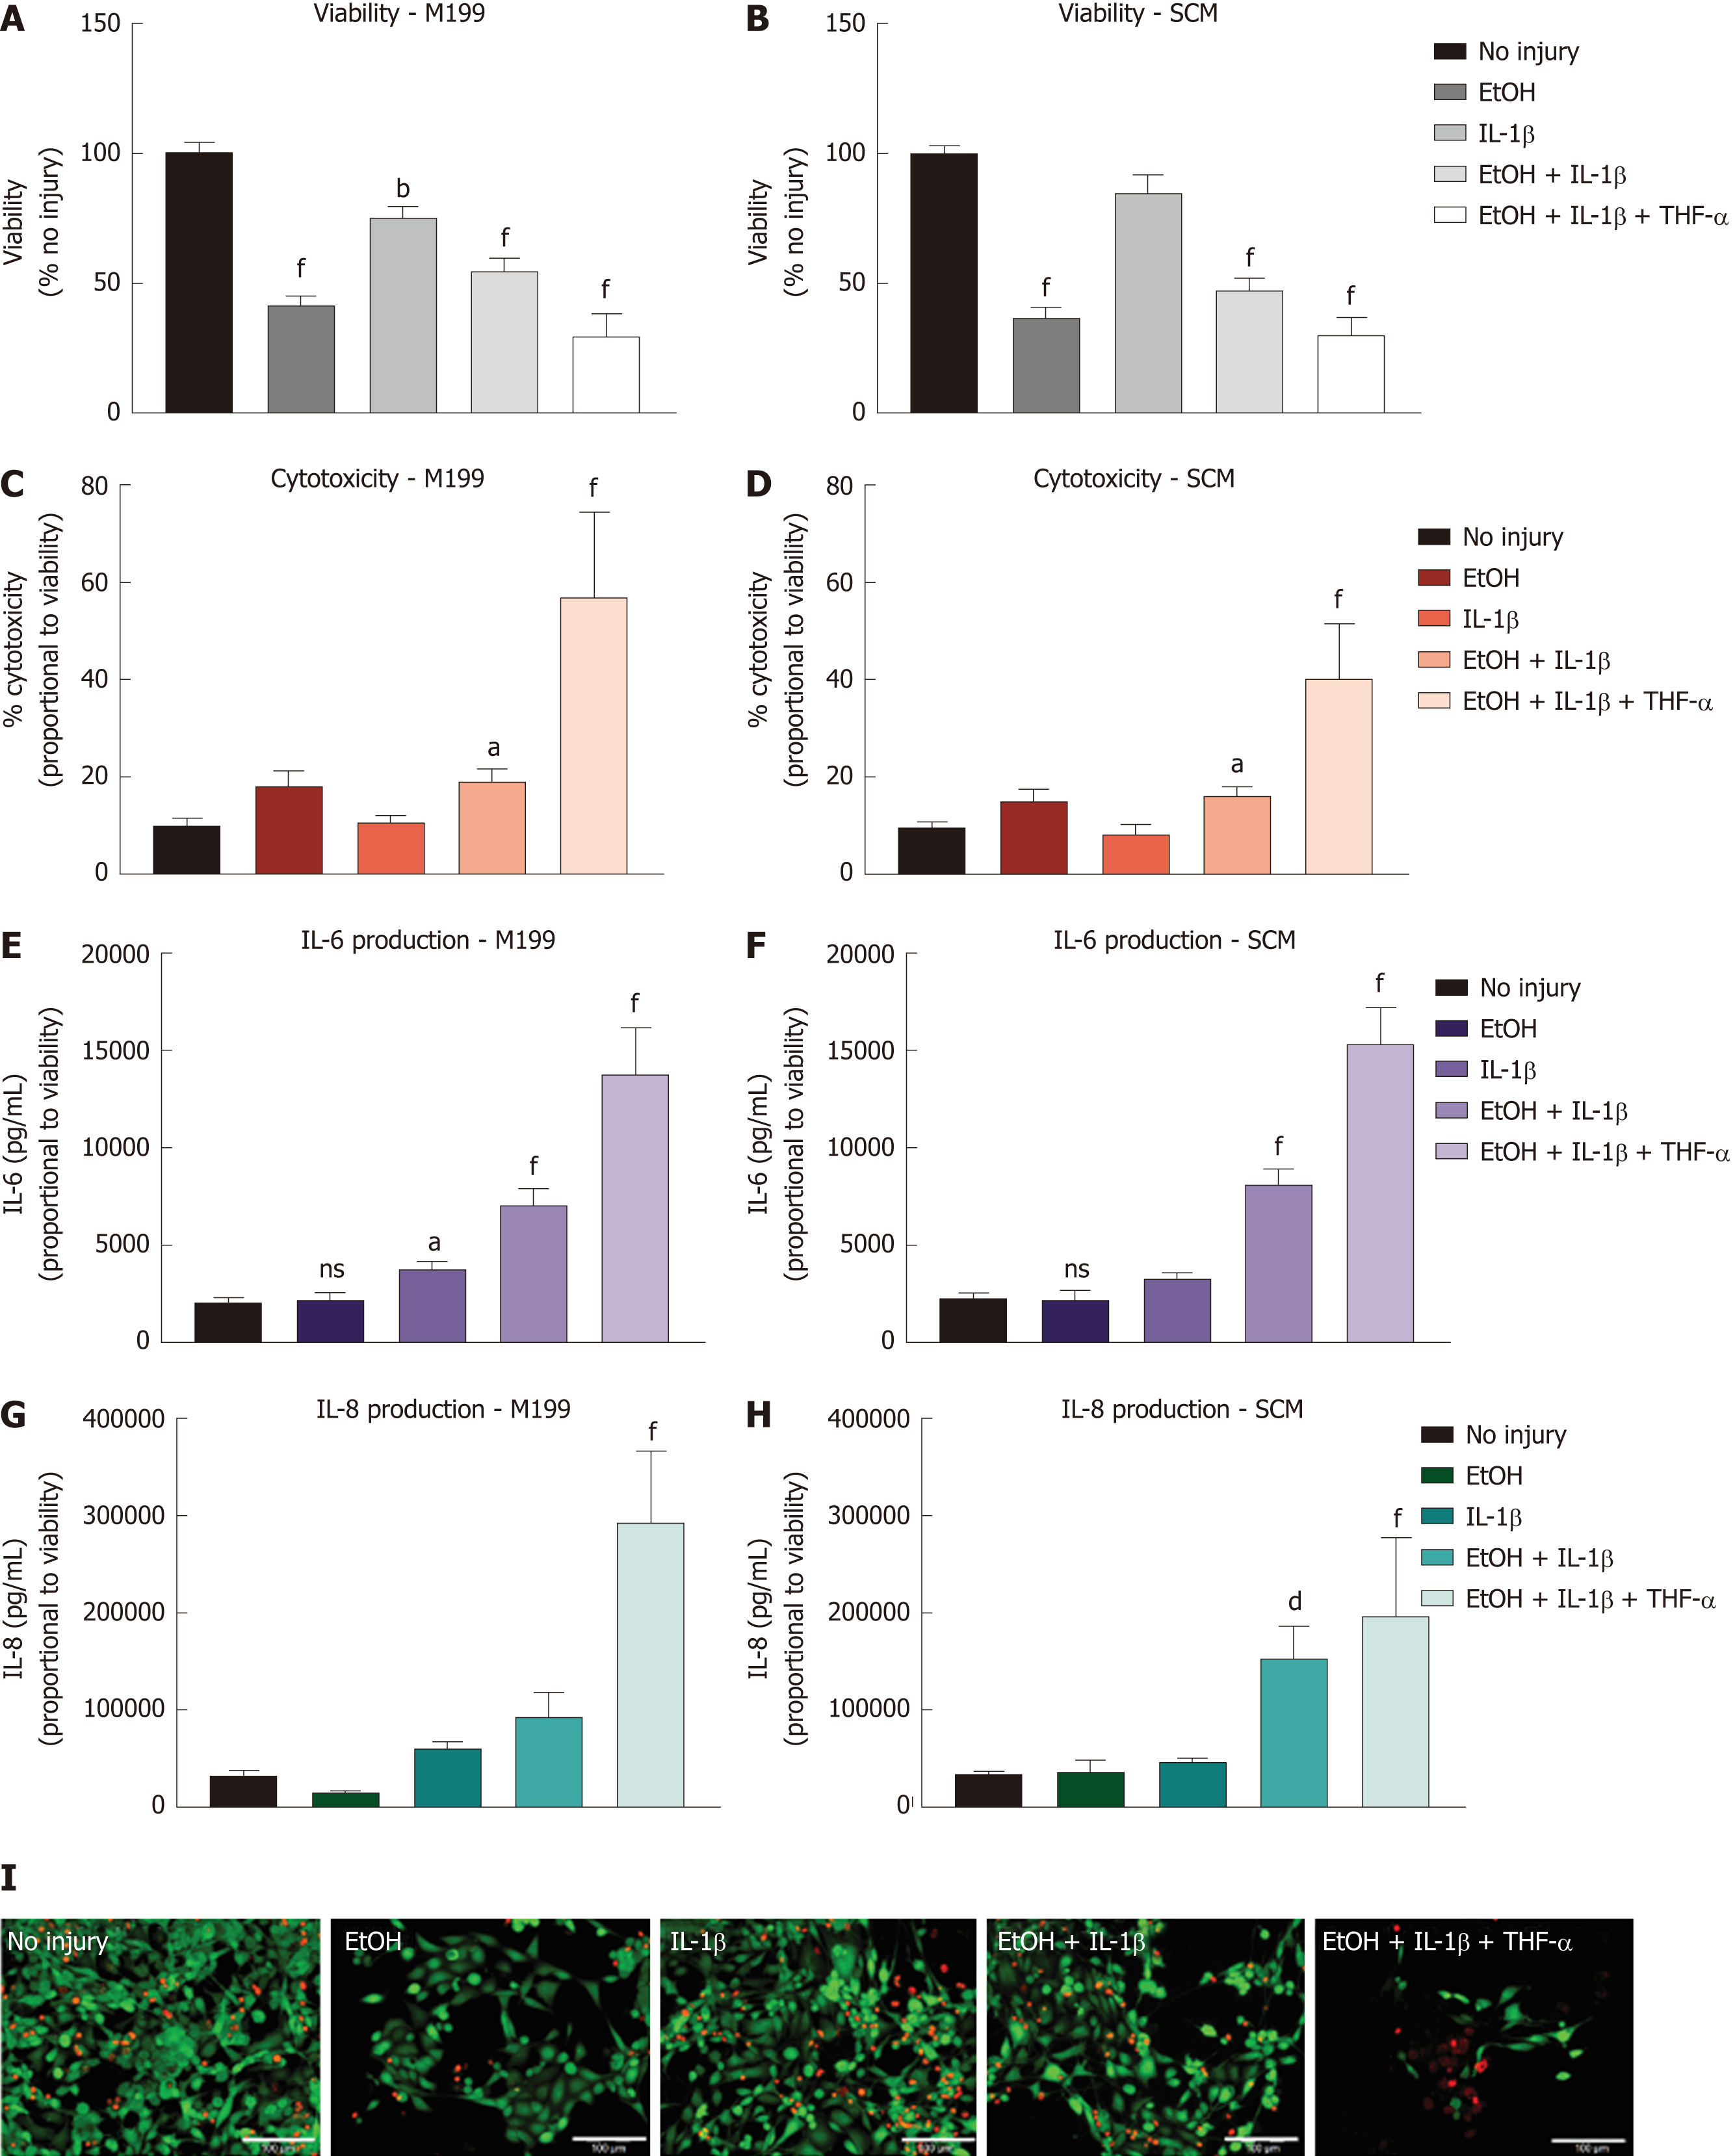
Figure 3 Injury model optimisation for human corneal epithelial cells.
Injury model optimisation was performed with human corneal epithelial cells (hCEC) cultured in both M199 (A, C, E, G) and stem cell medium (B, D, F, H). Injuries consisted of the following treatments: 20% (v/v) ethanol (EtOH); 1 ng/mL interleukin (IL)-1β in the medium; 20% (v/v) EtOH with 1 ng/mL IL-1β in the medium; and 20% (v/v) EtOH with 1 ng/mL IL-1β and 10 ng/mL TNF-α in the medium. A, B: PrestoBlue viability assay performed 72 h after the different treatments. Data represented relative to reading for no injury control; C, D: LDH assay performed on supernatant 72 h after injury. Data displayed as percentage cytotoxicity and relative to cell viability; E, F: Concentration of IL-6 in the supernatant 72 h after injury. Data displayed relative to cell viability; G, H: Concentration of IL-8 in the supernatant 72 h after injury. Data displayed relative to cell viability. Data for all graphs shown as mean ± SEM of five independent experiments, with three to six replicates each. Statistical significance compared to no injury controls analysed by one-way ANOVA represented by aP ≤ 0.05, bP ≤ 0.01, dP ≤ 0.001, fP ≤ 0.0001; I: LIVE/DEAD staining performed on hCEC cultured in stem cell medium for hCEC untreated control (A), 20% (v/v) EtOH (B), 1 ng/mL IL-1β (C), EtOH + 1 ng/mL IL-1β (D), EtOH + 10 ng/mL IL-1β (E), and EtOH+ 1 ng/mL IL-1β + 10 ng/mL TNF-α (F). Live staining (green) is shown with FITC, and dead staining (red) is shown with TRITC. Scale bar = 100 µm. hCEC: Human corneal epithelial cells; IL: Interleukin; SCM: Stem cell medium; TNF: Tumour necrosis factor.
- Citation: Orozco Morales ML, Marsit NM, McIntosh OD, Hopkinson A, Sidney LE. Anti-inflammatory potential of human corneal stroma-derived stem cells determined by a novel in vitro corneal epithelial injury model. World J Stem Cells 2019; 11(2): 84-99
- URL: https://www.wjgnet.com/1948-0210/full/v11/i2/84.htm
- DOI: https://dx.doi.org/10.4252/wjsc.v11.i2.84


