Copyright
©The Author(s) 2018.
World J Stem Cells. Dec 26, 2018; 10(12): 212-227
Published online Dec 26, 2018. doi: 10.4252/wjsc.v10.i12.212
Published online Dec 26, 2018. doi: 10.4252/wjsc.v10.i12.212
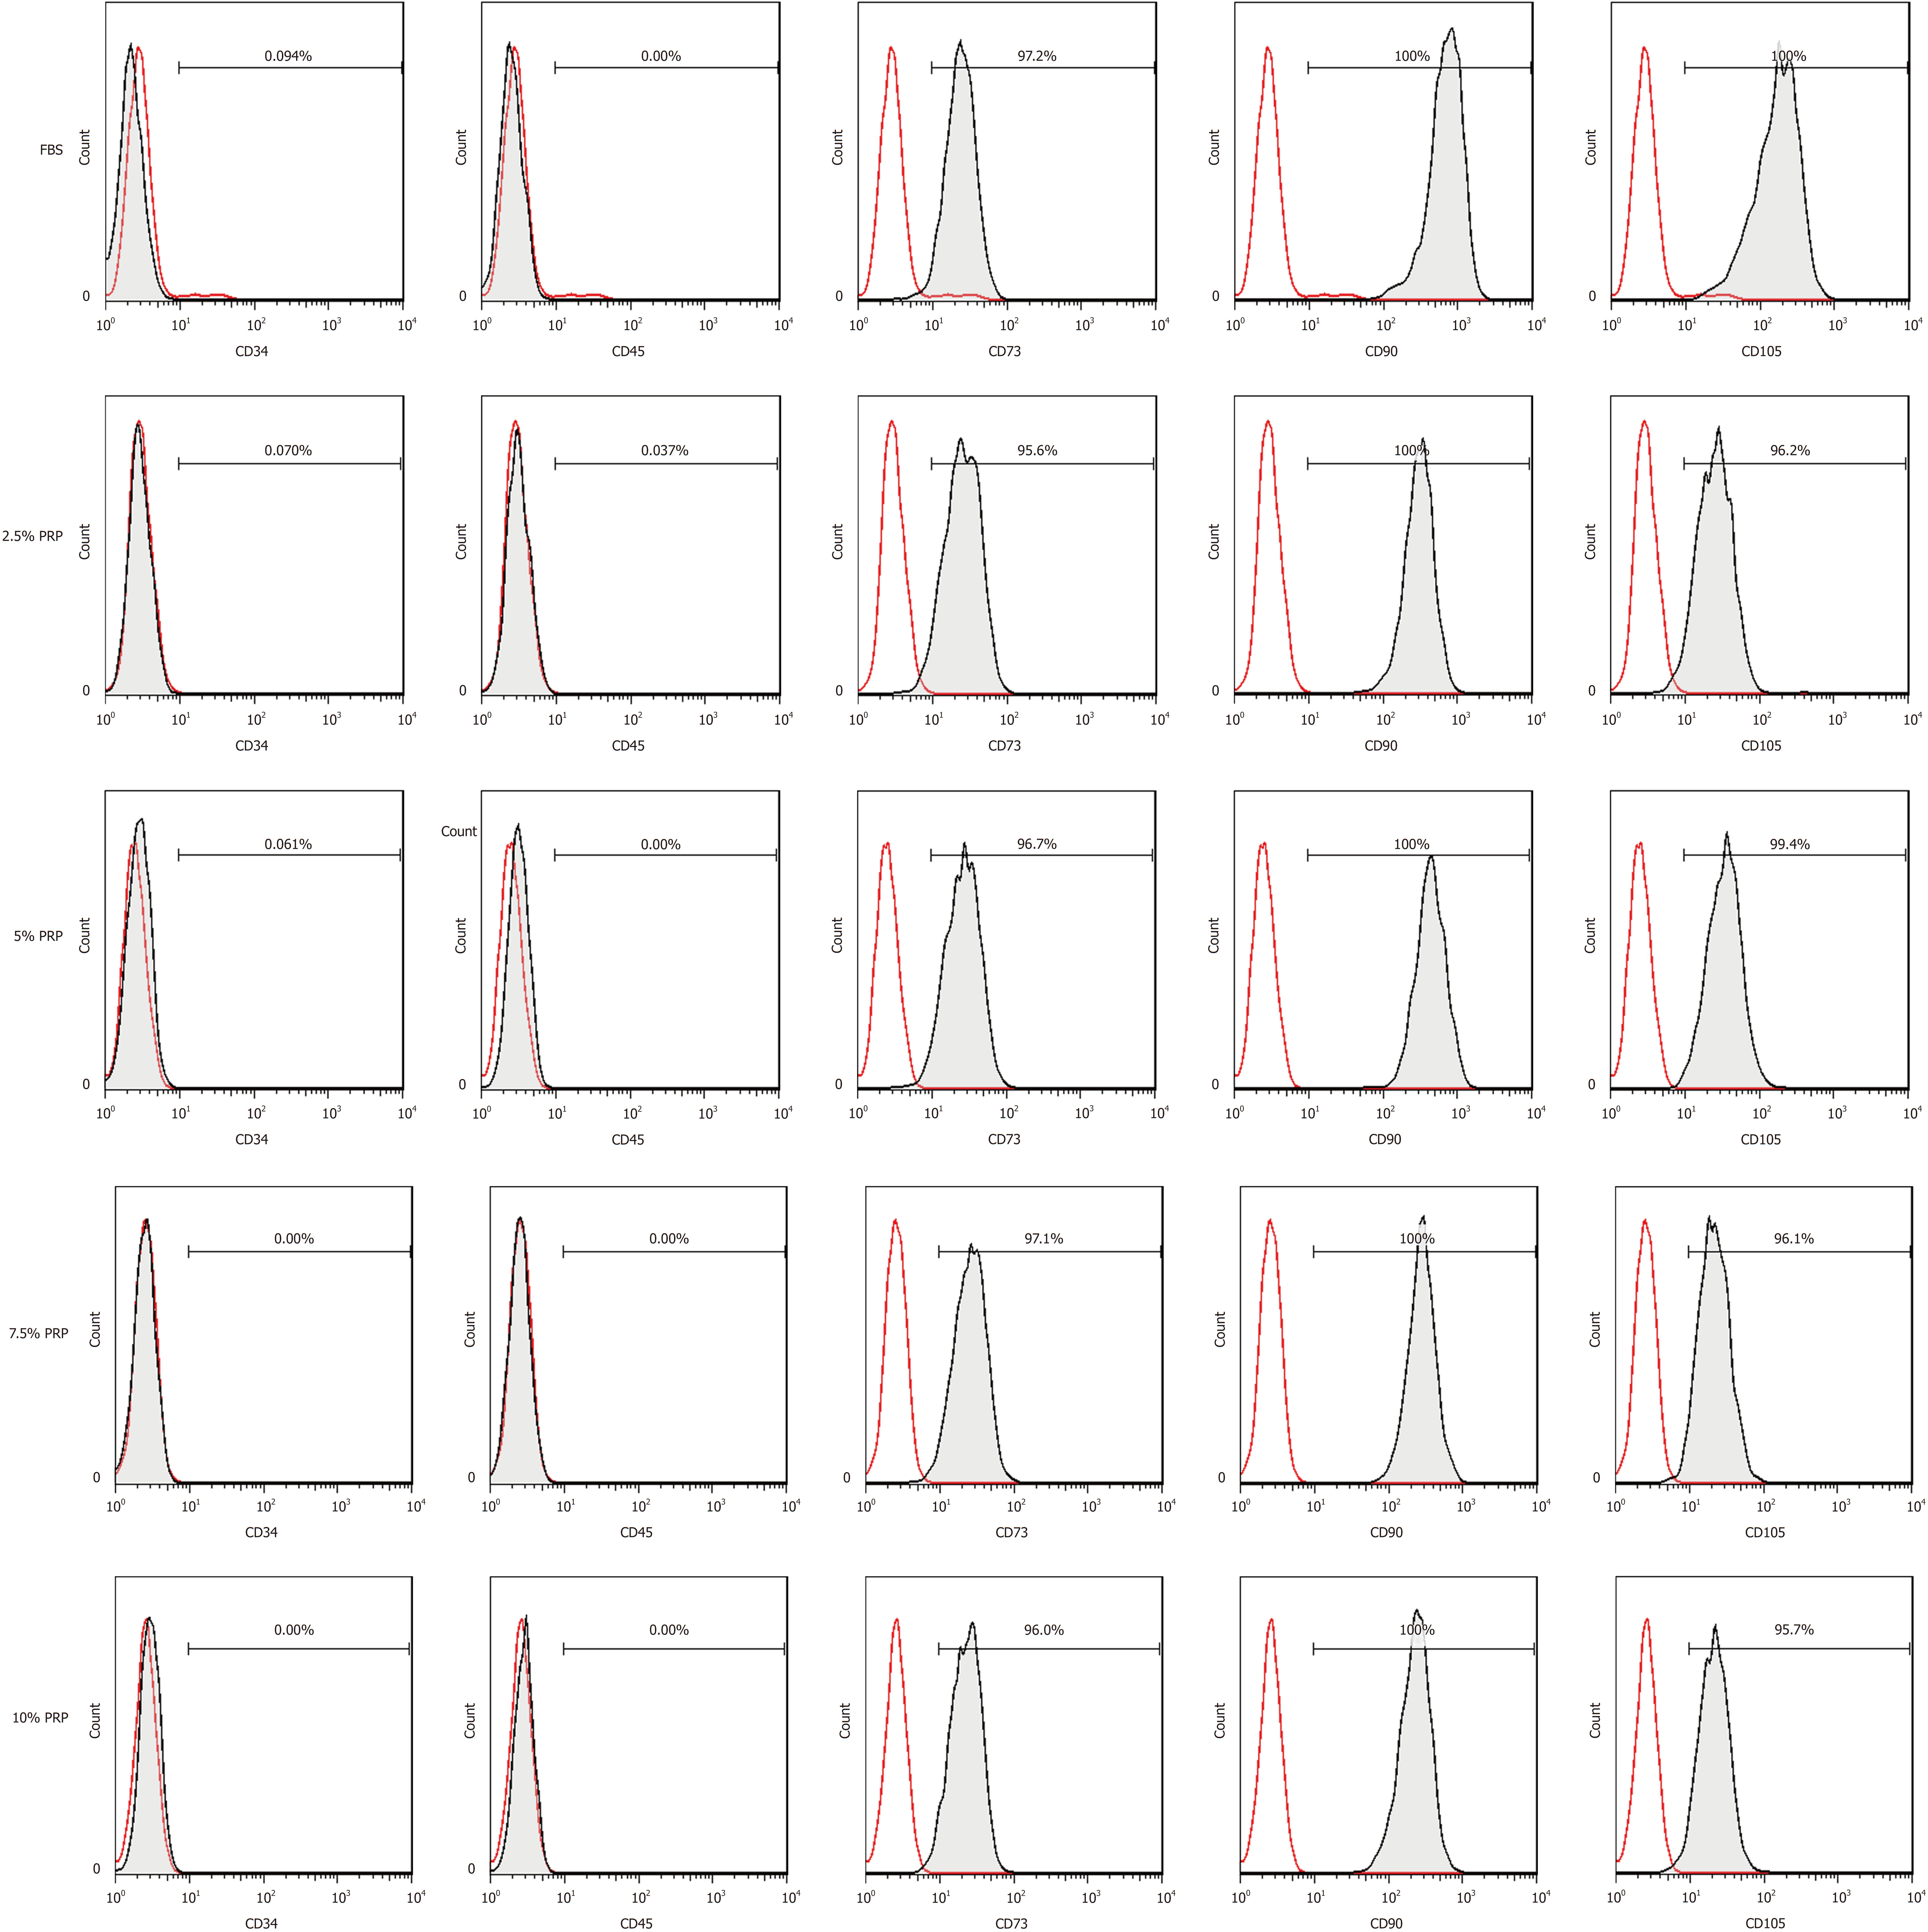
Figure 1 Flow cytometry of platelet-rich plasma preconditioned adipose-derived stem cells.
Most of the platelet-rich plasma preconditioned cells (98%-99%) were positive for CD105, CD73 and CD90, but negative for hematopoietic lineage markers including CD34 and CD45. The cells presented cell markers specific to mesenchymal stem cells. PRP: Platelet-rich plasma; FBS: Fetal bovine serum.
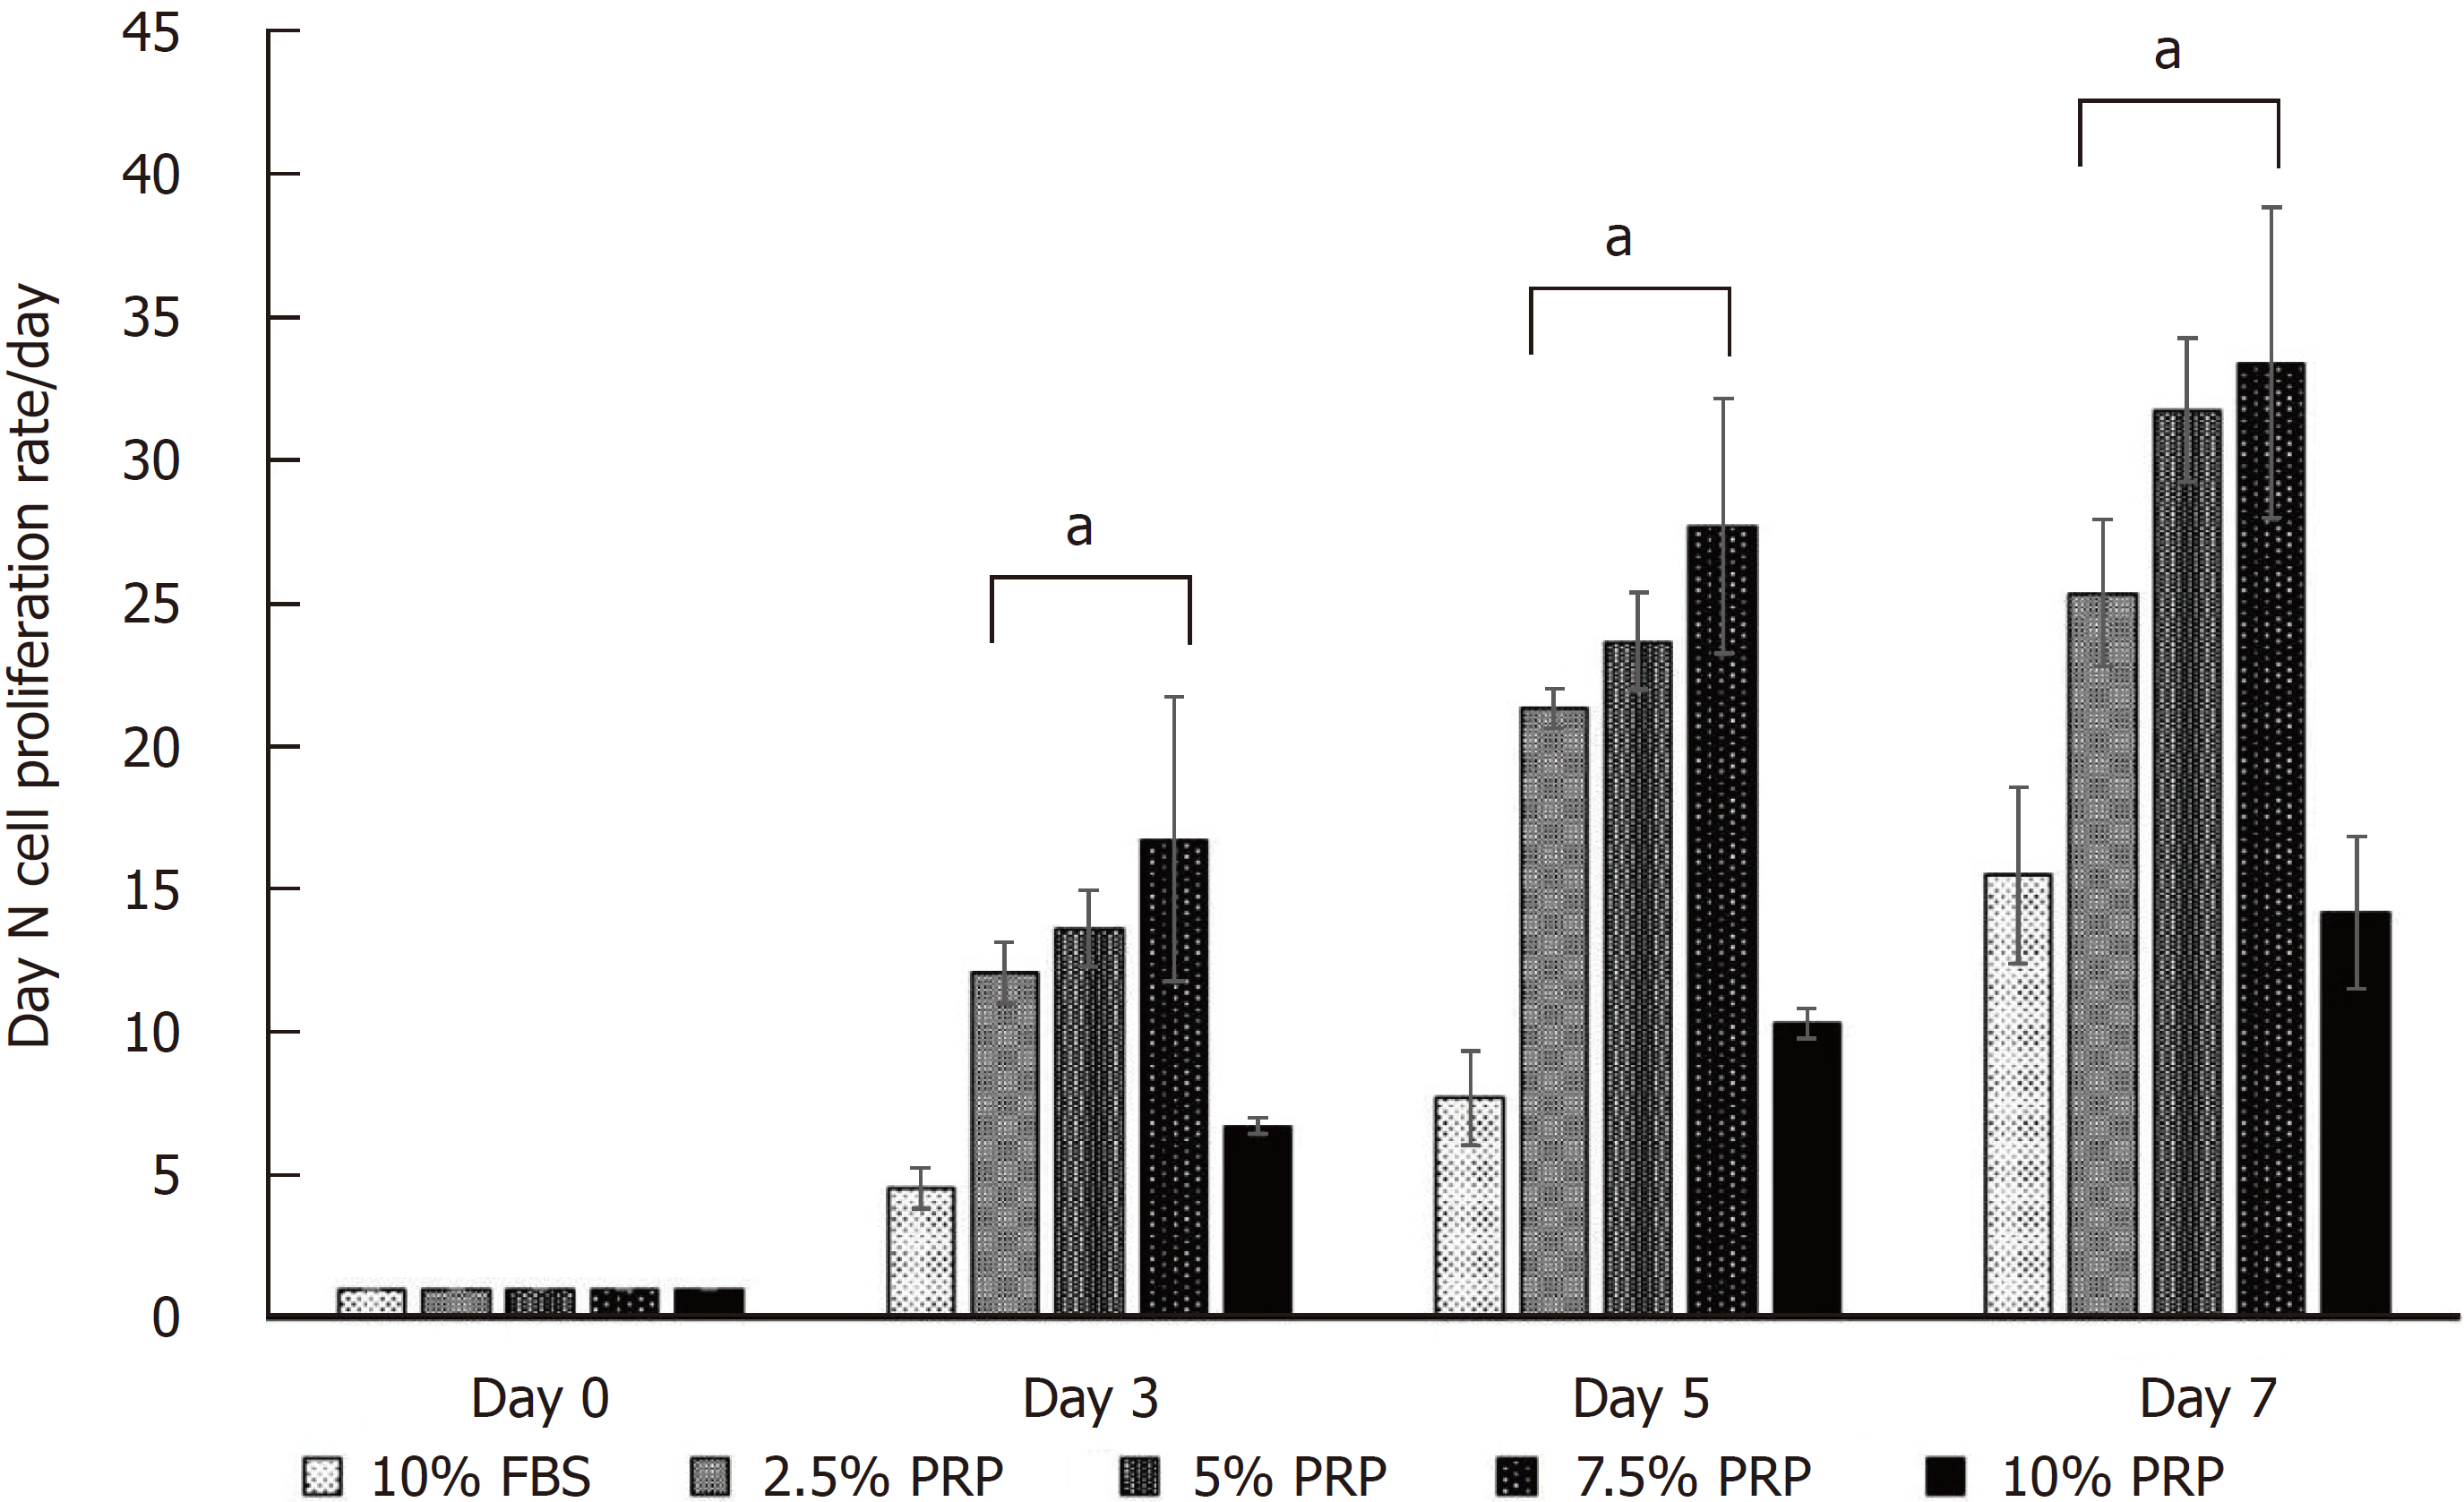
Figure 2 Cell proliferation assay.
At the endpoint (day 7), the proliferation rate of ADSCs was significantly higher in the 2.5%, 5%, and 7.5% PRP groups (25.348 ± 2.572, 31.778 ± 2.523, 33.400 ± 5.428 for 2.5% PRP, 5% PRP, 7.5% PRP, respectively) than in the 10% FBS (control group) and 10% PRP groups (15.483 ± 3.071 and 14.168 ± 2.650 for 10% FBS and 10% PRP; P < 0.01). The results suggested that 2.5%, 5%, and 7.5% PRP showed a higher ability to increase ADSC proliferation compared with FBS. Data are expressed as mean ± standard deviation. aP < 0.01 vs 10% FBS group. ADSC: Adipose-derived stem cell; PRP: Platelet-rich plasma; FBS: Fetal bovine serum.
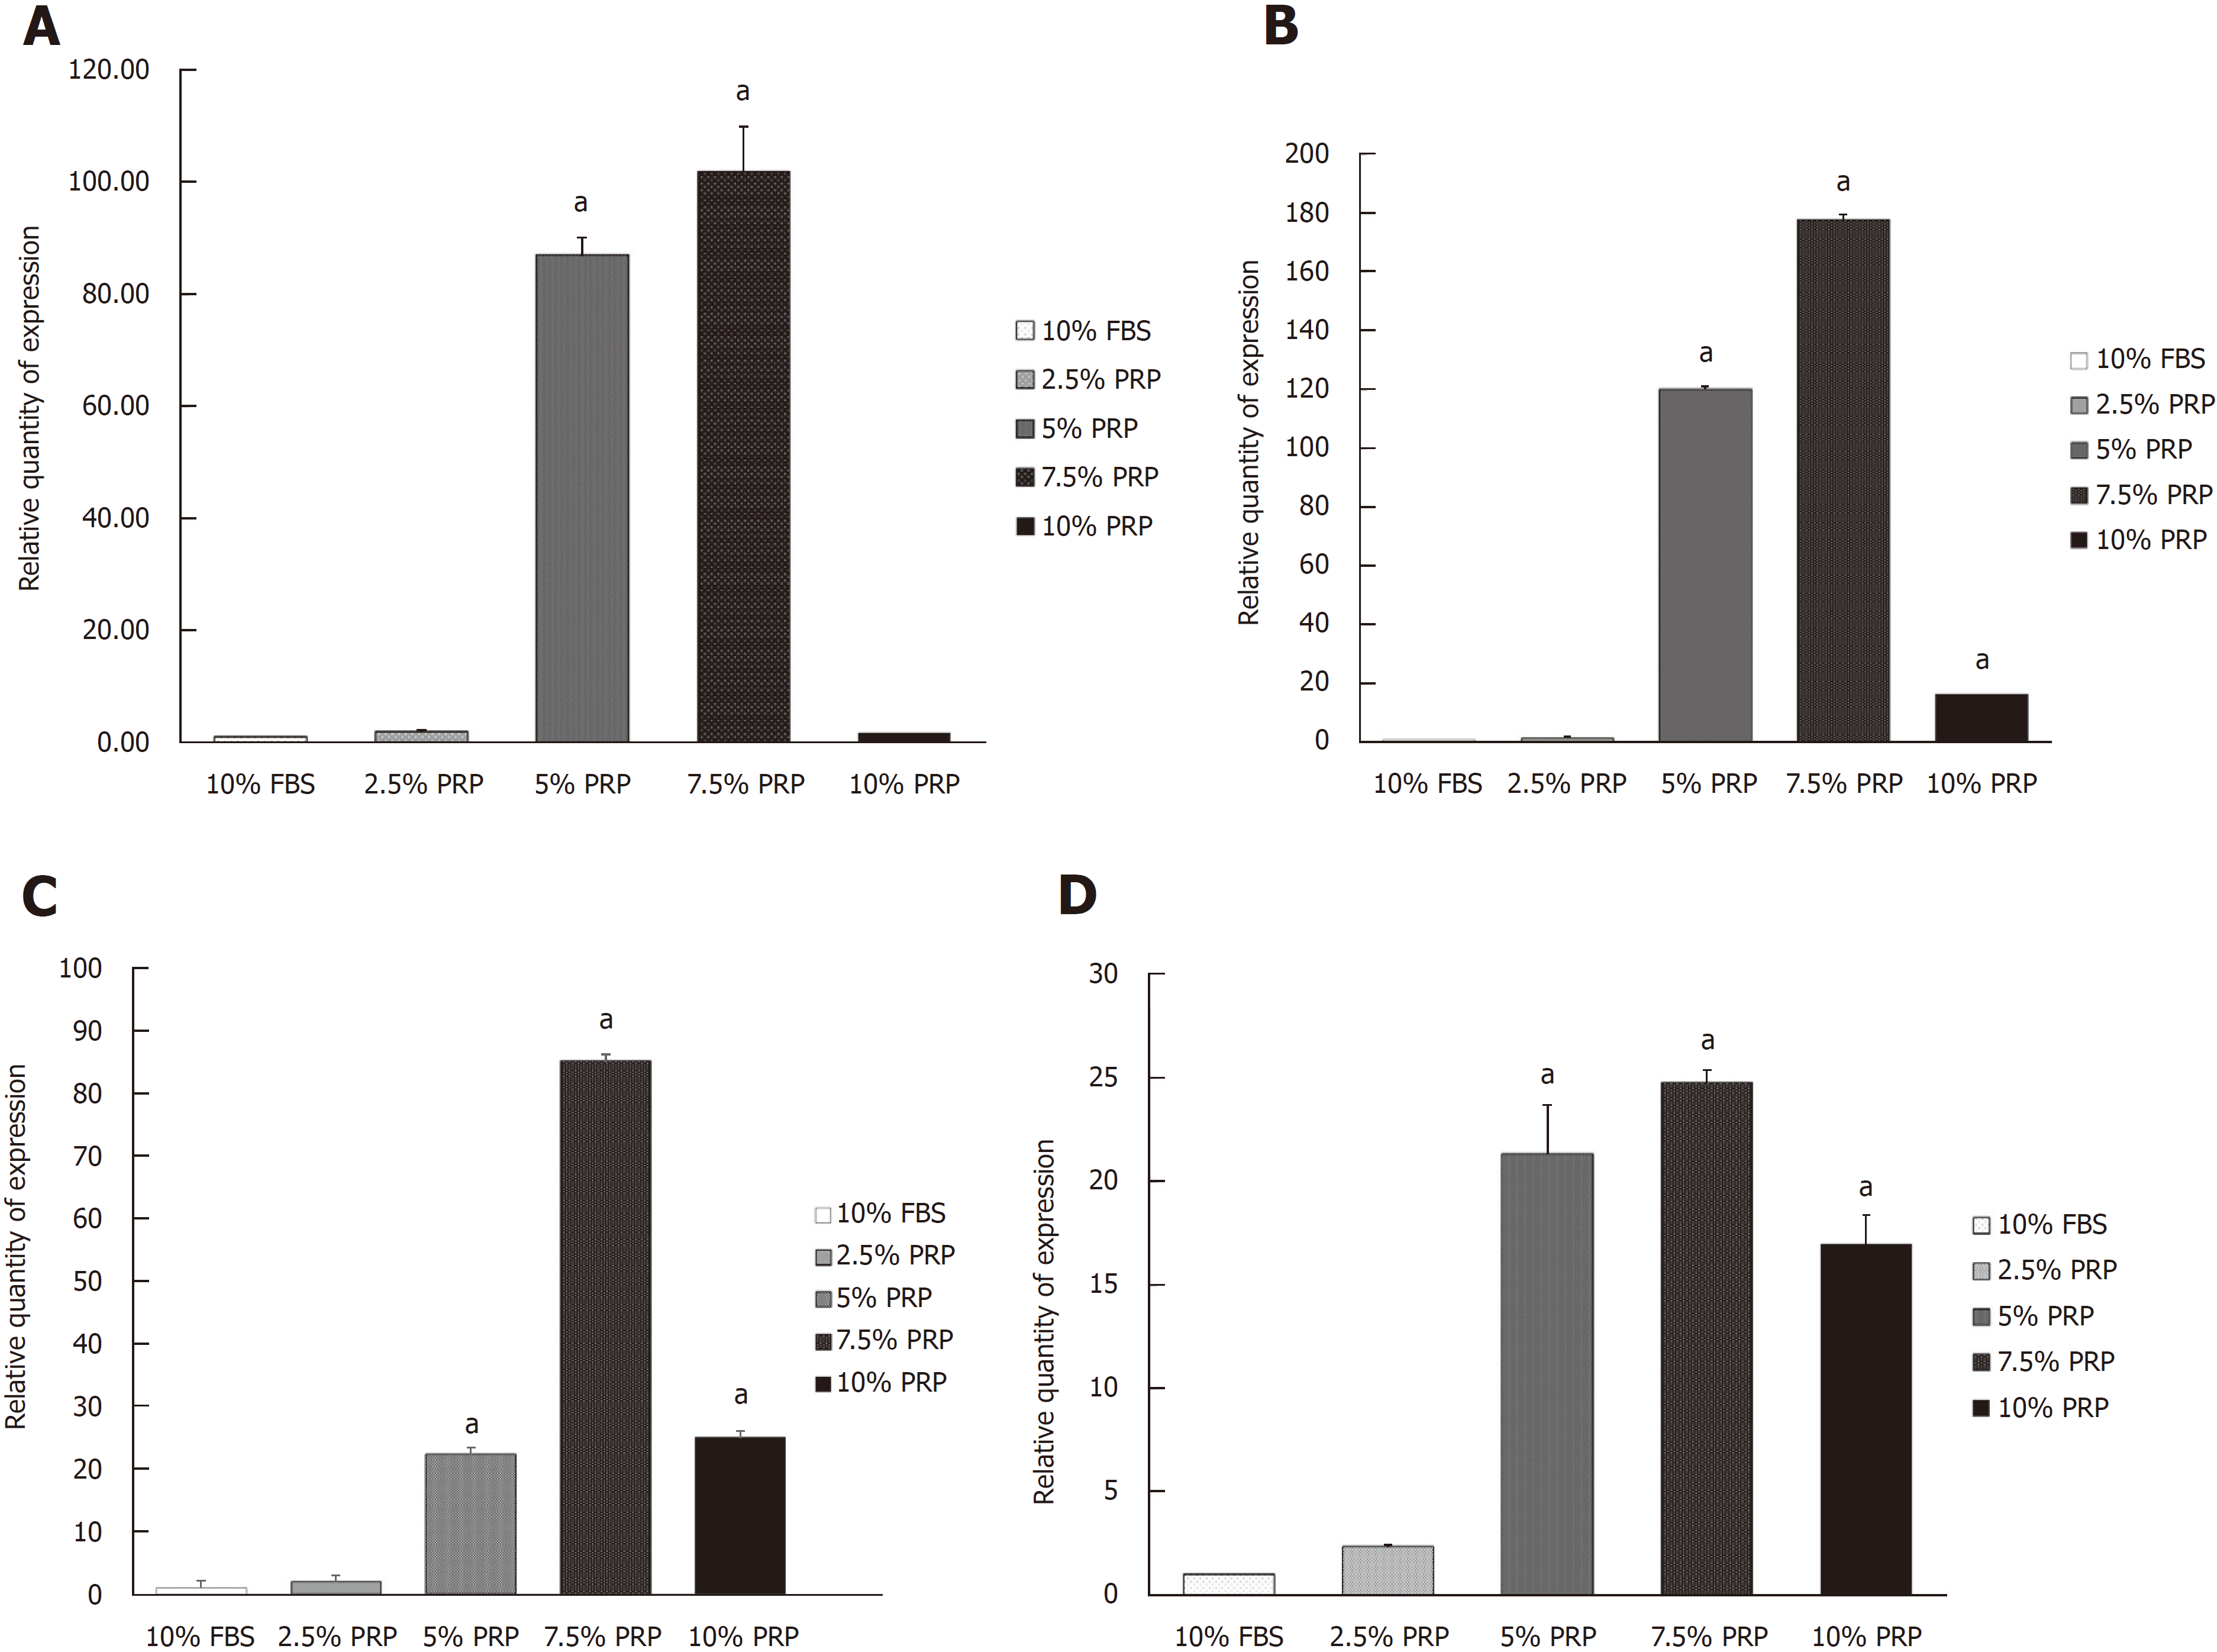
Figure 3 Analysis of gene expression of adipose-derived stem cell by reverse transcription polymerase chain reaction.
A: The expression of hypoxia-inducible factor mRNA was significantly increased in the 5% and 7.5% PRP groups compared with the FBS group; B: The expression of CD31 mRNA was significantly higher in the 5%, 7.5%, and 10% PRP groups compared with the FBS group; C: The expression of vascular endothelial growth factor was markedly higher in the 5% and 7.5% PRP groups compared with the FBS group; D: The expression of endothelial cell nitric oxide synthase was significantly increased in the 5% and 7.5% PRP groups compared with the FBS group. Data are expressed as means ± standard deviation. aP < 0.01 vs 10% FBS group. ADSC: Adipose-derived stem cell; PRP: Platelet-rich plasma; FBS: Fetal bovine serum.
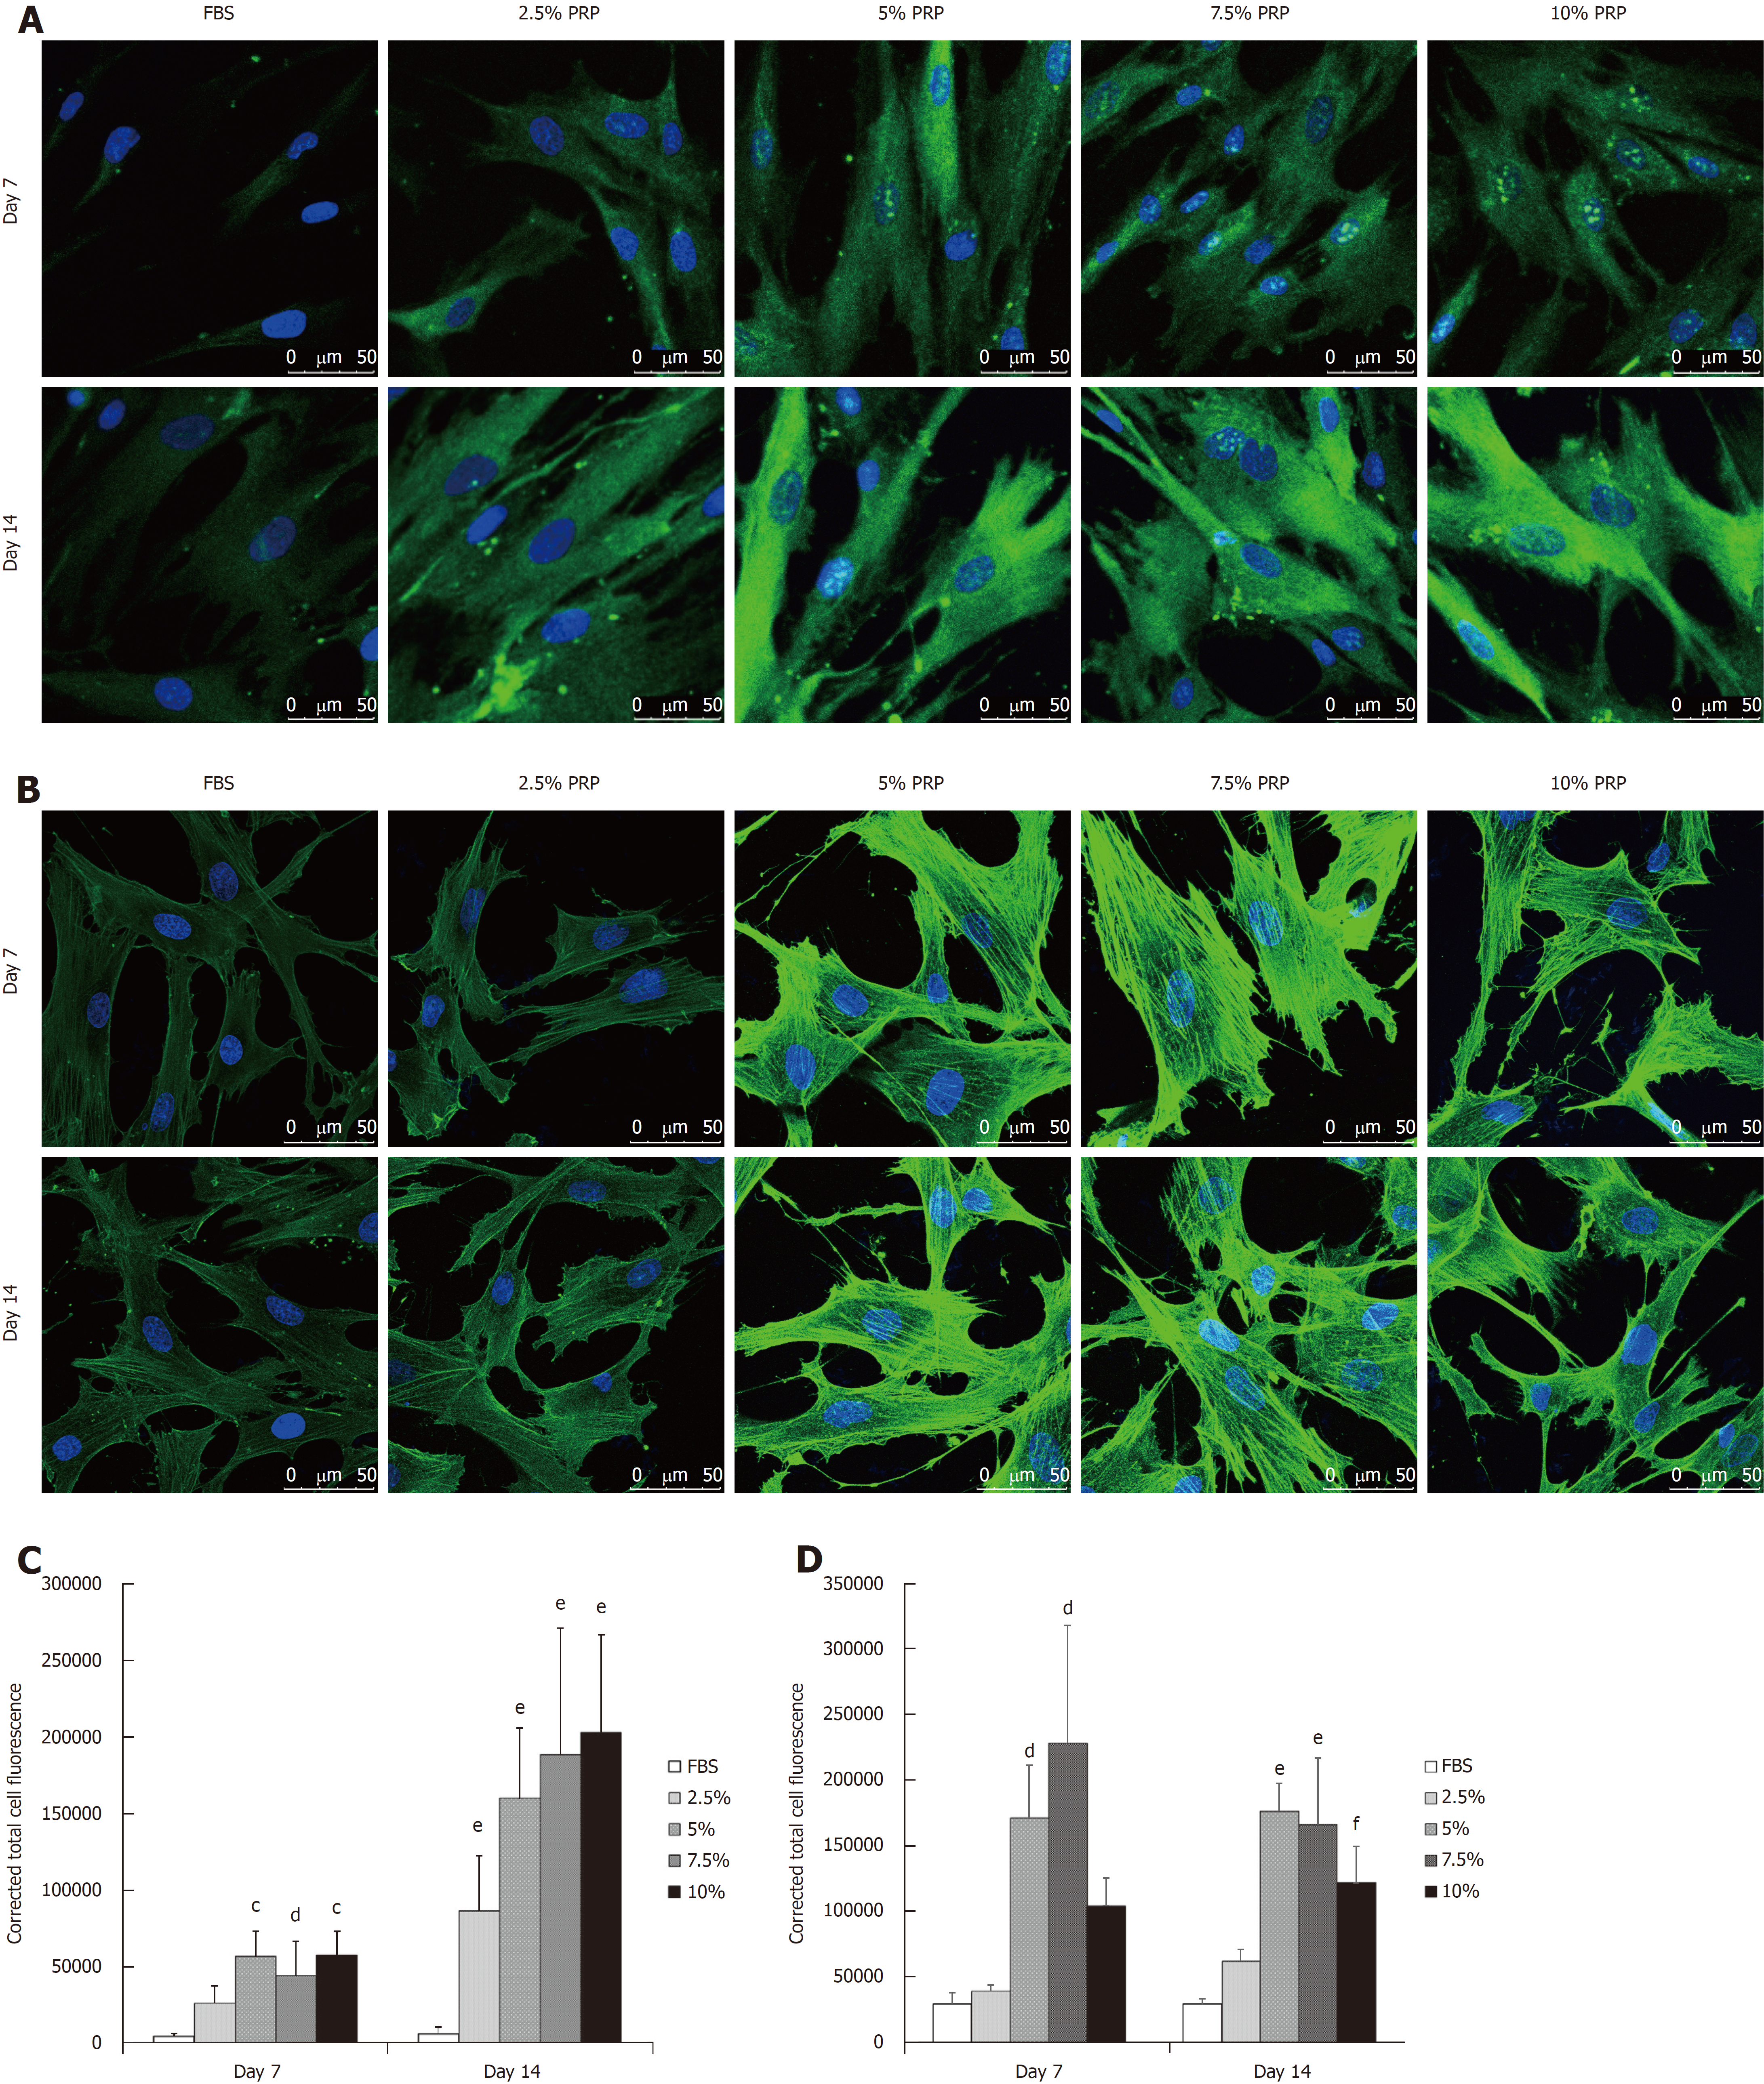
Figure 4 Immunofluorescence staining of CD31 and vascular endothelial growth factor.
A: After culturing for 14 d, CD31 expression (in green) was higher in all PRP groups; B: After culturing for 14 d, VEGF expression (in green) was higher in all PRP groups; C: The immunostaining intensity was observed through confocal microscopy and was then quantified using Image J. The corrected total cellular fluorescence ratio was calculated using the following formula: corrected total cellular fluorescence = integrated density (area of selected cell × mean fluorescence of background readings). After culturing for 14 d, CD31 expression (in green) was significantly higher in all PRP groups than in the FBS group. D: The early elevated production of VEGF was noted from day 7 in the 5% and 7.5% PRP groups. On day 14, 5%, 7.5%, and 10% PRP groups showed considerable increases in VEGF production. Data are expressed as means ± standard deviation. cP < 0.01 vs 10% FBS group at day 7; dP < 0.05 vs 10% FBS group at day 7; eP < 0.01 vs 10% FBS group at day 14; fP < 0.05 vs 10% FBS group at day 14. PRP: Platelet-rich plasma; FBS: Fetal bovine serum; VEGF: Vascular endothelial growth factor.
Figure 5 Tube formation assay.
A: Tubular structure was noted in all PRP-treated ADSC groups; B: Tube formation was quantified by average length, tube numbers, and branch points. Overall performance was evaluated based on the total tube length, which was calculated using the following formula: average length × tube numbers. The result showed that ADSCs in the 5%, 7.5%, and 10% PRP groups showed more tube formation, more cell–cell interconnections (evaluated by branch points), and longer tubes. Data are expressed as means ± standard deviation. aP < 0.01 vs 10% fetal bovine serum group. PRP: Platelet-rich plasma; FBS: Fetal bovine serum; ADSC: Adipose-derived stem cell.
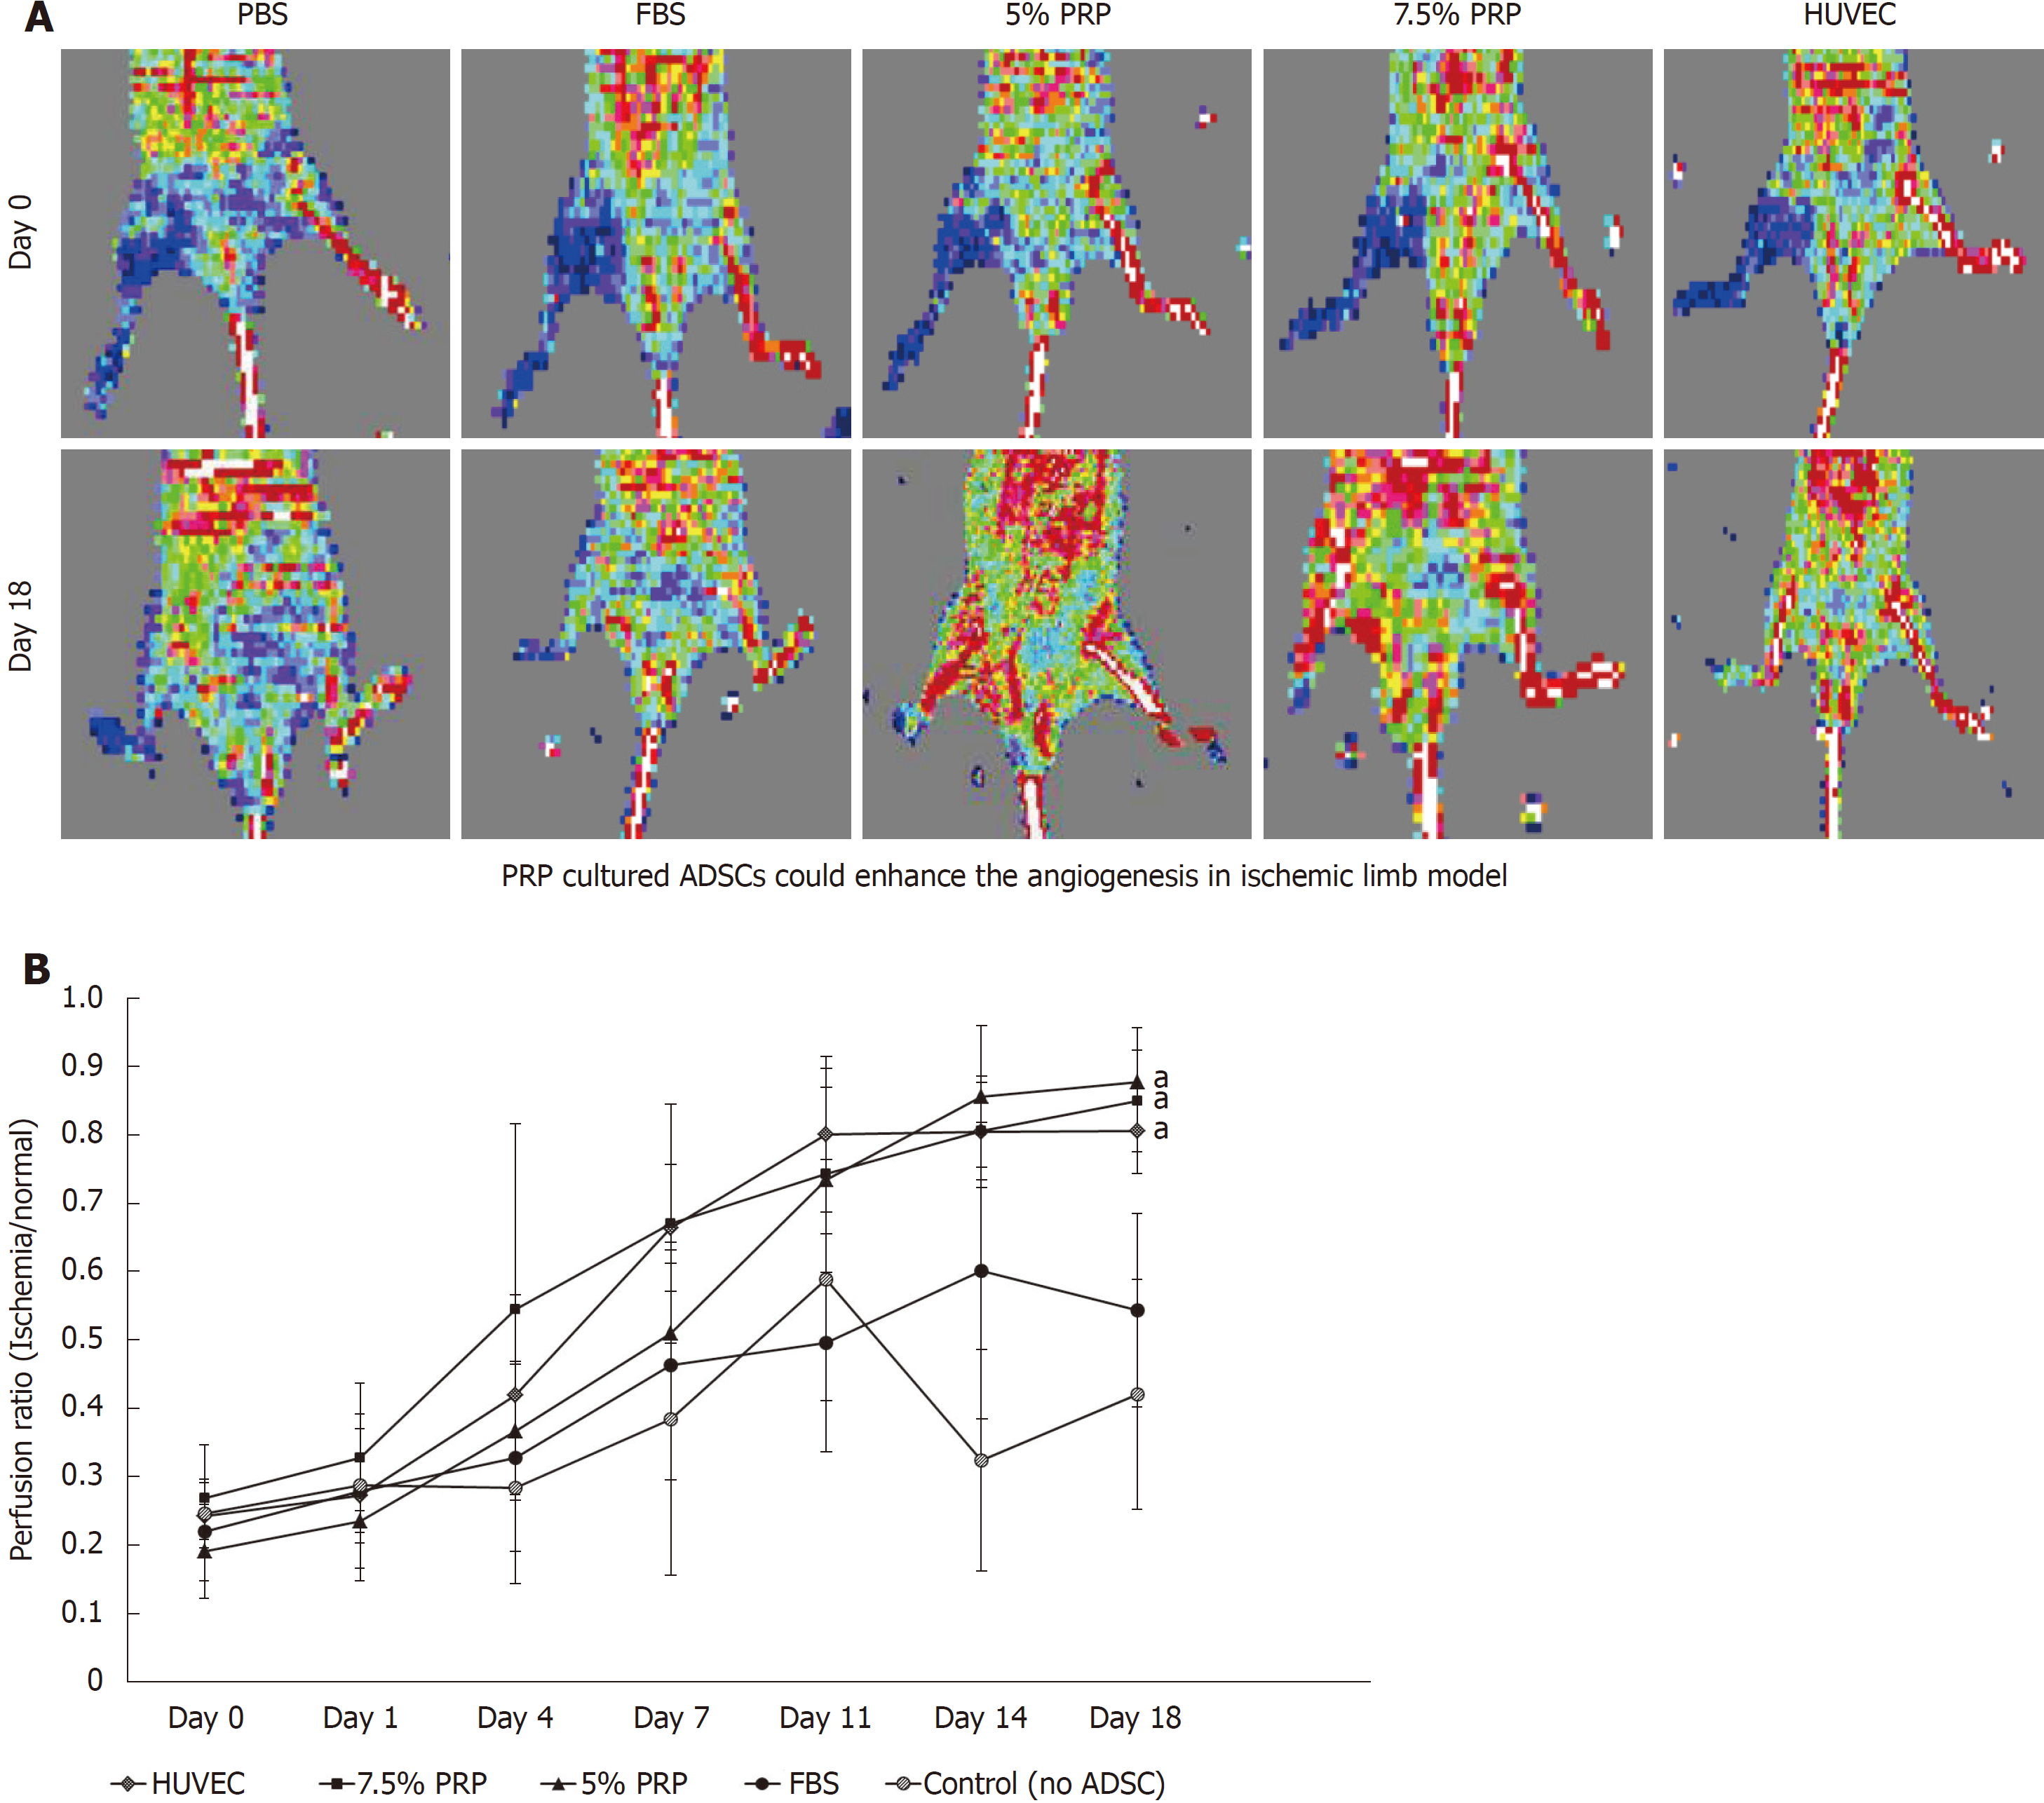
Figure 6 Ischemic hindlimb model.
A: Red and blue indicate areas with normal blood perfusion and ischemia, respectively. Although serial laser Doppler images showed some natural recovery of hindlimb blood flow in control groups, administering PRP-preconditioned ADSCs to the ischemic site increased tissue perfusion; B: Quantification was done by perfusion ratio (%): blood flow in operated hindlimb/blood flow in non-operated hindlimb. The revascularization rate remained low in the phosphate buffer solution and 10% FBS groups, with the ratios of 0.42 ± 0.16 and 0.54 ± 0.14, respectively, on day 18. The PRP and HUVEC groups showed significantly higher ratios on day 18 (0.88 ± 0.08, 0.85 ± 0.07, 0.81 ± 0.06 for 5% PRP, 7.5% PRP, and HUVECs, respectively) than the phosphate buffer solution group (0.42 ± 0.17). Data are expressed as means ± standard deviation. aP < 0.01 vs 10% FBS group. PRP: Platelet-rich plasma; FBS: Fetal bovine serum; ADSC: Adipose-derived stem cell; HUVEC: Human umbilical vein endothelial cell; PBS: Phosphate buffer solution.
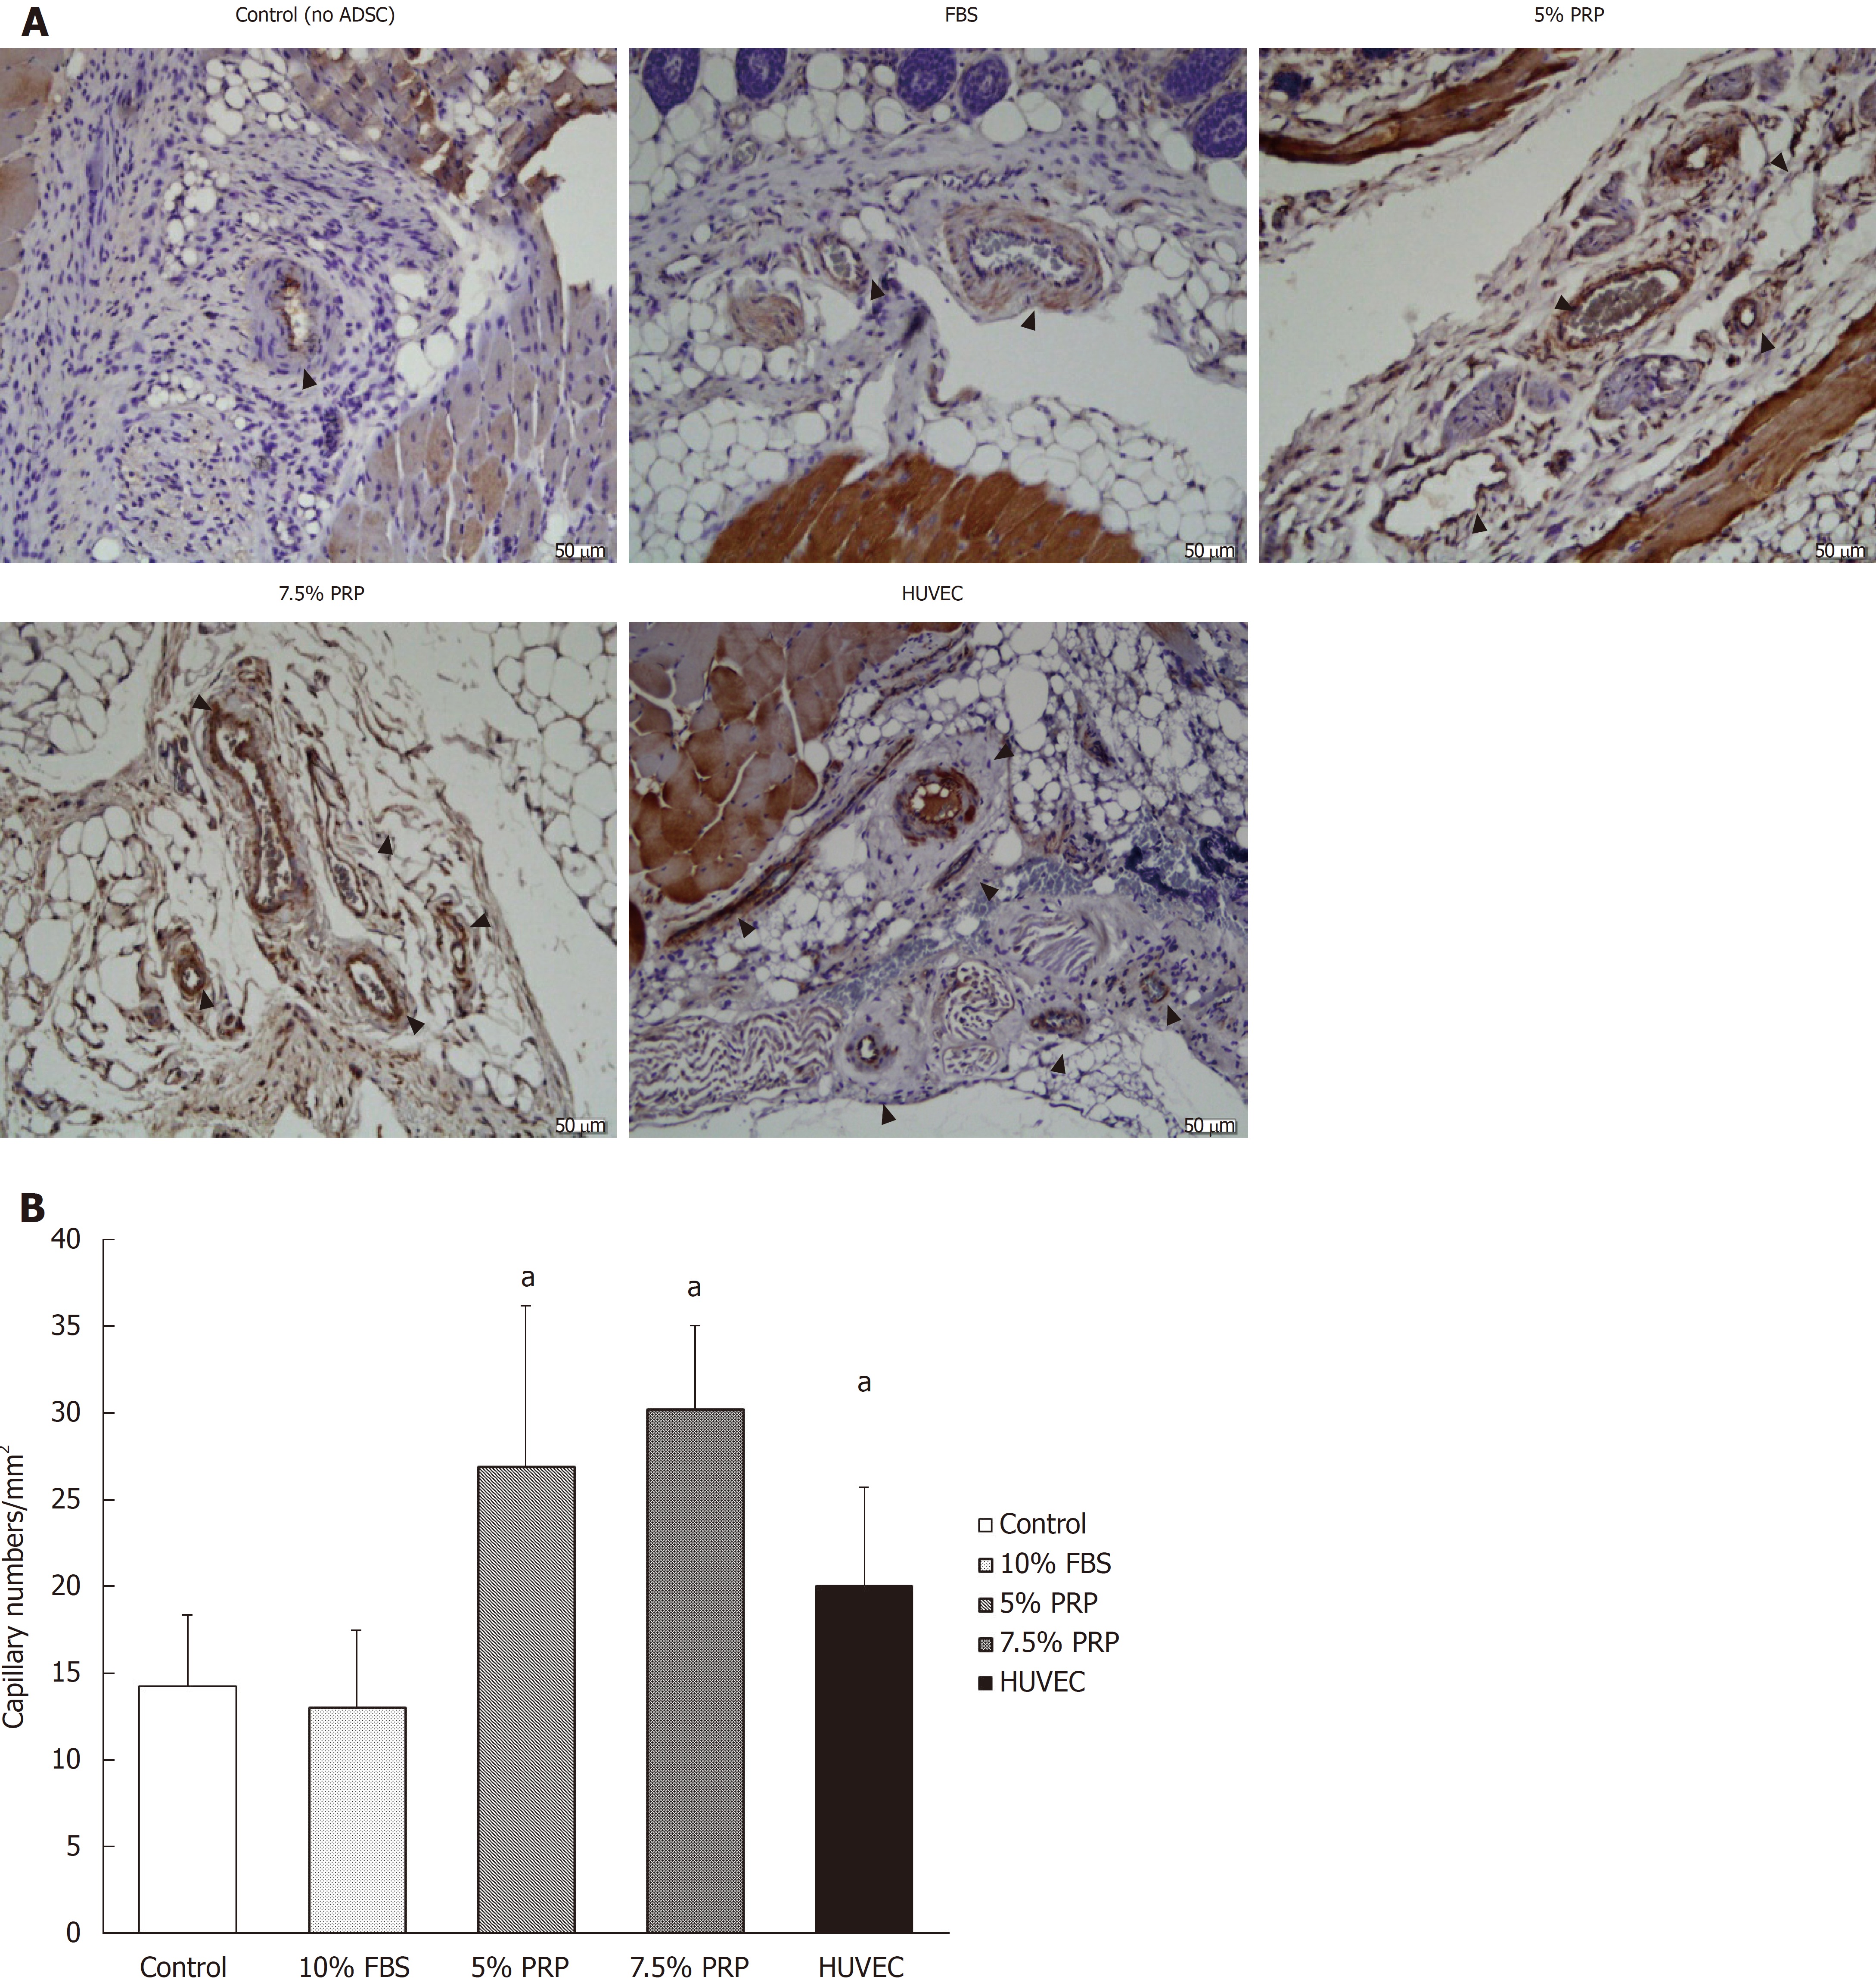
Figure 7 Histological staining of muscle sections.
A: The capillary densities of the PRP groups were higher than those of the control and FBS groups; B: We used CD31 stained sections to identify capillary numbers under microscopy. Capillary density was determined by measuring capillary numbers/mm2. The 5% PRP, 7.5% PRP, and human umbilical vein endothelial cell groups had better results than the FBS group. Data are expressed as means ± standard deviation. aP < 0.01 vs 10% FBS group. PRP: Platelet-rich plasma; FBS: Fetal bovine serum; ADSC: Adipose-derived stem cell; HUVEC: Human umbilical vein endothelial cell.
- Citation: Chen CF, Liao HT. Platelet-rich plasma enhances adipose-derived stem cell-mediated angiogenesis in a mouse ischemic hindlimb model. World J Stem Cells 2018; 10(12): 212-227
- URL: https://www.wjgnet.com/1948-0210/full/v10/i12/212.htm
- DOI: https://dx.doi.org/10.4252/wjsc.v10.i12.212


