Published online May 21, 2024. doi: 10.3748/wjg.v30.i19.2575
Revised: March 9, 2024
Accepted: April 24, 2024
Published online: May 21, 2024
Processing time: 106 Days and 17.4 Hours
Lactate, previously considered a metabolic byproduct, is pivotal in cancer progre
To construct a novel lactylation-related gene signature to predict the survival of patients with pancreatic cancer.
RNA-seq and clinical data of pancreatic adenocarcinoma (PDAC) were obtained from the GTEx (Genotype-Tissue Expression) and TCGA (The Cancer Genome Atlas) databases via Xena Explorer, and GSE62452 datasets from GEO. Data on lactylation-related genes were obtained from publicly available sources. Differential expressed genes (DEGs) were acquired by using R package “DESeq2” in R. Univariate COX regression analysis, LASSO Cox and multivariate Cox regressions were produced to construct the lactylation-related prognostic model. Further ana
In this study, we successfully identified 10 differentially expressed lactylation-related genes (LRGs) with prognostic value. Subsequently, a lactylation-related signature was developed based on five OS-related lactylation-related genes (SLC16A1, HLA-DRB1, KCNN4, KIF23, and HPDL) using Lasso Cox hazard regression analysis. Subsequently, we evaluated the clinical significance of the lactylation-related genes in pancreatic adenocarcinoma. A comprehensive examination of infiltrating immune cells and tumor mutation burden was conducted across different subgroups. Furthermore, we demonstrated that SLC16A1 modulates lactylation in pancreatic cancer cells through lactate transport. Both in vivo and in vitro experiments showed that decreasing SLC16A1 Level and its lactylation significantly inhibited tumor progression, indicating the potential of targeting
We constructed a novel lactylation-related prognostic signature to predict OS, immune status, and treatment response of patients with pancreatic adenocarcinoma, providing new strategic directions and antitumor immunotherapies.
Core Tip: Our article presents the first study on lactylation modification in pancreatic cancer, establishing a lactylation-related signature that offers new strategic directions for tumor prognosis prediction and combination antitumor immunotherapy. It employs an innovative approach, combining both dry lab and wet lab experimental methods, to validate the genes most closely associated with lactylation.
- Citation: Peng T, Sun F, Yang JC, Cai MH, Huai MX, Pan JX, Zhang FY, Xu LM. Novel lactylation-related signature to predict prognosis for pancreatic adenocarcinoma. World J Gastroenterol 2024; 30(19): 2575-2602
- URL: https://www.wjgnet.com/1007-9327/full/v30/i19/2575.htm
- DOI: https://dx.doi.org/10.3748/wjg.v30.i19.2575
Pancreatic cancer is one of the most lethal malignancy worldwide; its incidence has increased drastically in recent years[1]. Owing to its deep-seated location and swift progression, early detection of pancreatic cancer remains a challenge and poses considerable therapeutic obstacles. Additionally, several hurdles persist, such as the identification of high-risk populations for preventive measures, discovery of innovative cancer biomarkers for timely detection, and development of improved therapeutic strategies to address chemotherapy resistance, along with concerns of recurrence and metastasis[2]. Therefore, it is imperative to identify effective signatures that can enhance both the diagnostic and therapeutic effi
Lactate, previously regarded as a metabolic byproduct of cancer cell glycolysis, has emerged as a critical regulator of key functions, such as tumor growth, invasion, metastasis, immunosuppression, and therapeutic resistance[3]. Increasing evidence suggests that lactate derived from glycolysis is involved in establishing the metabolic cycle between tumors and non-malignant cells[4,5]. Furthermore, lactate transport in the extracellular environment directly affects neighboring stromal and immune cells, modulates inflammation, and promotes immune tolerance[6]. In addition, lactate is a signaling molecule in both regular and tumorous tissues[7]. Recent advances suggest that lactate is not merely an energy source or signaling molecule; it promotes tumor processes via an emergent epigenetic modification called lysine lactylation (Kla)[8]. This post-translational regulation involves the addition or removal of lactyl groups from histone and non-histone proteins, regulated by glycolysis and lactate levels. Given the important roles of lactate in various physiological pro
This study constructed a lactylation-associated prognostic model by comparing normal pancreatic and PDAC tissues to accurately predict the prognosis and immune status of patients with PDAC. After comparing the degree of lactylation between different cell lines, we focused on two cell lines expressing the highest levels of the LRGs, SLC16A1. We validated the potential relationship between SLC16A1 and lactylation and its significance in PDAC progression using various molecular, cellular, and animal experimental methods.
We accessed raw mRNA counts and clinical data for patients with PDAC from the Genotype-Tissue Expression (GTEx) and The Cancer Genome Atlas Program (TCGA) databases via Xena Explorer (https://xenabrowser.net/datapages/) and the GSE62452 dataset from Gene Expression Omnibus (https://www.ncbi.nlm.nih.gov/geo/). We also compiled 374 genes from lactylation pathways using Molecular Signatures Database, focusing on keywords like “lactate”, “lactic acid”, and “glycolysis”, and the lactylation-related enzyme family obtained from previous research. Eight relevant pathways were identified: GOMF_LACTATE_TRANSMEMBRANE_TRANSPORTER_ACTIVITY, HALLMARK_GLYCOLYSIS, HP_ABNORMAL_LACTATE_DEHYDROGENASE_LEVEL, HP_INCREASED_CIRCULATING_LACTATE_DEHYDROGENASE_CONCENTRATION, HP_INCREASED_SERUM_LACTATE, HP_LACTIC_ACIDOSIS, REACTO
Differentially expressed genes (DEGs) were acquired using the R package “DESeq2” in R (log2 fold change |FC| > 2 and P < 0.01). Subsequently, we conducted a cross-analysis between the DEGs and a lactylation-related gene set to identify LRGs that exhibit differential expression. This analysis was visualized as a Venn diagram using
Univariate Cox regression analysis was used to identify prognostically valuable LRGs. We then used ‘glmnet’ in R for Lasso Cox regression, creating a multivariate Cox model based on these genes[14]. The lactylation score was calculated using the following formula: Lactylation score = expression level of gene1 × coefficient of gene1 + expression level of gene2 × coefficient of gene2 + … + expression level of genen × coefficient of genen. All samples were categorized into two groups based on the median lactylation score: Lactyl-high and Lactyl-low. Principal component analysis was used to check the classification accuracy, and Kaplan-Meier analysis was used to compare the overall and median survival times between the two groups. In addition, using the R package “timeROC,” we performed the time-dependent receiver operating characteristic (ROC) curve. Furthermore, we employed a Cox proportional hazards regression model to identify LRGs as independent prognostic factors for overall survival (OS). A nomogram predicting 1-, 3-, and 5-year survival was created using “regplot,” and its accuracy and sensitivity were assessed via calibration, ROC, and decision curves.
Immune scores were calculated through the ESTIMATE algorithm using the “estimate” R package. Furthermore, Spearman’s correlation test was used to examine the association between lactylation and immune scores. A positive corre
We analyzed immune infiltration in PDAC samples using the “CIBERSORT” algorithm to assess the fractions of 22 tumor-infiltrating immune cells, visualizing results with “ggplot” in R. Furthermore, we used a classification method that divides immune cells into four main categories from the previous study, which are total lymphocytes, total dendritic cells (sum of activated and resting dendritic cell percentages), total macrophages (sum of M0, M1, and M2 macrophage percentages), and total mast cells (sum of activated and resting mast cell percentages)[15]. We then examined the expression of these immune subgroups in the different lactylation groups using boxplots for visualization. Additionally, we compared immune checkpoint gene differences between subgroups to explore the impact of the lactylation score on immunotherapy using checkpoint genes sourced from a previous study[16].
PDAC cell lines (AsPC-1, Capan-2, MIA-Paca2, PANC-1, and SW1990) and human normal pancreatic ductal epithelial cells (HPNE) were obtained from the Cell Resource Center of the Chinese Academy of Sciences in Shanghai, China. Cells were cultured at 37 °C with 5% CO2, and AsPC-1 cells were grown in RPMI-1640 with 10% fetal bovine serum (FBS), whereas others used high-glucose Dulbecco's modified Eagle medium with 10% FBS. Cells in the logarithmic growth phase were passaged using 0.25% trypsin.
Male BALB/c nude mice, 4–6 wk old, obtained from SLAC ANIMAL (Shanghai, China), were maintained in a specific pathogen-free facility at Xinhua Hospital, Shanghai Jiao Tong University. The facility had a 12 h light-dark cycle, 25 ± 2 °C temperature, and 65% humidity. The mice had ad libitum access to food and water. The study was approved by the hospital's Ethics Committee and followed the national animal use guidelines.
Mice were injected subcutaneously with 50 μL of a 5 × 10⁶ SW1990 cell suspension near the right dorsal forelimb[17]. From day 5 post-injection, the mice were monitored every two days for general health, weight, and tumor growth. The tumor size was measured using a caliper, and the volume was calculated (volume = 1/2 × longest diameter × shortest diameter2). The mice were observed until the tumors exceeded 2 cm, skin ulceration occurred, or their health worsened. Euthanasia was induced by cervical dislocation, followed by dissection and tumor measurements.
L-lactate was purchased from Shengon Biotech (Shanghai, China), and α-cyano-4-hydroxycinnamic acid (CHC) was purchased from Adooq Bioscience (Irvine, CA, United States).
Total RNA was extracted from the cells using TRIzol cell lysis reagent according to the manufacturer's instructions. Following quantification, first-strand cDNA synthesis was carried out for 15 min at 37 °C and 5 s at 85 °C using the PrimeScript RT Kit (Takara, Shiga, Japan) with 1 μg of total RNA for each sample. Subsequently, RT-PCR was conducted to detect the gene expression of these newly synthesized cDNAs. The primer sequences utilized are provided in Supplementary Table 1. The specific procedure involved conducting experiments in a reaction volume of 20 μL, with PCR cycling consisting of an initial denaturation at 95 °C for 30 s followed by 40 cycles of denaturation at 95 °C for 5 s and annealing/extension at 60 °C for 30 s. The data were then analyzed by comparing the cycle threshold values, and normalization was performed using the reference gene ACTIN.
Total protein was extracted from cells with RIPA buffer and quantified using BCA. Electrophoresis was run at 120 V until bromophenol blue reached the bottom of the gel. The proteins were transferred onto a polyvinylidene fluoride membrane in a 'sandwich' setup, followed by blocking and overnight incubation with primary antibodies. After incubation with a secondary antibody, chemiluminescence was detected using an imaging system to record the bands. The following antibodies were used: Anti-L-lactyl lysine (PTM BioLab, China), anti-SLC16A1 (Abcam, United Kingdom), and anti-tubulin (ProteinTech, Shangai, China).
After reaching the desired confluence, the cells on glass coverslips were fixed with 4% paraformaldehyde for 15 min at room temperature. After fixation, the cells were permeabilized with 0.1% Triton X-100 for 10 min and blocked with 5% bovine serum albumin in phosphate-buffered saline (PBS) for 1 h to reduce non-specific binding, Followed by overnight incubation at 4 °C with primary antibodies in blocking solution. After washing with PBS, cells were incubated with fluorochrome-linked secondary antibodies for 1 h in the dark at room temperature. Nuclei were stained with 4′,6-diamidino-2-phenylindole for 5 min, and coverslips were mounted on slides using anti-fade medium. Fluorescence signals were imaged using a confocal microscope.
Cells in a 6 cm dish were cultured to 70%–80% confluency and detached using trypsin-ethylenediaminetetraacetic acid, and the pellet was ultrasonicated for lysis. Intracellular lactate was measured using Lactic Acid Detection Kits (Nanjing Jiancheng Bioengineering Institute, Nanjing, China) following the manufacturer's instructions. Lactate values were normalized to the protein concentration for consistency.
First, cells were suspended in 10% FBS and seeded in a six-well plate. The cells were cultured for 10–14 d until visible single-cell clones of more than 50 cells were formed. The cells were fixed with 4% paraformaldehyde for 20 min, stained with 0.1% crystal violet for 20 min, and photographed under a microscope.
In corning transwell migration assays, 2 × 10⁴ cells in 1% FBS medium were seeded in the upper chamber, while 800 μL of 10% FBS medium was added to the lower chamber. After 24–48 h of incubation, the cells in the upper chamber were fixed with 4% paraformaldehyde for 20 min and stained with 0.1% crystal violet for 20 min. After washing with PBS, non-migrated cells were removed using a cotton swab. Images of migrated cells on the lower surface were captured in five random fields and analyzed using ImageJ software.
Once the pancreatic cancer cells reached 100% confluence in the culture wells, they were transferred to a serum-free medium. A scratch was made in each well using a pipette tip, and cell migration was photographed at 0, 24, and 48 h using a microscope. Migration data were analyzed using the ImageJ software.
All data analyses and visualizations were performed using R software. For non-normally distributed data with uncertain variance, group differences were analyzed using the Wilcoxon rank-sum test. Cox regression models were used for both the univariate and multivariate analyses. Survival differences were evaluated using the log-rank test. A P value less than 0.05 indicates significant differences, while values < 0.01 denote highly significant differences.
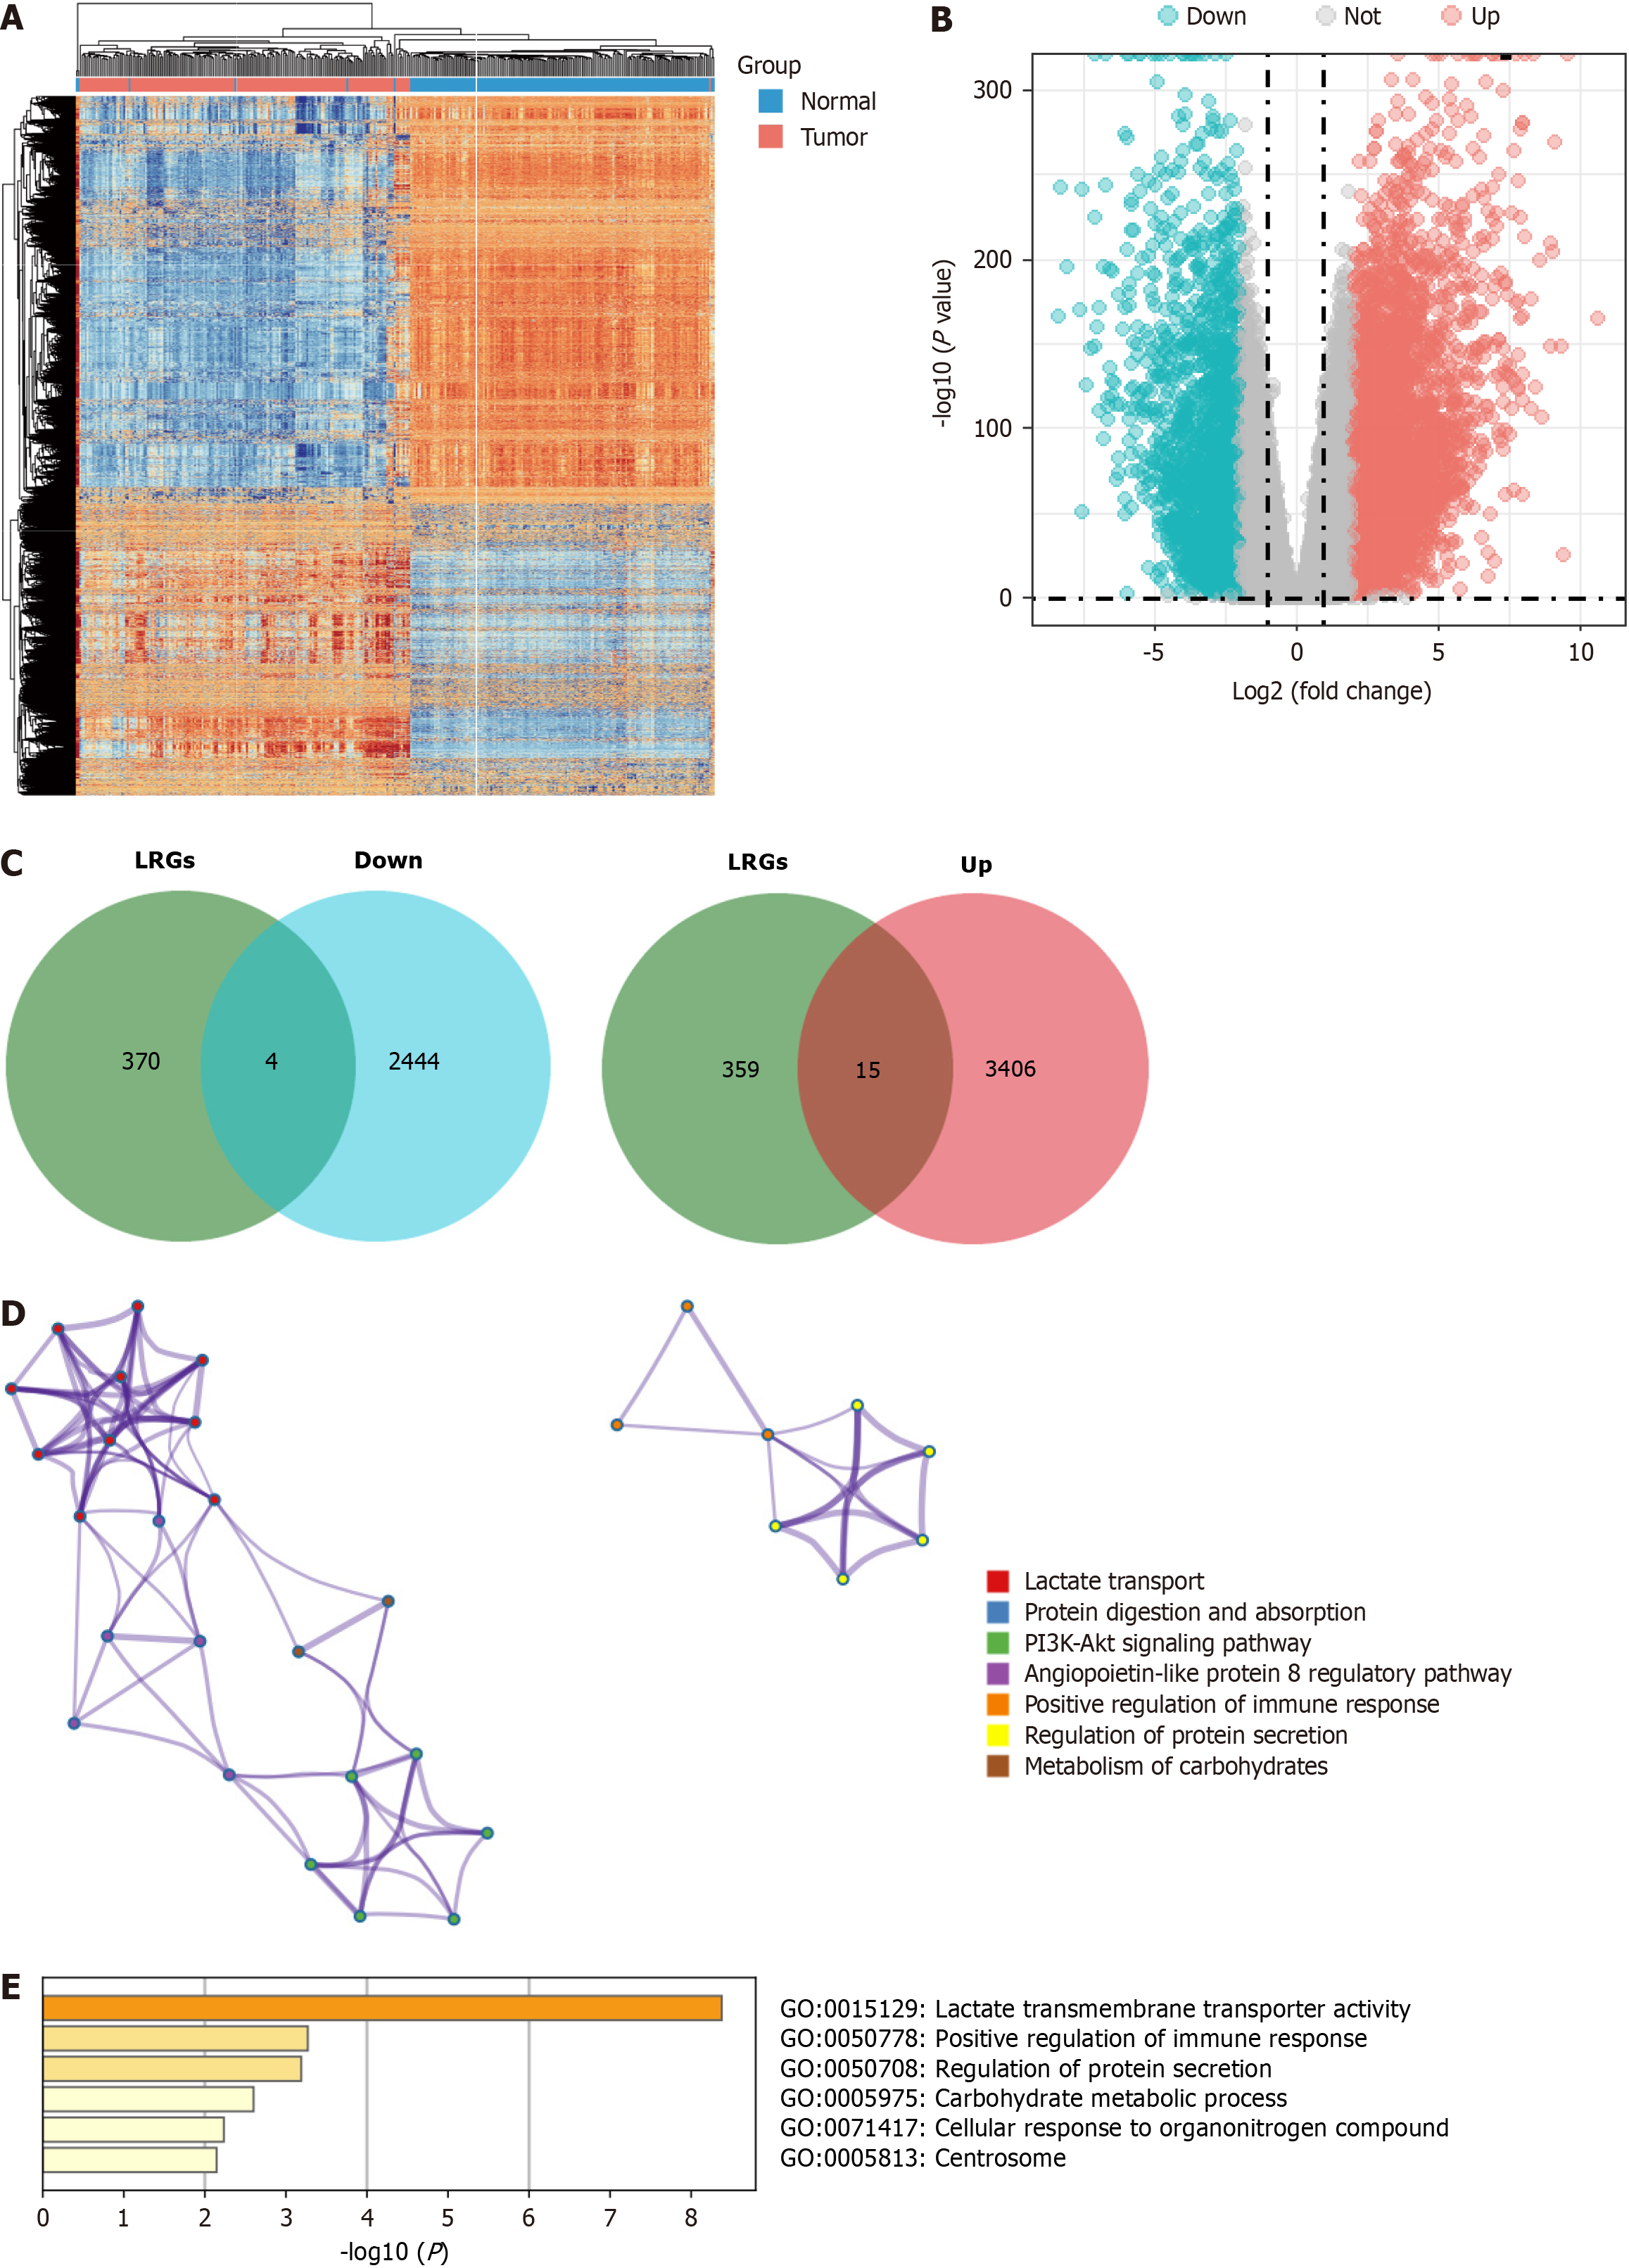
First, we used the DESeq2 algorithm to identify the DEGs in PDAC. By comparing tumors with normal tissues, 48209 DEGs were identified in a cohort of 177 tumors and 172 normal tissues from the GTEx-TCGA dataset, including 3421 upregulated and 2448 downregulated genes. We discuss the differential gene expression profiles using a heatmap and volcano plot (Figure 1A and B). The intersection genes were identified between DEGs and the lactylation-related gene set using a Venn diagram, revealing four downregulated genes (B3GALNT2, COX6A2, GYS2, and ALDOB) and 15 upregulated genes (SLC16A1, SLC16A3, SLC5A12, ABCG8, CFH, COL4A1, HLA-DRB1, KCNN4, KIF23, PIK3CG, SLC7A7, HPDL, MT-TC, PCK1, and SLC52A1) that form LRGs (Figure 1C). Functional enrichment analyses conducted using the Metascape database revealed that LRGs were closely related to lactate transport, immune response regulation, and the potential association between LRGs and L-lactyl (Figure 1D and E).
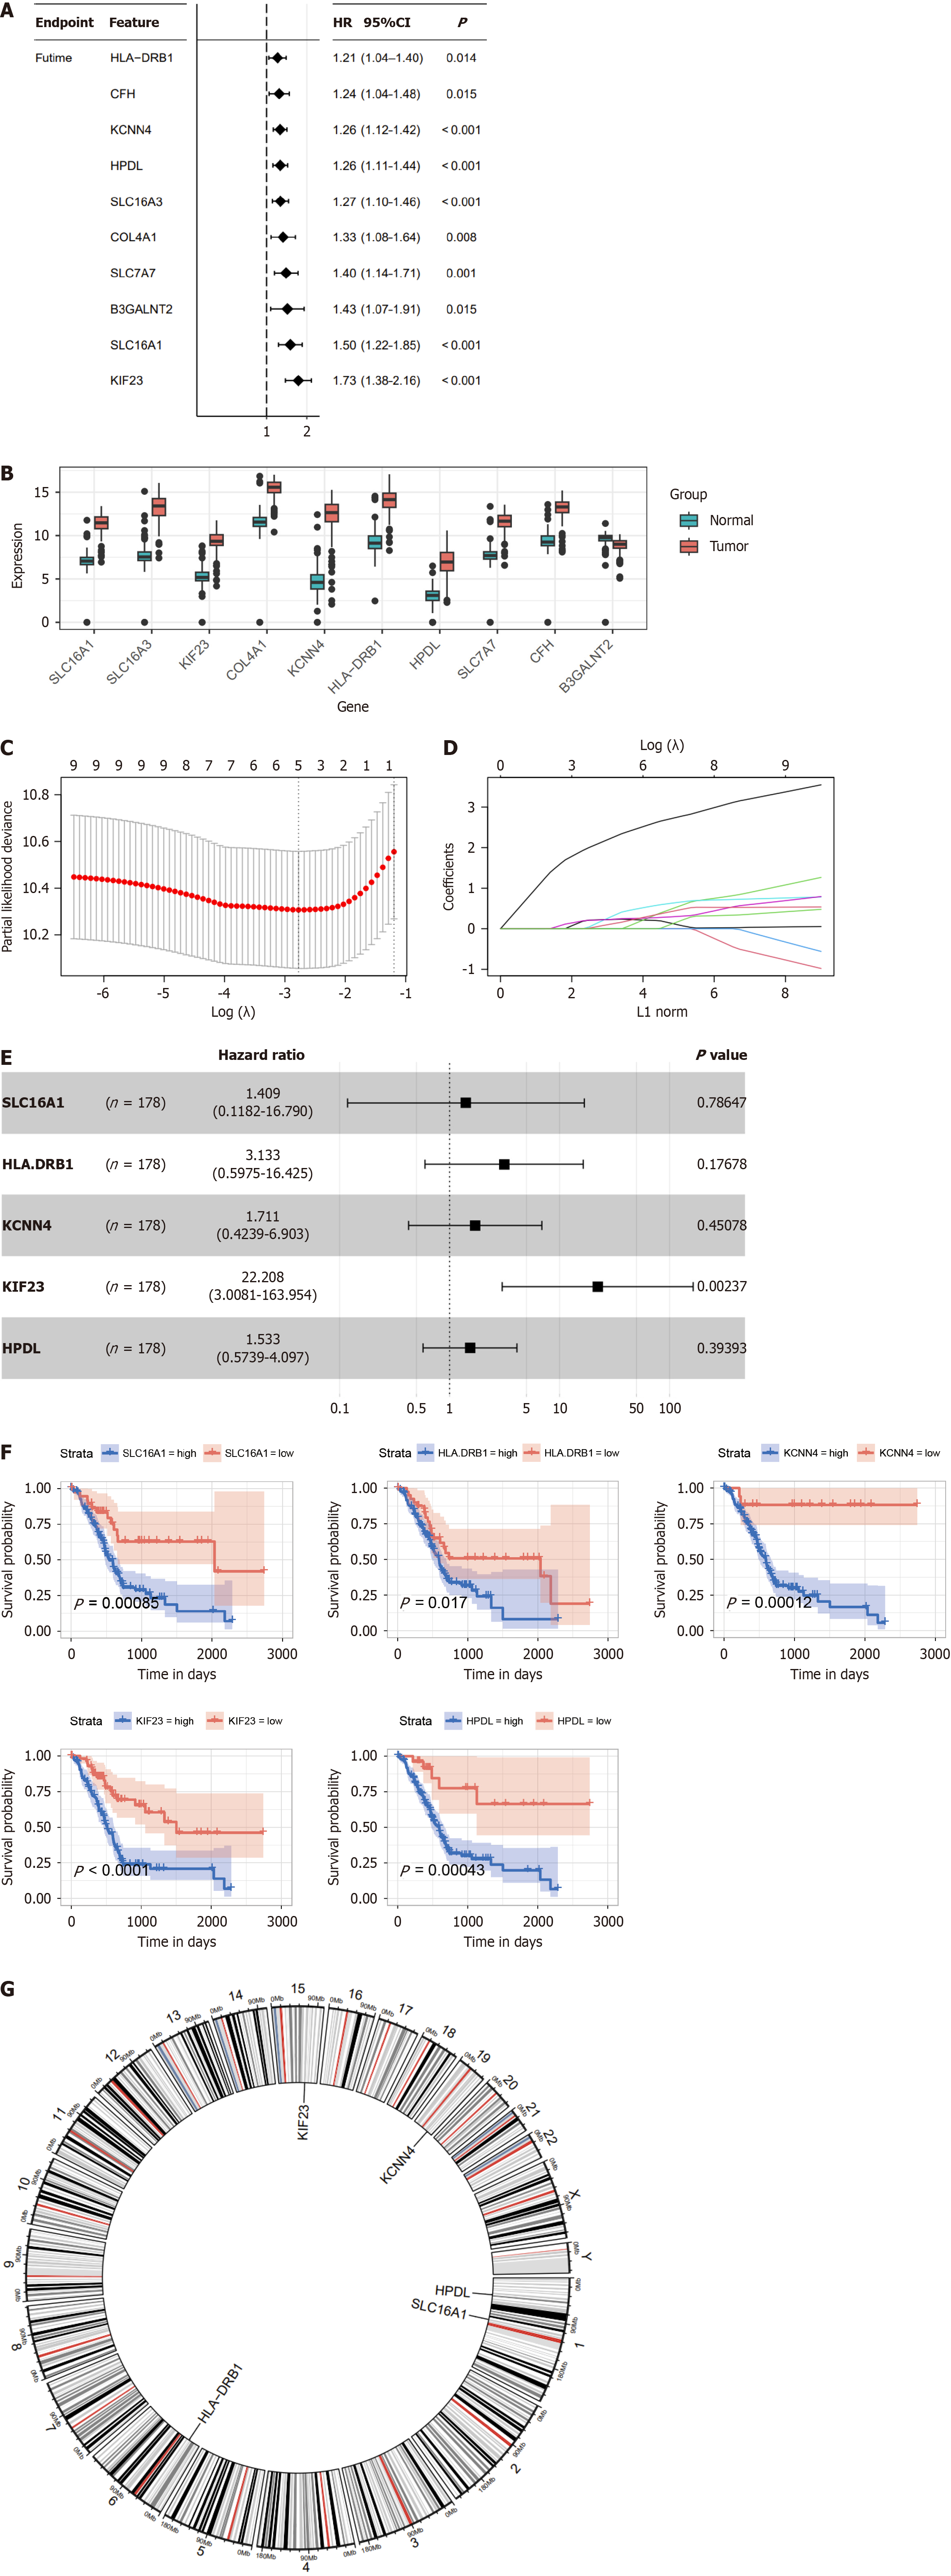
We performed univariate Cox regression analysis to fit the expression data of the 19 LRGs with prognostic survival data and to delete redundant genes with high collinearity to determine specific LRGs with prognostic significance in PDAC. We identified 10 LRGs with potential prognostic value and compared their expression patterns between tumor and normal tissues (Figure 2A and B). Only five genes (SLC16A1, HLA-DRB1, KCNN4, KIF23, and HPDL) were further screened using LASSO regression Cox analysis, subjected to multivariate Cox regression analysis, and represented as a forest plot (Figure 2C–E). Further analysis revealed that the OS curve was associated with lactylation-related prognostic genes (Figure 2F). High expression levels of these five genes (SLC16A1, HLA-DRB1, KCNN4, KIF23, and HPDL) are integrally linked to the poor prognosis of PDAC. Additionally, a circular plot was constructed to demonstrate the chromosomal locations of the five prognostic LRGs (Figure 2G).
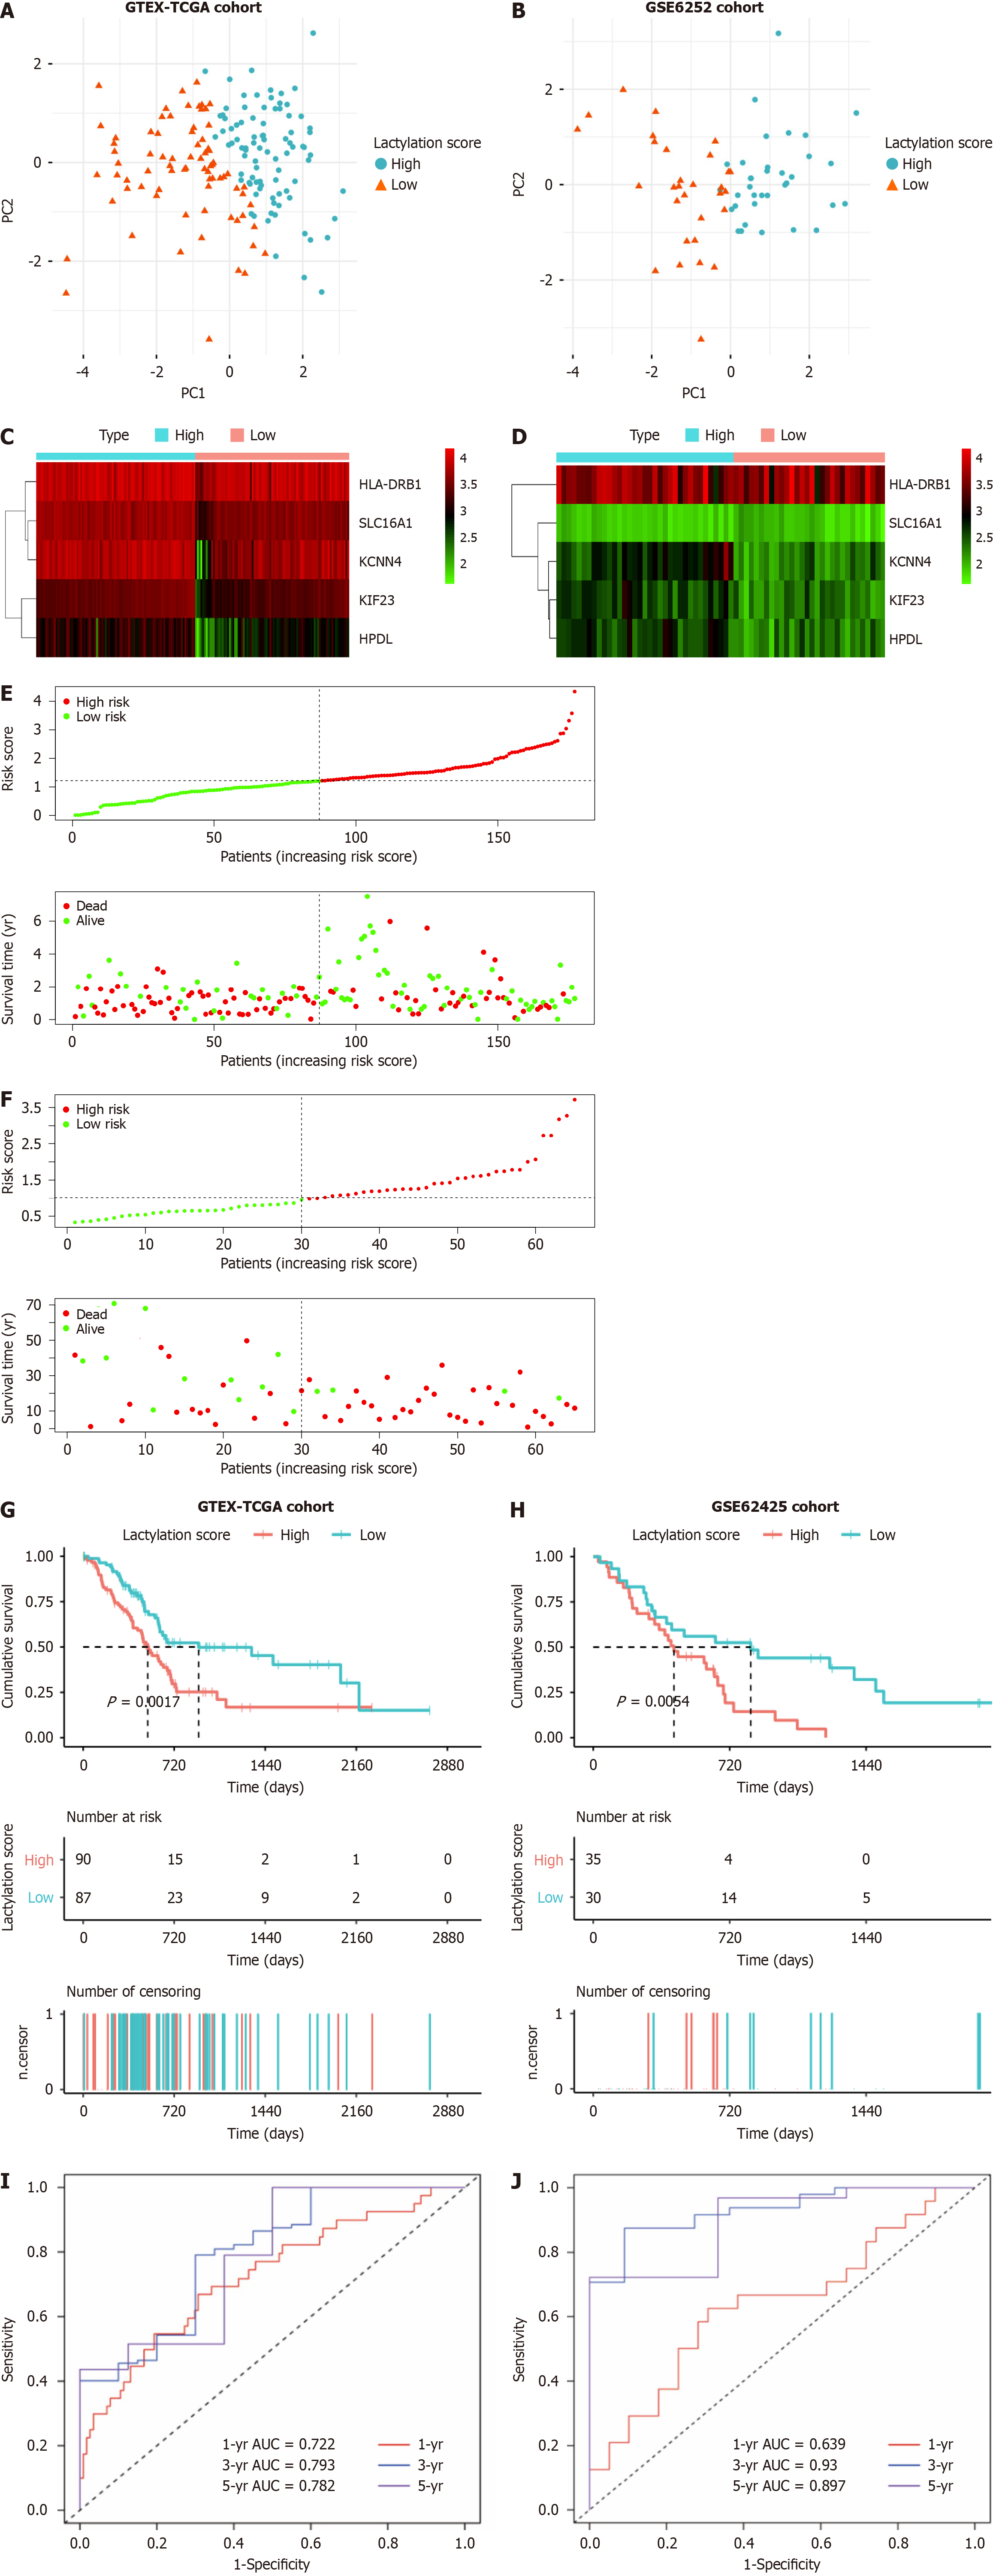
For further robustness, we used an external dataset (GSE62452) as a validation cohort to confirm the universality of prognostic signatures derived from the primary training cohorts. Patients with PDAC were stratified into two subgroups based on the median lactylation score: A high lactylation score group and a low lactylation score group. Principal component analysis was used to determine the accuracy of the subgroups (Figure 3A and B). A heatmap further illustrates the differential expression of prognostic LRGs between the two defined subgroups (Figure 3C and D). The lactylation score and survival status of each patient in the cohorts displayed in the distribution plots indicated a notable trend: An increase in patient mortality correlated with higher lactylation scores (Figure 3E and F). Furthermore, Kaplan-Meier survival analyses revealed that the high lactylation score group had poorer outcomes than that in the low lactylation score group in both the training and validation cohorts (Figure 3G and H). Based on the area under curve (AUC), our lactylation-related model predicted values for 1-, 3-, and 5-year OS in the training cohort with the predictive accuracy 0.722, 0.793, and 0.782, respectively. In contrast, the validation cohort exhibited AUC values of 0.639, 0.930, and 0.897, respectively (Figure 3I and J). These values underscore the high predictive accuracy and reliability of the prognostic signatures.
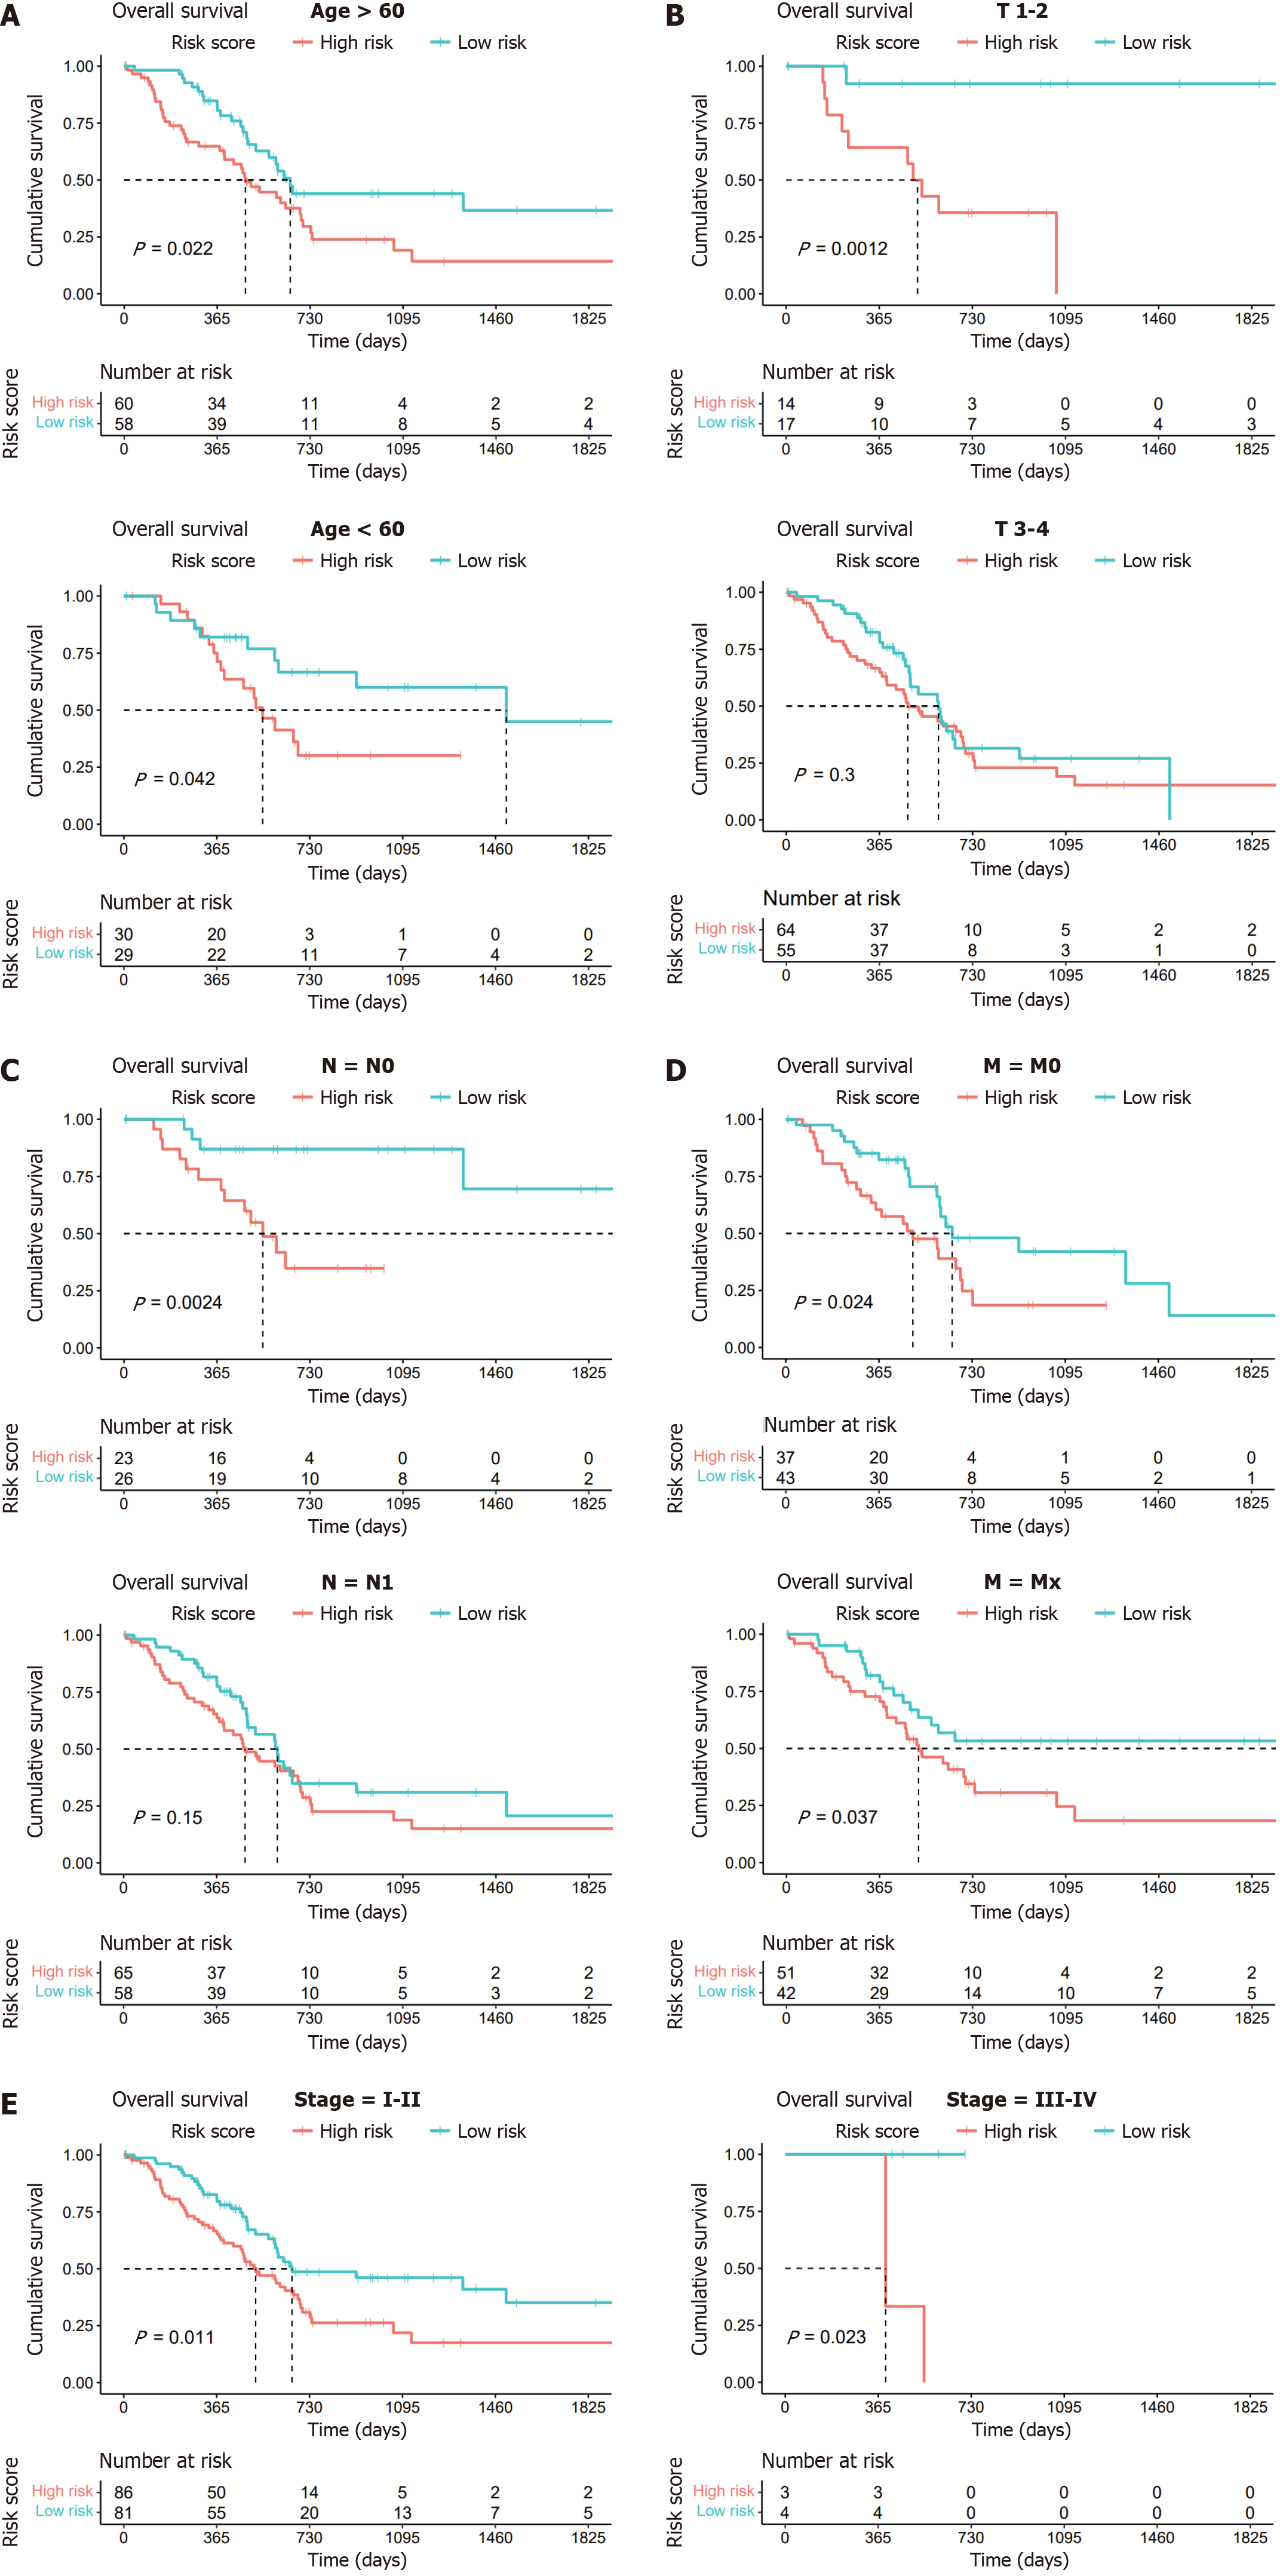
Given the established predictive value of our model for clinical outcomes in pancreatic cancer, we extended our investigation to explore the correlations between lactylation score and various clinical features using stratified and Cox regression analyses to assess the accuracy of the lactylation-related model and predict patient outcomes. Based on different clinical characteristics, we divided the patients into distinct subgroups, including age (> 60 years and ≤ 60 years), T stage (T1–2 and T3–4), N stage (N0 and N1), M stage (M0 and Mx), and stage (stages I–II and III–IV). Kaplan-Meier survival analysis was conducted for each subgroup, revealing that patients in the high lactylation score group consistently exhibited a poorer prognosis across all subgroups (Figure 4).
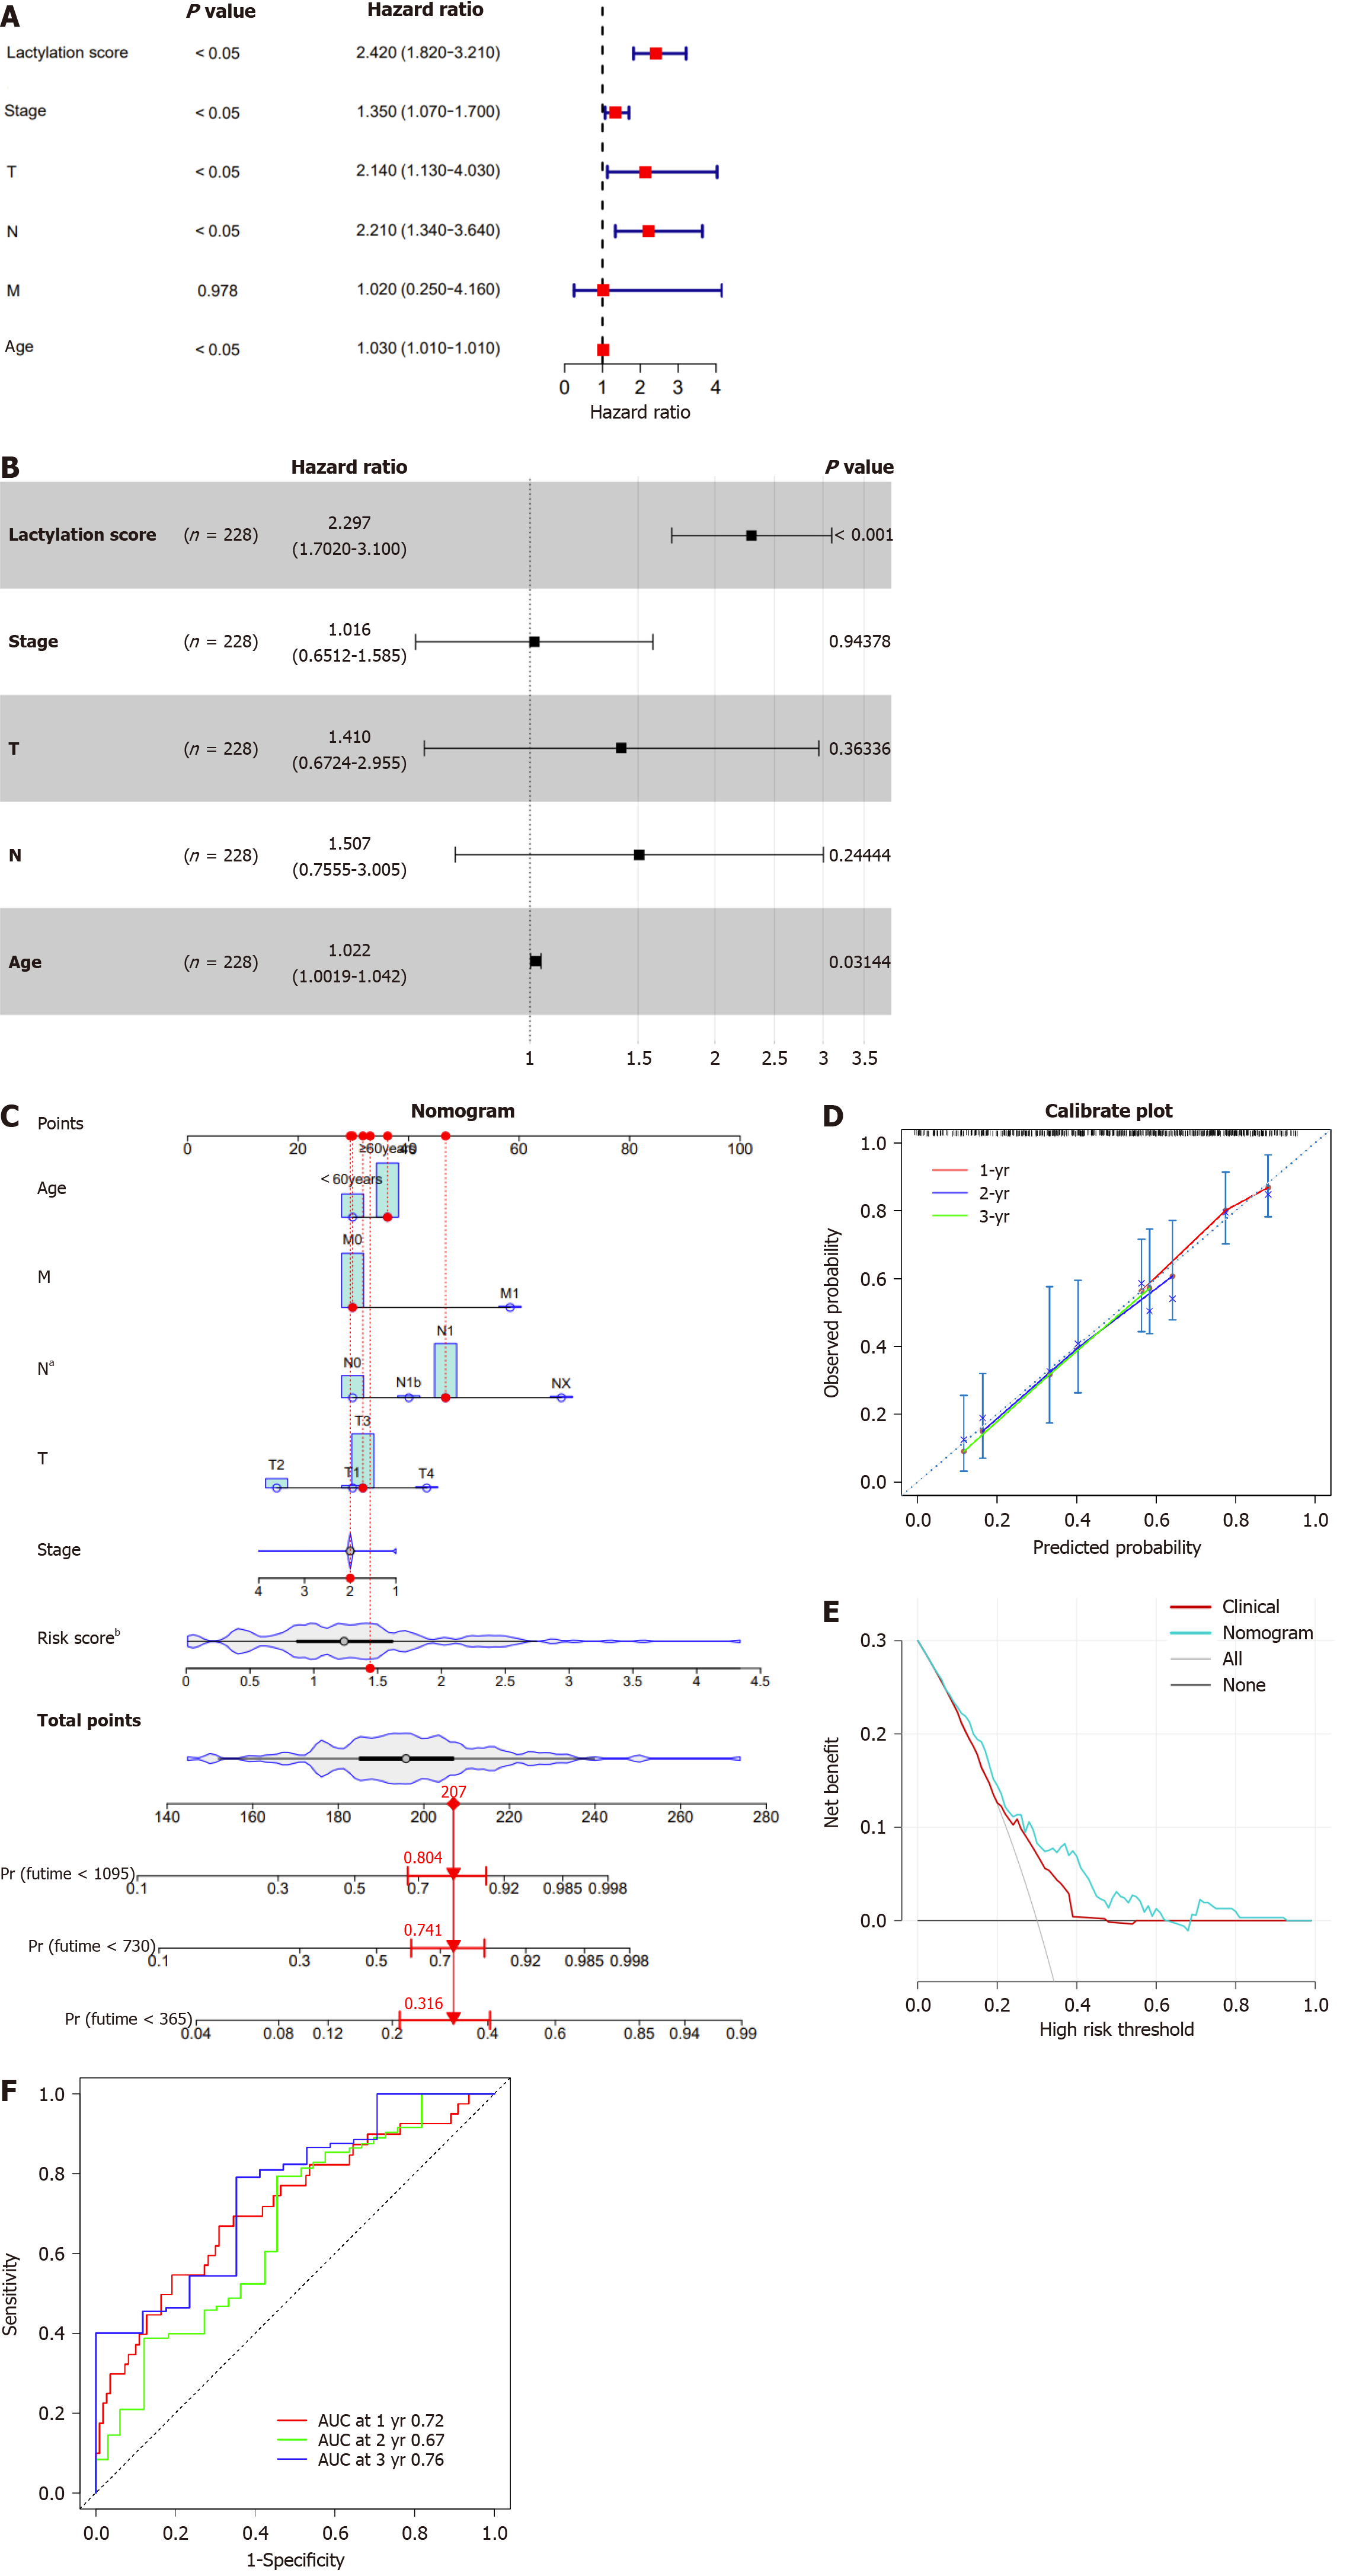
In summary, the lactylation signature demonstrated notable efficacy in prognostic forecasting of various clinical features in patients with pancreatic cancer. However, it is imperative to further explore whether lactylation score can be considered an independent prognostic factor for survival outcomes. Subsequently, we performed univariate and multivariate Cox regression analyses for lactylation score, stage, T, N, and M stages, and age, and visualized the results using a forest plot. In the univariate Cox regression analysis, the lactylation score, stage, T and N stages, and age were significantly associated with the prognosis of patients with PDAC (P < 0.05; Figure 5A). Based on the univariate Cox regression analysis results, multivariate Cox regression analysis revealed that the lactylation score and age were independent risk factors affecting the prognosis of patients with PDAC (Figure 5B). Furthermore, the above results indicated that the lactylation score was an independent prognostic risk factor for OS (hazard ratio = 2.297, 95%CI: 1.702-3.100, P < 0.001), playing a crucial role in PDAC.
By incorporating the lactylation score and clinical features, including age, sex, tumor, node, and metastasis staging, we constructed a nomogram to estimate patient outcomes at 1-, 2-, and 3-year intervals (Figure 5C). A calibration curve was used to check the predictive accuracy of the nomogram and showed a close match between the predicted and observed outcomes (Figure 5D). Decision curve analysis demonstrated that the nomogram offered greater clinical benefits than the prognostic estimates based solely on clinical characteristics (Figure 5E). Moreover, the ROC curve revealed that our nomogram performed well in differentiating the outcomes, with AUC values for the 1-, 2-, and 3-year predictions of 0.72, 0.67, and 0.76, respectively (Figure 5F). These results demonstrated the robustness of the nomogram for predicting OS. Consequently, we conclude that the lactylation score may serve as a reliable independent prognostic indicator for pancreatic cancer.
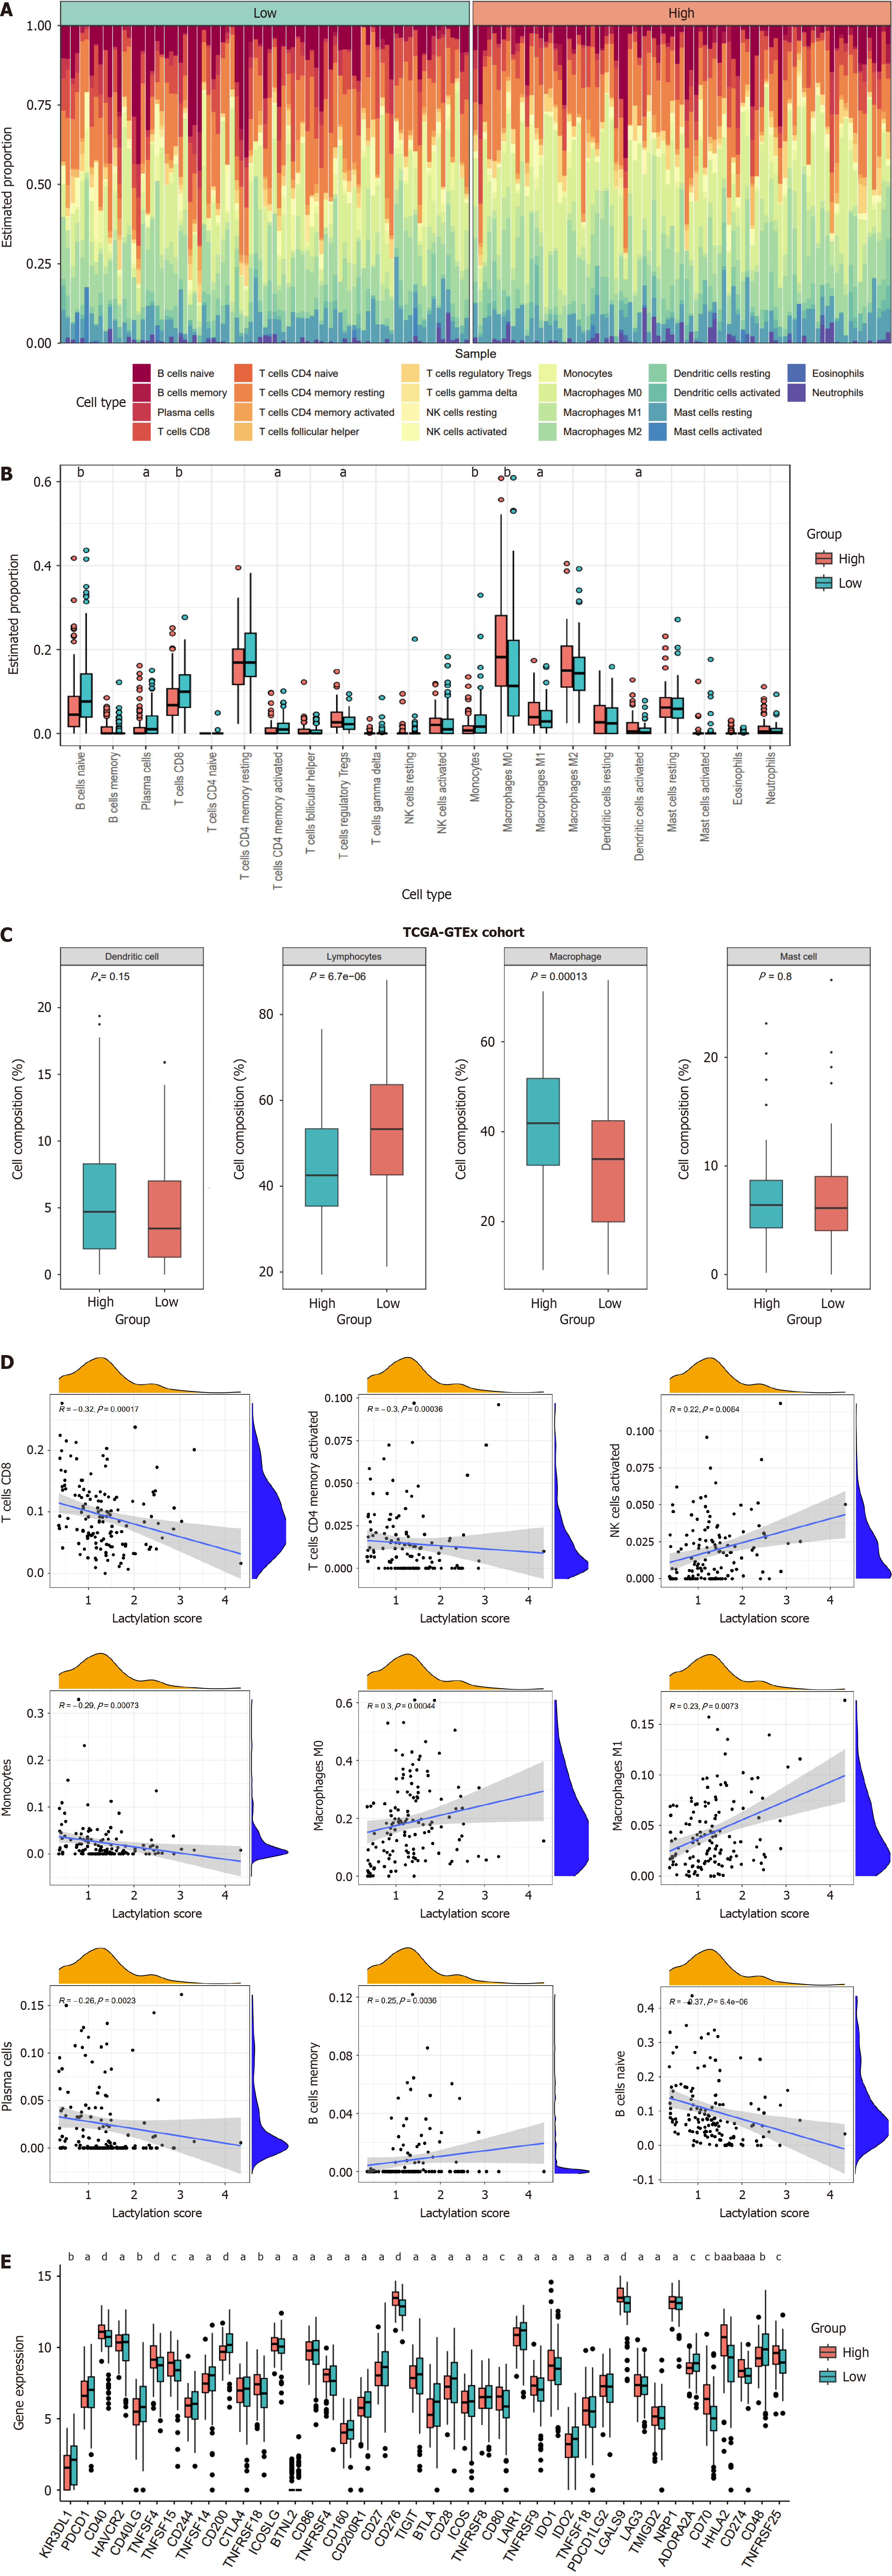
In pancreatic cancer, the tumor immune microenvironment, influenced by the lactylation score, affects tumor proliferation and spread. We calculated the degree of infiltration of 22 immune cell types using the “CIBERSORT” algorithm. Both the heatmap and boxplot illustrated the immune infiltration landscape, distinguishing the two subgroups (Figure 6A and B). The high-scoring group had increased numbers of Tregs, M0 and M1 macrophages, and activated dendritic cells; the low-scoring group had more naïve B cells, plasma cells, CD8+ and CD4+ memory T cells, and monocytes. Drawing on previous studies, we categorized the immune cells into four primary clusters and analyzed the variance in these classifications between the two subgroups (Figure 6C). The result revealed a higher prevalence of macrophage-type immune cells in the high lactylation score group; the low lactylation score group was enriched in lymphocyte-type immune cells. We investigated the correlation between the lactylation score and immune cell infiltration (Figure 6D). There was a positive association between the lactylation score and immune cells such as activated natural killer cells, M0 and M1 macrophages, and memory B cells. Thus, higher lactylation scores in PDAC were associated with increased macrophage and Treg infiltration, and reduced CD8+ T cells, highlighting the oncogenic and immunosuppressive roles of lactylation.
We investigated how immune checkpoint expression correlated with subgroup classification in PDAC to predict immunotherapy response (Figure 6E). Significant differences in immune checkpoint expression were observed between high- and low-lactylation groups. Most immune checkpoint inhibitors (ICI), such as CTLA4, TIGIT, CD86, CD28, BTLA, CD27, ADORA2A, IDO2, and CD200R1 were higher in the low-scoring group, indicating that patients with low lactylation scores may respond better to immunotherapy and achieve more favorable clinical outcomes.
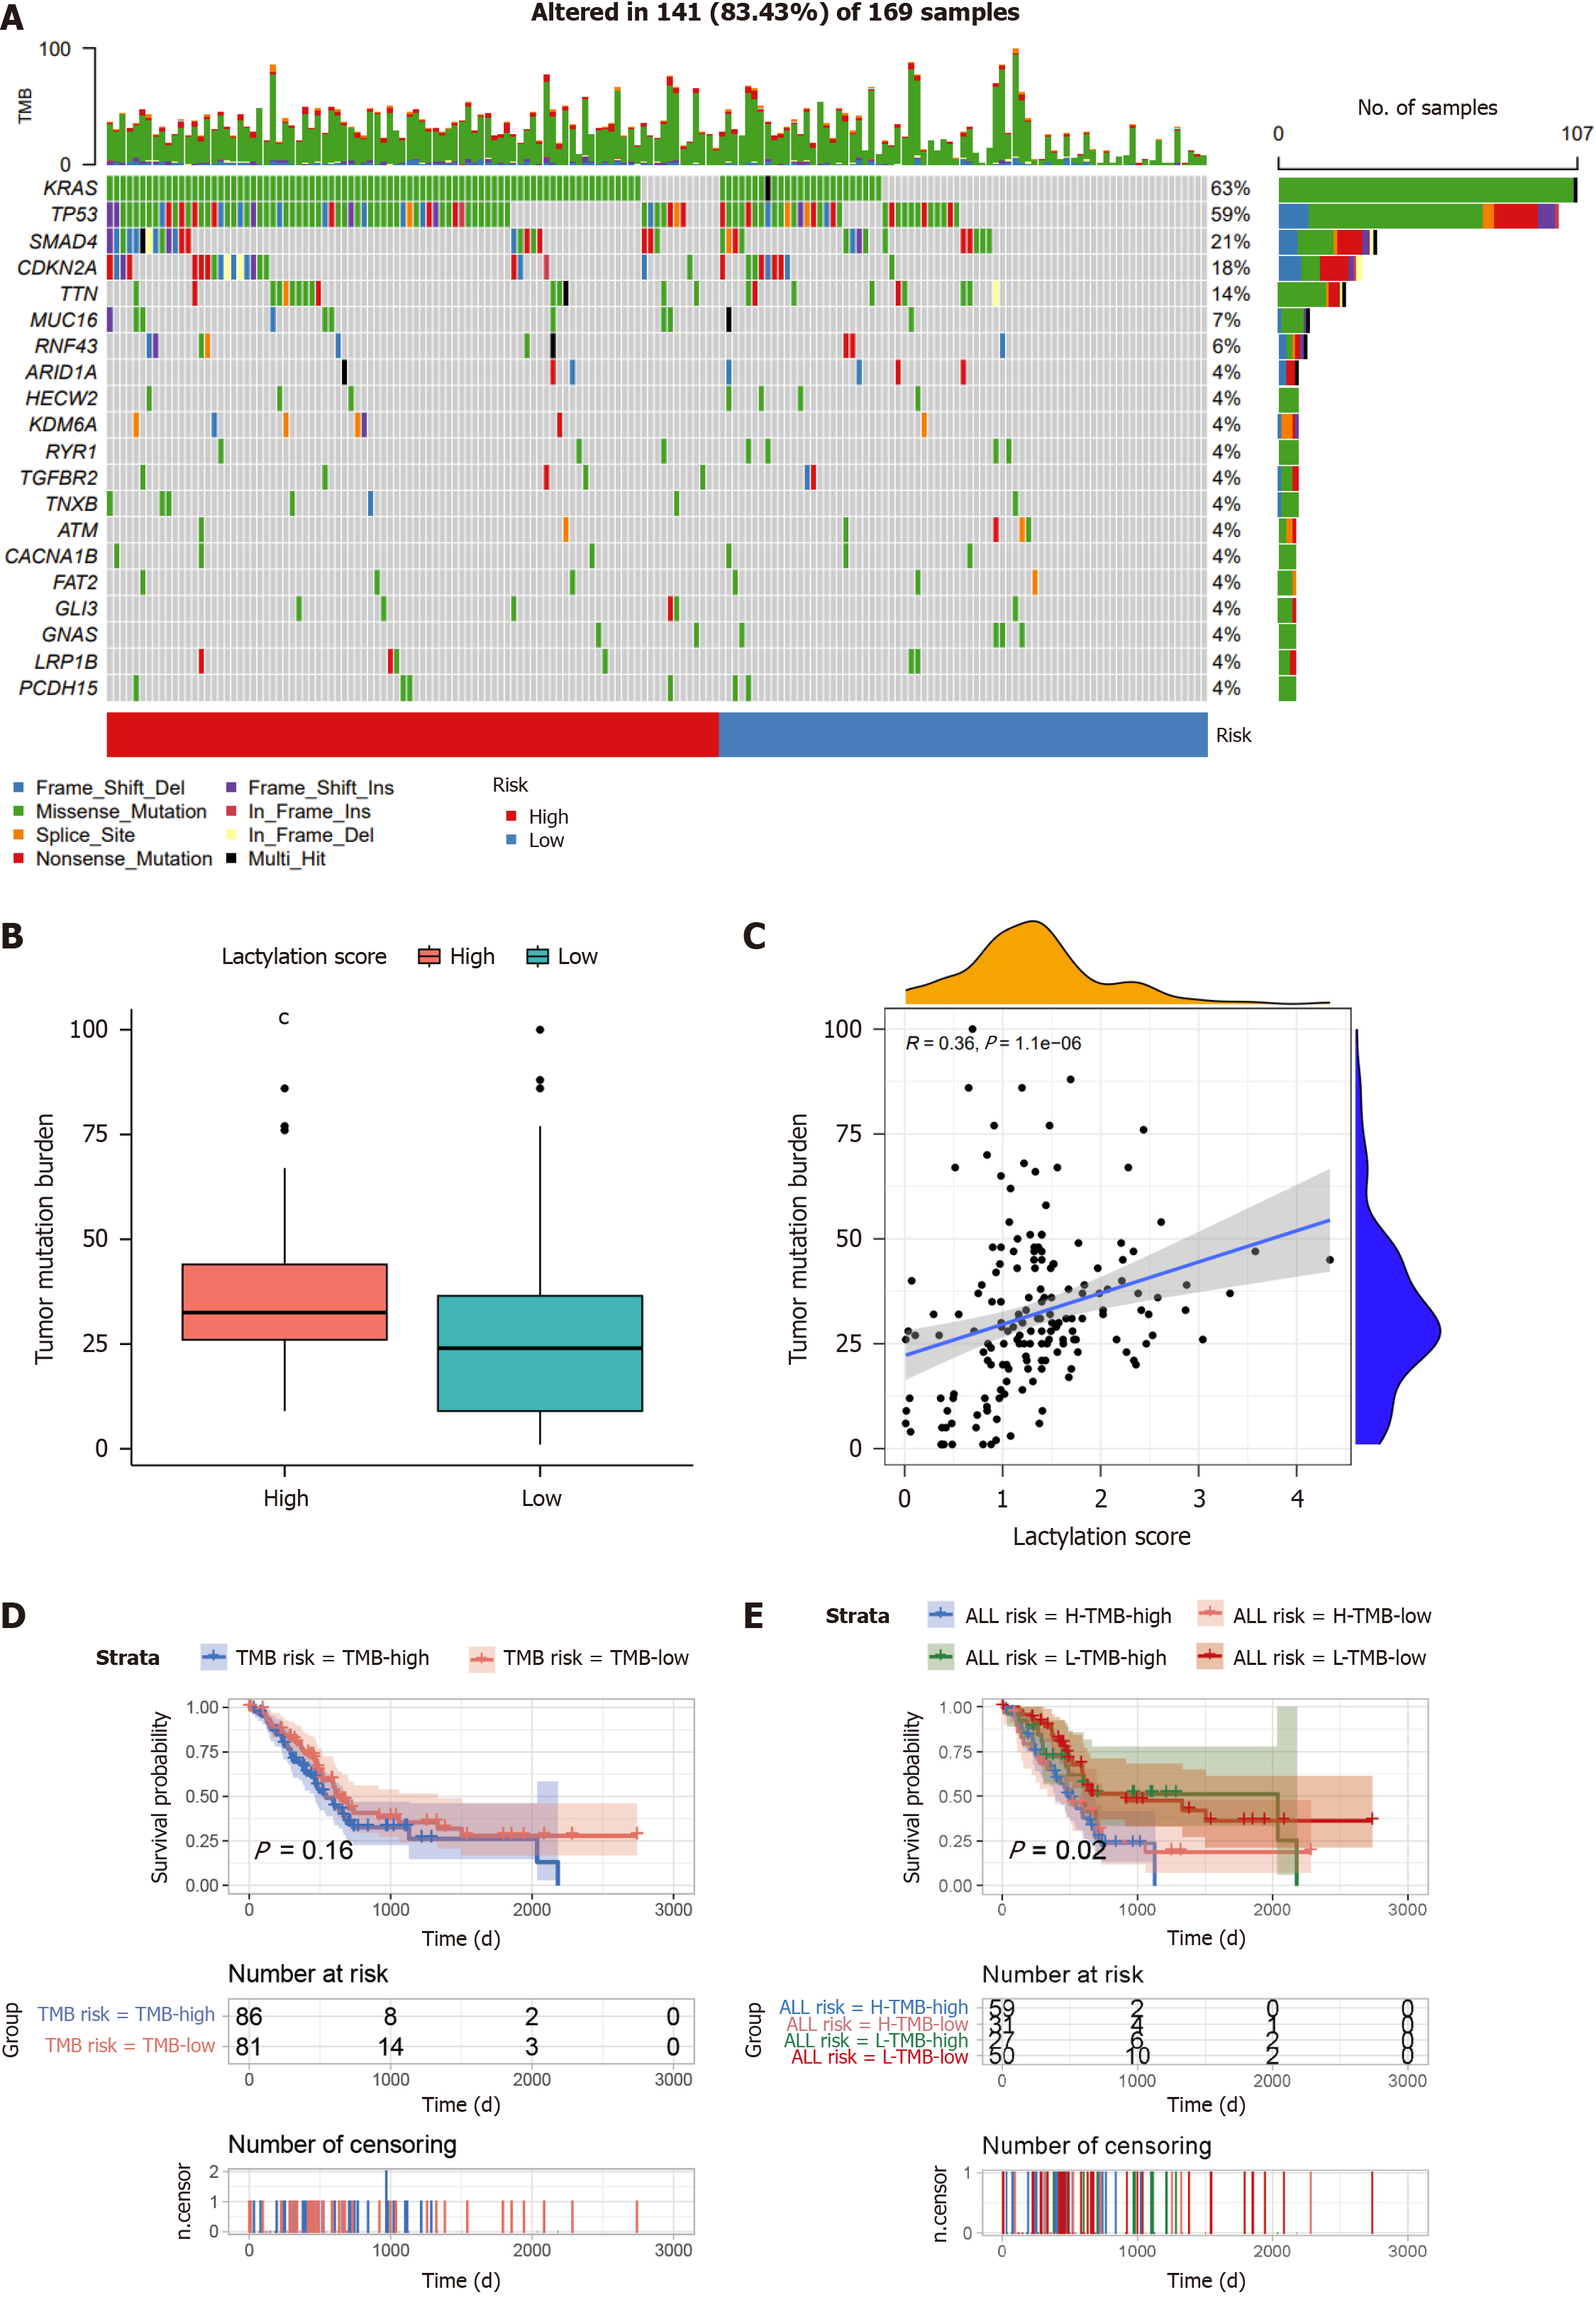
Waterfall plots revealed the mutation landscape in PDAC subgroups based on lactylation scores (Figure 7A). The top five genes were KRAS, TP53, SMAD4, CDKN2A, and TTN, particularly in the high-scoring group. Tumor mutational burden (TMB), which indicates potential immunotherapy benefits, was assessed in each PDAC case. As illustrated in the graph, TMB in the high-scoring cluster was elevated compared to that in the low-scoring cluster (Figure 7B), with a significant positive correlation between TMB and the lactylation score (Figure 7C). Subsequent Kaplan-Meier analyses evaluated OS based solely on tumor microenvironment (TME) grouping and lactylation score categorization. The results within the GTEx-TCGA cohort showed that the difference in OS between patients with high (TMB-high) and low TMB (TMB-low) levels was not substantial (Figure 7D). However, patients with both high TMB and lactylation scores (H-TMB-high) exhibited a markedly shorter OS than their counterparts with low TMB and lactylation scores (L-TMB-low) (Figure 7E).
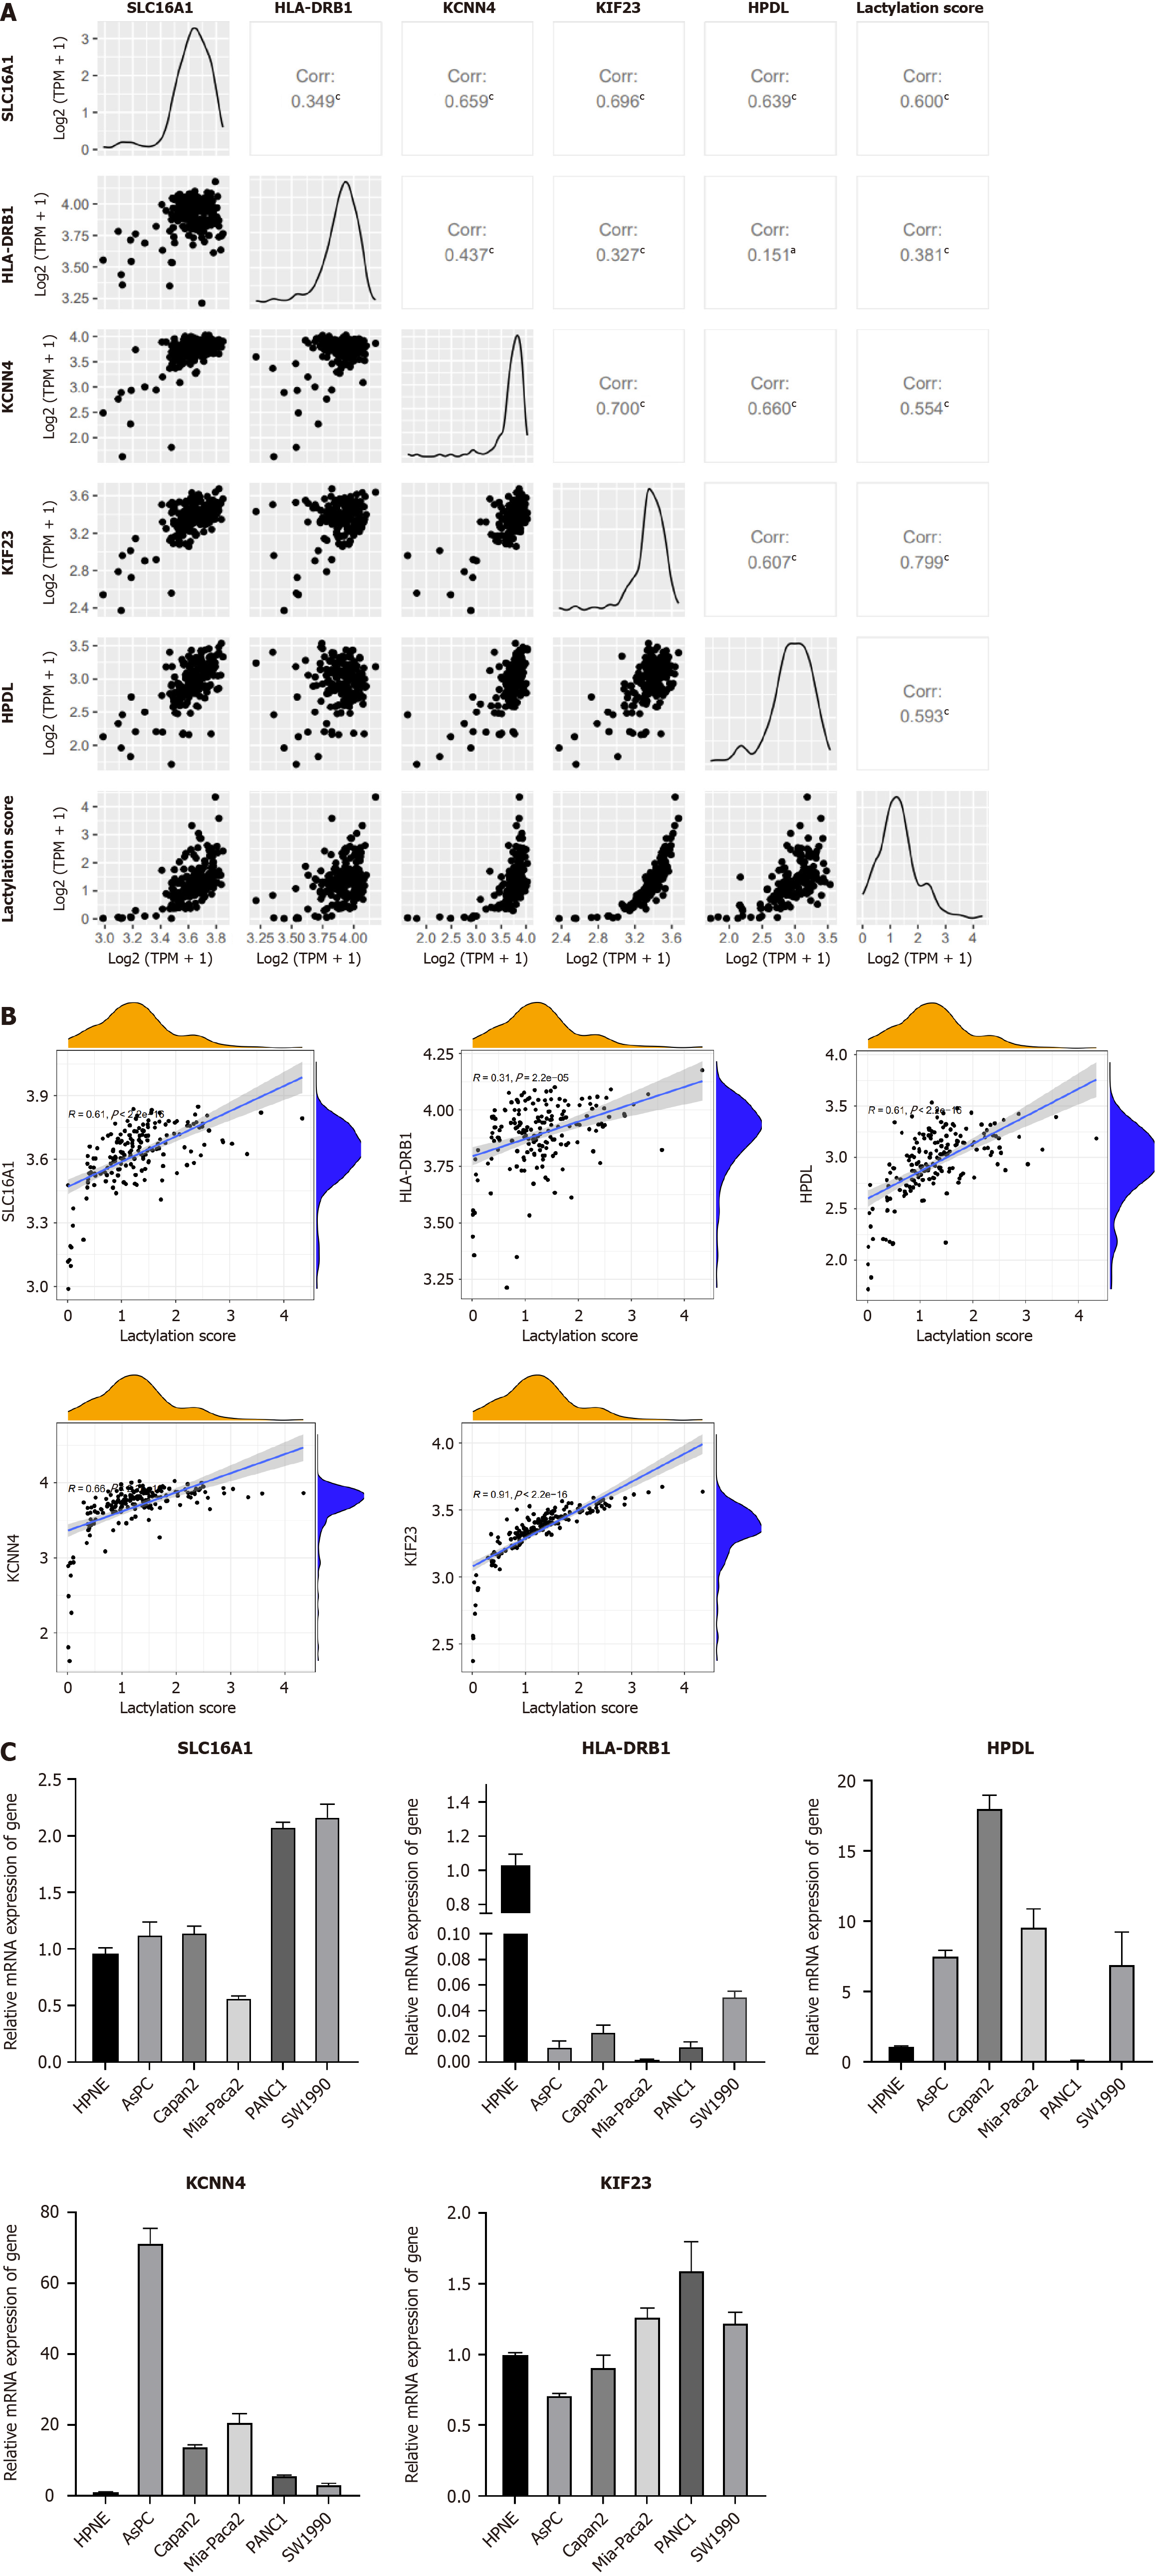
Using the R package of “GGally,” we performed the comprehensive correlation analysis to investigate the intragroup relationship within LRGs and their intergroup associations with lactylation scores (Figure 8A and B). A strong positive correlation was observed among these factors. Using RT-PCR, we quantified LRG expression in the normal pancreatic ductal cell line, HPNE, and five PDAC cell lines (Figure 8C). Differential expression of each gene was observed in different pancreatic ductal cell lines. However, the expression of HLA-DRB1 was not detected in PDAC cell lines, suggesting that it is selectively expressed in specific cell lines.
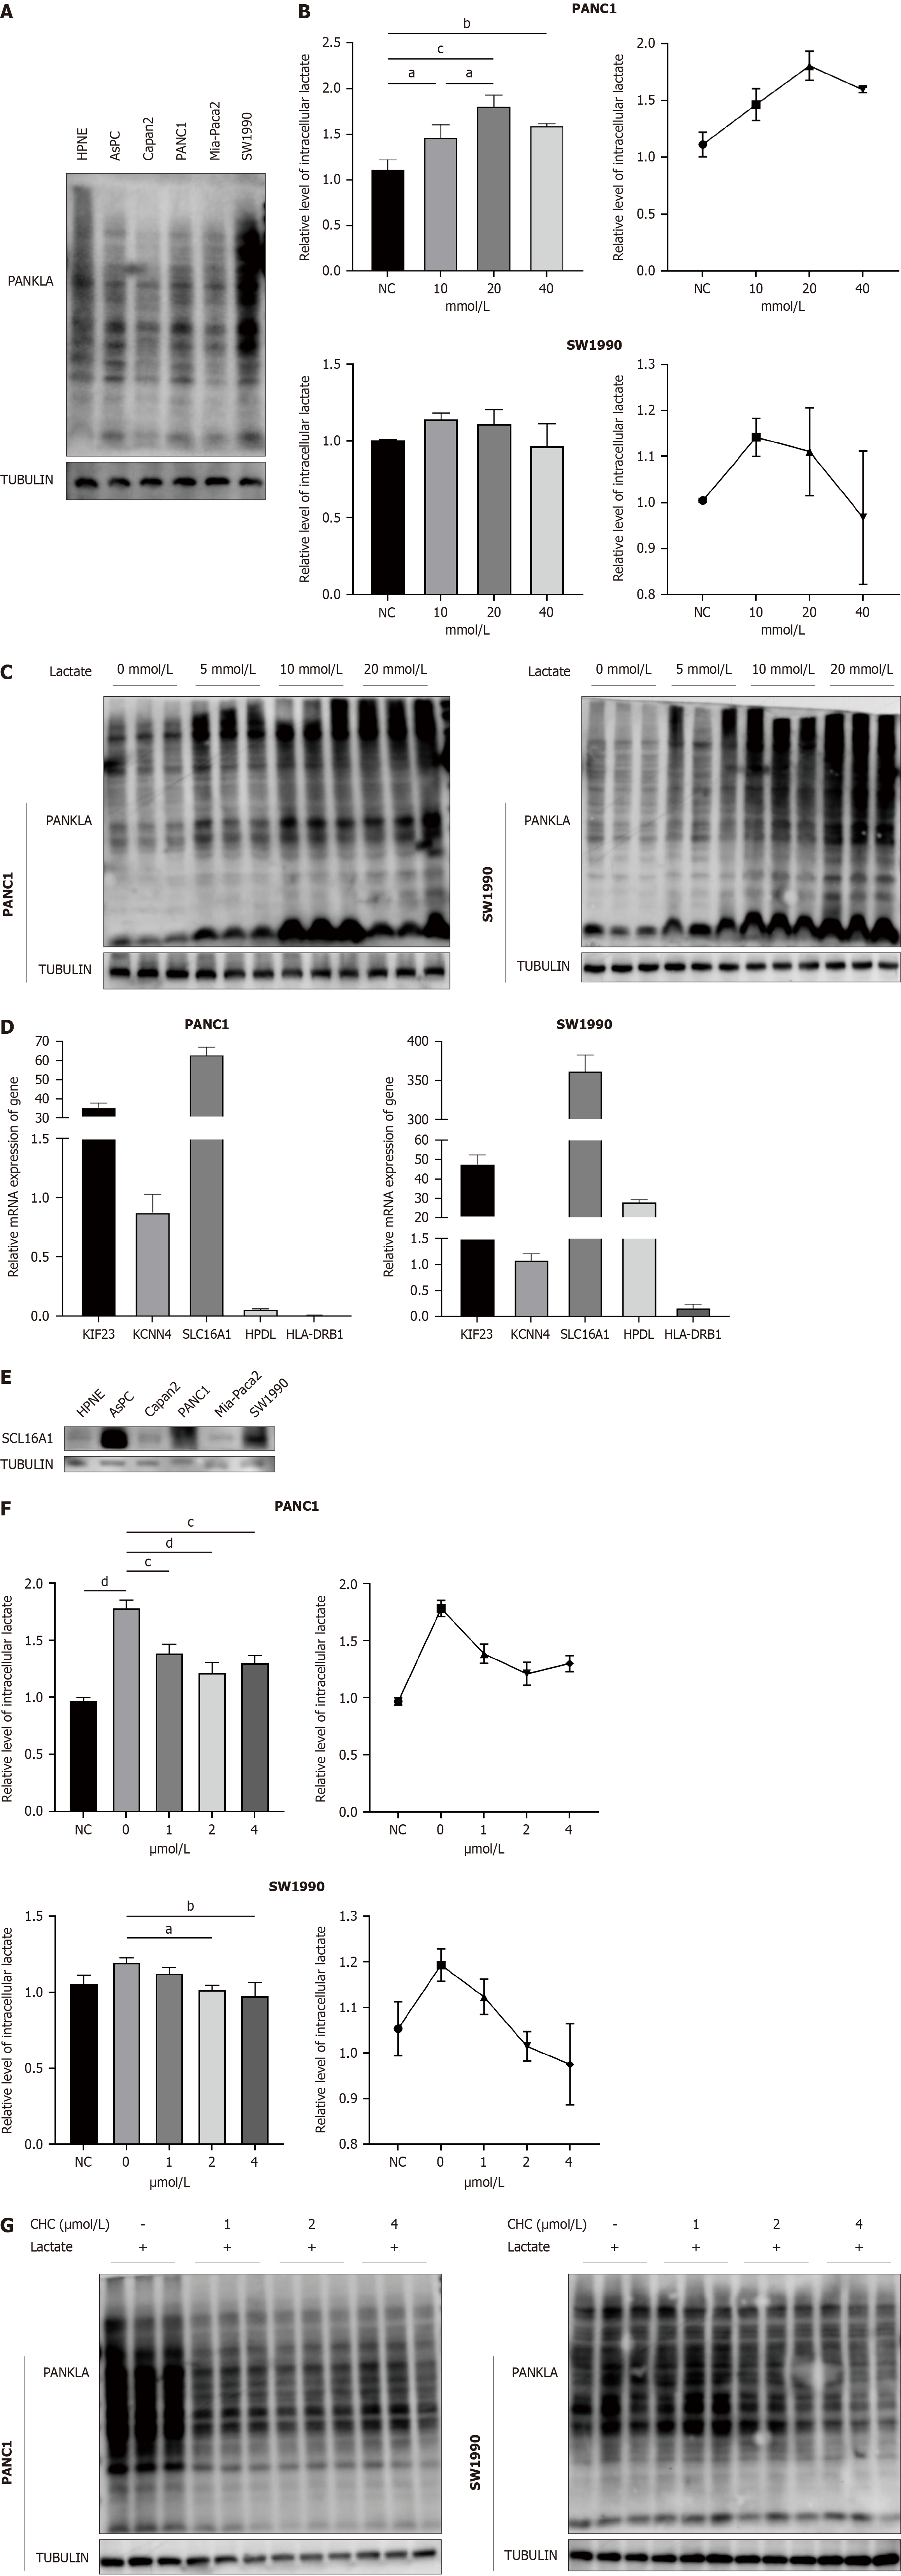
To investigate the role of lactylation in pancreatic cancer, we first performed western blotting to detect L-lactylation levels in six cell lines and observed high levels in PANC1 and SW1990 cell lines (Figure 9A); we selected the two cell lines for further experiments. Building on Zhang et al's study[8] of histone lysine lactylation as a gene expression regulator, we examined intracellular lactate concentrations and L-lactylation levels under various lactate conditions (Figure 9B). The results indicated that moderate lactate elevation (10 and 20 mmol/L) enhanced intracellular L-lactylation levels in PANC1 and SW1990 cell lines, respectively. In contrast, excessively high lactate levels reduced L-lactylation, perhaps due to cellular intolerance to excessively elevated lactate levels. Furthermore, western blotting revealed that lactylation was upregulated with increasing lactate levels (Figure 9C). In summary, lactate can enhance overall lactylation levels in pancreatic cancer.
We used qPCR to assess the expression of all LRGs in the PANC1 and SW1990 cell lines to further investigate the role of LRGs in pancreatic cancer (Figure 9D). SLC16A1 is highly expressed. SLC16A1 (also known as MCT1) is a lactate transmembrane transporter that is crucial for modulating cellular metabolic processes, particularly lactate and glycolysis[18]. Focusing on its association with lactylation, we analyzed its expression in various cell lines using western blotting and observed increased levels in AsPC, PANC1, and SW1990 cells (Figure 9E). To determine whether SLC16A1 is associated with lactylation, we treated PANC1 and SW1990 cells with graded doses of CHC, a known inhibitor of SLC16A1, for 24 h. This treatment led to observable changes in the intracellular lactate levels and lactylation (Figure 9F and G). Our results indicated a dose-dependent decrease in lactate and lactylation, most notably at 1 µM in PANC1 cells and 2 µM in SW1990 cells. Therefore, the relationship between SLC16A1 expression and histone lactylation was investigated. Our experiments demonstrated that lactate enhances histone lactylation at H3K9 and H3K18, which can be attenuated by SLC16A1 inhibition (Figure 9H). Our findings highlight a strong link between SLC16A1 and lactylation, including nonhistone and histone lactylation.
EP300, a key player in enhancing lactylation by transferring the lactyl group from lactyl-CoA to histones or proteins, is inhibited by C646, a p300/CBP inhibitor that affects histone lactylation. Our study investigated how a P300 inhibitor affects lactate-induced lysine lactylation in pancreatic cancer cells and observed that C646 significantly reduced lactate lactylation levels (Figure 10A). To further determine the role of SLC16A1-mediated lactylation in PDAC, we performed a series of assays, including colony formation, transwell, and wound healing assays. The results demonstrated that inhibition of SLC16A1-mediated lactylation significantly impaired tumor cell proliferation (Figure 10B) and migration (Figure 10C and D).
To confirm the antitumor potential of SLC16A1-mediated lactylation downregulation in vivo, we used CHC alone to inhibit the tumor growth of SW1990 cells in xenograft models (Figure 10E). SCL16A1 inhibition sustainably delayed tumor growth compared to vehicle-injected control animals (Figure 10F and G). Subsequently, western blot analysis was performed to assess the levels of lactylation modifications resulting from MCT1 inhibition in vivo, which revealed a significant reduction (Figure 10H). Immunofluorescence corroborated these findings, indicating the importance of SLC16A1-mediated lactylation in pancreatic cancer cell growth (Figure 10I).
Recent studies have emphasized the pivotal role of lactate and its lactylation modifications in disease progression[9,19]. Substantial evidence indicates intracellular accumulation of lactylation modifications in response to stimuli such as hypoxia, lipopolysaccharides, and other processes that induce lactate production[20,21]. To investigate the function of lactylation modification in PDAC, we designated the intersecting genes between the lactylation-related gene set and DEGs as LRGs and demonstrated their correlation with lactylation using Gene Ontology and Kyoto Encyclopedia of Genes and Genomes analyses. Univariate and multivariate Cox regression analyses identified prognostic LRGs and formed the basis of a lactylation model with significant prognostic value. This prognostic feature includes five LRGs: SLC16A1, HLA-DRB1, KCNN4, KIF23, and HPDL. Subsequently, the results of the stratified tests showed that the high lactylation score subgroup exhibited a worse prognosis across multiple clinical features. Based on the above analysis, we successfully constructed a lactylation-related prognostic signature, which was thoroughly analyzed and validated, and observed a significant prognostic value. This method has the potential to accurately predict prognosis in clinical settings.
The PDAC TME encompasses vascular endothelial cells, infiltrating immune cells, and adjacent stromal cells[17]. A previous study identified immune and stromal cells as prognostic factors for tumor development[22]. Consequently, it is essential to understand the association between the tumor stoma and lactylation. Our findings on immune cell infiltration indicated that the subgroup with a high lactylation score was characterized by a lack of intratumoral CTL infiltration. This group exhibited a high proportion of M1 macrophages and an abundance of immunosuppressive cells (regulatory T cells), which is compatible with increased lactylation and is typically associated with a poor prognosis. In contrast, the subgroup with a low lactylation score showed a significant accumulation of cytotoxic CD8+ T cells, which was strongly linked to improved survival in patients with PDAC.
Tumor immunotherapy is a strategy for treating malignancies by harnessing the immune system, with the primary goal of inducing as many high-affinity cytotoxic T cells as possible without inducing autoimmunity[23,24]. An immune checkpoint blockade is an effective therapeutic strategy. Therefore, this study used a signature to investigate ICI expression across different PDAC subtypes to provide a therapeutic reference for diverse PDAC patient groups. We examined the correlation between immune checkpoint expression and subgroup classification in patients with PDAC to predict their responses to immunotherapy. Our findings indicate that several inhibitory ICIs, including CTLA4, TIGIT, CD86, CD28, BTLA, CD27, ADORA2A, IDO2, and CD200R1 were upregulated in the low-risk subgroup. The expression level of ICIs is a predictive biomarker for response to immunotherapy. Based on our results, we hypothesized that patients in the low-risk category have a higher presence of antitumor immune-infiltrating cells and are likely to exhibit better responses to immunotherapy.
The TMB indicates the number of mutations within cancer cells and is a key factor driving tumor heterogeneity[25]. To understand the molecular signatures of lactylation-related signatures, we investigated the TMBs in different subgroups. The results showed that KRAS mutations were prevalent in both subgroups, with a higher gene mutation rate in the high-risk subgroup than that in the low-risk subgroup. KRAS is the most mutated gene (more than 95%) in PDAC, which not only plays an important role in driving tumor growth and anti-apoptotic pathways but has been increasingly recognized in recent years because of its significant role in the intrinsic metabolism of tumor cells and TME[26-29]. The poor prognosis of the high-lactylation score group may be intricately linked to the higher mutation rate in KRAS. Moreover, higher TMBs increase the probability of tumor neoantigen production, thereby increasing the likelihood of immune recognition and tumor cell death[30]. Our results showed that the survival rate of the high-TMB group was significantly higher than that of the low-TMB group. Furthermore, when analyzing the combined effects of TMB and the lactylation score, it was evident that both factors significantly influenced the prognosis of patients with PDAC.
The roles of these five LRGs in various diseases have been studied previously. As a member of the SLC16 family, SLC16A1 (MCT1) primarily facilitates proton-linked transport of l-lactate across the plasma membrane[31]. Zhao et al[32] highlighted SLC16A1 as a prognostic marker in osteosarcoma, where its downregulation inhibited tumor growth and enhanced chemotherapy efficacy[32]. Further studies have indicated that SLC16A1 influences overall cellular lactate levels and disease progression[19,33,34]. The HLA system is the major histocompatibility complex in humans, believed to be related to the occurrence and development of various tumors, and has always been a focal point in tumor immunology research[35]. In a recent study, HLA-DRB1 (major histocompatibility complex, class II, DR beta 1) was reported to be a potential prognostic factor for cutaneous melanoma and an indicator of TME remodeling[36]. KCNN4 has been identified as closely associated with adverse clinicopathologic features and poor survival in patients with PDAC, which activates nuclear factor κB signaling, leading to enhanced macrophage infiltration[37,38]. In gastric cancer, KIF23 activates the Wnt/β-catenin signaling pathway, promotes tumor cell proliferation, migration, and invasion, and positively correlates with poor prognosis of patients[39,40]. HPDL positively regulates mitochondrial bioenergetic processes and ATP production in a glutamine-dependent manner. Its high expression is closely related to poor prognosis in patients with PDAC, and promotes the proliferation of PDAC cells.
This study analyzed the expression of five LRGs in a normal pancreatic epithelial cell line (HPNE) and five pancreatic cancer cell lines (AsPC-1, Capan-2, MIA-Paca2, PANC-1, and SW1990). While HLA-DRB1 did not show significant variations in expression, other genes exhibited diverse expression levels across the different cell lines. These genes show increased expression in most pancreatic cancer cell lines. However, because of the specificity of each cell line, we did not observe a uniformly significant expression across all the pancreatic cancer cell lines mentioned. To identify the LRGs most closely associated with lactylation, we focused on two cell lines with the most pronounced lactylation (PANC1 and SW1990). Our findings revealed that SLC16A1 showed the highest expression in both the cell lines, suggesting a strong association with lactylation. These data confirm a significant relationship between SLC16A1, lactate, and lactylation. Elevated lactate levels correspond to increased lactylation levels. Conversely, the inhibition of SLC16A1 and lactylation reduced intracellular lactate and lactate levels. These include overall intracellular lactylation modifications and specific histone lactylation at H3K18 and H3K9, which reduce the proliferation and migration of PDAC cells in vitro and in vivo.
In summary, we successfully constructed a prognostic model for lactylation in PDAC. Prognostic characteristics based on LRGs show an excellent ability to predict OS in patients with PDAC and are closely related to various aspects such as clinical features, immune cell infiltration, ICI treatment response, and TMB. They offer valuable insights into predicting responses to immunotherapy and chemotherapy. Our study provides a new perspective for elucidating the mechanisms underlying PDAC and suggests innovative approaches for its diagnosis and treatment. LRGs have potential as novel tumor markers or therapeutic targets. Despite the numerous advantages of this study, it had certain limitations must be acknowledged. Our findings establish a connection between SLC16A1 and the lactylation score in pancreatic cancer; however, further investigation is required to confirm this correlation. In the future, we intend to monitor additional data to further validate our proposed signature.
Provenance and peer review: Unsolicited article; Externally peer reviewed.
Peer-review model: Single blind
Specialty type: Gastroenterology and hepatology
Country of origin: China
Peer-review report’s classification
Scientific Quality: Grade B
Novelty: Grade B
Creativity or Innovation: Grade B
Scientific Significance: Grade B
P-Reviewer: Beeraka NM, India S-Editor: Li L L-Editor: A P-Editor: Zheng XM
| 1. | Klein AP. Pancreatic cancer epidemiology: understanding the role of lifestyle and inherited risk factors. Nat Rev Gastroenterol Hepatol. 2021;18:493-502. [RCA] [PubMed] [DOI] [Full Text] [Cited by in Crossref: 95] [Cited by in RCA: 694] [Article Influence: 173.5] [Reference Citation Analysis (0)] |
| 2. | Neoptolemos JP, Kleeff J, Michl P, Costello E, Greenhalf W, Palmer DH. Therapeutic developments in pancreatic cancer: current and future perspectives. Nat Rev Gastroenterol Hepatol. 2018;15:333-348. [RCA] [PubMed] [DOI] [Full Text] [Cited by in Crossref: 506] [Cited by in RCA: 805] [Article Influence: 115.0] [Reference Citation Analysis (0)] |
| 3. | Chen J, Zhu Y, Wu C, Shi J. Engineering lactate-modulating nanomedicines for cancer therapy. Chem Soc Rev. 2023;52:973-1000. [RCA] [PubMed] [DOI] [Full Text] [Cited by in RCA: 33] [Reference Citation Analysis (0)] |
| 4. | Faubert B, Li KY, Cai L, Hensley CT, Kim J, Zacharias LG, Yang C, Do QN, Doucette S, Burguete D, Li H, Huet G, Yuan Q, Wigal T, Butt Y, Ni M, Torrealba J, Oliver D, Lenkinski RE, Malloy CR, Wachsmann JW, Young JD, Kernstine K, DeBerardinis RJ. Lactate Metabolism in Human Lung Tumors. Cell. 2017;171:358-371.e9. [RCA] [PubMed] [DOI] [Full Text] [Cited by in Crossref: 640] [Cited by in RCA: 948] [Article Influence: 118.5] [Reference Citation Analysis (0)] |
| 5. | Hui S, Ghergurovich JM, Morscher RJ, Jang C, Teng X, Lu W, Esparza LA, Reya T, Le Zhan, Yanxiang Guo J, White E, Rabinowitz JD. Glucose feeds the TCA cycle via circulating lactate. Nature. 2017;551:115-118. [RCA] [PubMed] [DOI] [Full Text] [Cited by in Crossref: 724] [Cited by in RCA: 1210] [Article Influence: 151.3] [Reference Citation Analysis (0)] |
| 6. | Kelly B, O'Neill LA. Metabolic reprogramming in macrophages and dendritic cells in innate immunity. Cell Res. 2015;25:771-784. [RCA] [PubMed] [DOI] [Full Text] [Full Text (PDF)] [Cited by in Crossref: 1173] [Cited by in RCA: 1302] [Article Influence: 130.2] [Reference Citation Analysis (0)] |
| 7. | Certo M, Tsai CH, Pucino V, Ho PC, Mauro C. Lactate modulation of immune responses in inflammatory versus tumour microenvironments. Nat Rev Immunol. 2021;21:151-161. [RCA] [PubMed] [DOI] [Full Text] [Cited by in Crossref: 324] [Cited by in RCA: 487] [Article Influence: 121.8] [Reference Citation Analysis (0)] |
| 8. | Zhang D, Tang Z, Huang H, Zhou G, Cui C, Weng Y, Liu W, Kim S, Lee S, Perez-Neut M, Ding J, Czyz D, Hu R, Ye Z, He M, Zheng YG, Shuman HA, Dai L, Ren B, Roeder RG, Becker L, Zhao Y. Metabolic regulation of gene expression by histone lactylation. Nature. 2019;574:575-580. [RCA] [PubMed] [DOI] [Full Text] [Full Text (PDF)] [Cited by in Crossref: 828] [Cited by in RCA: 2118] [Article Influence: 353.0] [Reference Citation Analysis (0)] |
| 9. | Xiong J, He J, Zhu J, Pan J, Liao W, Ye H, Wang H, Song Y, Du Y, Cui B, Xue M, Zheng W, Kong X, Jiang K, Ding K, Lai L, Wang Q. Lactylation-driven METTL3-mediated RNA m(6)A modification promotes immunosuppression of tumor-infiltrating myeloid cells. Mol Cell. 2022;82:1660-1677.e10. [RCA] [PubMed] [DOI] [Full Text] [Cited by in Crossref: 17] [Cited by in RCA: 401] [Article Influence: 133.7] [Reference Citation Analysis (0)] |
| 10. | Yu J, Chai P, Xie M, Ge S, Ruan J, Fan X, Jia R. Histone lactylation drives oncogenesis by facilitating m(6)A reader protein YTHDF2 expression in ocular melanoma. Genome Biol. 2021;22:85. [RCA] [PubMed] [DOI] [Full Text] [Full Text (PDF)] [Cited by in Crossref: 46] [Cited by in RCA: 517] [Article Influence: 129.3] [Reference Citation Analysis (0)] |
| 11. | Cui H, Xie N, Banerjee S, Ge J, Jiang D, Dey T, Matthews QL, Liu RM, Liu G. Lung Myofibroblasts Promote Macrophage Profibrotic Activity through Lactate-induced Histone Lactylation. Am J Respir Cell Mol Biol. 2021;64:115-125. [RCA] [PubMed] [DOI] [Full Text] [Cited by in Crossref: 39] [Cited by in RCA: 213] [Article Influence: 53.3] [Reference Citation Analysis (0)] |
| 12. | Yang K, Fan M, Wang X, Xu J, Wang Y, Tu F, Gill PS, Ha T, Liu L, Williams DL, Li C. Lactate promotes macrophage HMGB1 lactylation, acetylation, and exosomal release in polymicrobial sepsis. Cell Death Differ. 2022;29:133-146. [RCA] [PubMed] [DOI] [Full Text] [Full Text (PDF)] [Cited by in Crossref: 60] [Cited by in RCA: 404] [Article Influence: 134.7] [Reference Citation Analysis (0)] |
| 13. | Xie B, Lin J, Chen X, Zhou X, Zhang Y, Fan M, Xiang J, He N, Hu Z, Wang F. CircXRN2 suppresses tumor progression driven by histone lactylation through activating the Hippo pathway in human bladder cancer. Mol Cancer. 2023;22:151. [RCA] [PubMed] [DOI] [Full Text] [Full Text (PDF)] [Cited by in RCA: 107] [Reference Citation Analysis (0)] |
| 14. | Engebretsen S, Bohlin J. Statistical predictions with glmnet. Clin Epigenetics. 2019;11:123. [RCA] [PubMed] [DOI] [Full Text] [Full Text (PDF)] [Cited by in Crossref: 163] [Cited by in RCA: 663] [Article Influence: 110.5] [Reference Citation Analysis (0)] |
| 15. | Li B, Cui Y, Nambiar DK, Sunwoo JB, Li R. The Immune Subtypes and Landscape of Squamous Cell Carcinoma. Clin Cancer Res. 2019;25:3528-3537. [RCA] [PubMed] [DOI] [Full Text] [Cited by in Crossref: 54] [Cited by in RCA: 131] [Article Influence: 21.8] [Reference Citation Analysis (0)] |
| 16. | Hu FF, Liu CJ, Liu LL, Zhang Q, Guo AY. Expression profile of immune checkpoint genes and their roles in predicting immunotherapy response. Brief Bioinform. 2021;22. [RCA] [PubMed] [DOI] [Full Text] [Cited by in Crossref: 41] [Cited by in RCA: 218] [Article Influence: 43.6] [Reference Citation Analysis (0)] |
| 17. | Li Hd, Huang C, Huang Kj, Wu Wd, Jiang T, Cao J, Feng Zz, Qiu Zj. STAT3 knockdown reduces pancreatic cancer cell invasiveness and matrix metalloproteinase-7 expression in nude mice. PLoS One. 2011;6:e25941. [RCA] [PubMed] [DOI] [Full Text] [Full Text (PDF)] [Cited by in Crossref: 40] [Cited by in RCA: 51] [Article Influence: 3.6] [Reference Citation Analysis (0)] |
| 18. | Parks SK, Chiche J, Pouysségur J. Disrupting proton dynamics and energy metabolism for cancer therapy. Nat Rev Cancer. 2013;13:611-623. [RCA] [PubMed] [DOI] [Full Text] [Cited by in Crossref: 442] [Cited by in RCA: 484] [Article Influence: 40.3] [Reference Citation Analysis (0)] |
| 19. | Fan M, Yang K, Wang X, Chen L, Gill PS, Ha T, Liu L, Lewis NH, Williams DL, Li C. Lactate promotes endothelial-to-mesenchymal transition via Snail1 lactylation after myocardial infarction. Sci Adv. 2023;9:eadc9465. [RCA] [PubMed] [DOI] [Full Text] [Full Text (PDF)] [Cited by in Crossref: 23] [Cited by in RCA: 190] [Article Influence: 95.0] [Reference Citation Analysis (0)] |
| 20. | Irizarry-Caro RA, McDaniel MM, Overcast GR, Jain VG, Troutman TD, Pasare C. TLR signaling adapter BCAP regulates inflammatory to reparatory macrophage transition by promoting histone lactylation. Proc Natl Acad Sci USA. 2020;117:30628-30638. [RCA] [PubMed] [DOI] [Full Text] [Cited by in Crossref: 165] [Cited by in RCA: 246] [Article Influence: 49.2] [Reference Citation Analysis (0)] |
| 21. | Yang Z, Yan C, Ma J, Peng P, Ren X, Cai S, Shen X, Wu Y, Zhang S, Wang X, Qiu S, Zhou J, Fan J, Huang H, Gao Q. Lactylome analysis suggests lactylation-dependent mechanisms of metabolic adaptation in hepatocellular carcinoma. Nat Metab. 2023;5:61-79. [RCA] [PubMed] [DOI] [Full Text] [Cited by in Crossref: 7] [Cited by in RCA: 273] [Article Influence: 136.5] [Reference Citation Analysis (0)] |
| 22. | Mahajan UM, Langhoff E, Goni E, Costello E, Greenhalf W, Halloran C, Ormanns S, Kruger S, Boeck S, Ribback S, Beyer G, Dombroswki F, Weiss FU, Neoptolemos JP, Werner J, D'Haese JG, Bazhin A, Peterhansl J, Pichlmeier S, Büchler MW, Kleeff J, Ganeh P, Sendler M, Palmer DH, Kohlmann T, Rad R, Regel I, Lerch MM, Mayerle J. Immune Cell and Stromal Signature Associated With Progression-Free Survival of Patients With Resected Pancreatic Ductal Adenocarcinoma. Gastroenterology. 2018;155:1625-1639.e2. [RCA] [PubMed] [DOI] [Full Text] [Cited by in Crossref: 129] [Cited by in RCA: 146] [Article Influence: 20.9] [Reference Citation Analysis (0)] |
| 23. | Feig C, Gopinathan A, Neesse A, Chan DS, Cook N, Tuveson DA. The pancreas cancer microenvironment. Clin Cancer Res. 2012;18:4266-4276. [RCA] [PubMed] [DOI] [Full Text] [Cited by in Crossref: 841] [Cited by in RCA: 1030] [Article Influence: 85.8] [Reference Citation Analysis (0)] |
| 24. | Kalbasi A, Ribas A. Tumour-intrinsic resistance to immune checkpoint blockade. Nat Rev Immunol. 2020;20:25-39. [RCA] [PubMed] [DOI] [Full Text] [Cited by in Crossref: 443] [Cited by in RCA: 1018] [Article Influence: 169.7] [Reference Citation Analysis (0)] |
| 25. | Müller M, Bird TG, Nault JC. The landscape of gene mutations in cirrhosis and hepatocellular carcinoma. J Hepatol. 2020;72:990-1002. [RCA] [PubMed] [DOI] [Full Text] [Cited by in Crossref: 67] [Cited by in RCA: 114] [Article Influence: 22.8] [Reference Citation Analysis (0)] |
| 26. | Prior IA, Hood FE, Hartley JL. The Frequency of Ras Mutations in Cancer. Cancer Res. 2020;80:2969-2974. [RCA] [PubMed] [DOI] [Full Text] [Cited by in Crossref: 592] [Cited by in RCA: 676] [Article Influence: 135.2] [Reference Citation Analysis (0)] |
| 27. | Ying H, Kimmelman AC, Lyssiotis CA, Hua S, Chu GC, Fletcher-Sananikone E, Locasale JW, Son J, Zhang H, Coloff JL, Yan H, Wang W, Chen S, Viale A, Zheng H, Paik JH, Lim C, Guimaraes AR, Martin ES, Chang J, Hezel AF, Perry SR, Hu J, Gan B, Xiao Y, Asara JM, Weissleder R, Wang YA, Chin L, Cantley LC, DePinho RA. Oncogenic Kras maintains pancreatic tumors through regulation of anabolic glucose metabolism. Cell. 2012;149:656-670. [RCA] [PubMed] [DOI] [Full Text] [Cited by in Crossref: 1246] [Cited by in RCA: 1571] [Article Influence: 120.8] [Reference Citation Analysis (0)] |
| 28. | Yun J, Rago C, Cheong I, Pagliarini R, Angenendt P, Rajagopalan H, Schmidt K, Willson JK, Markowitz S, Zhou S, Diaz LA Jr, Velculescu VE, Lengauer C, Kinzler KW, Vogelstein B, Papadopoulos N. Glucose deprivation contributes to the development of KRAS pathway mutations in tumor cells. Science. 2009;325:1555-1559. [RCA] [PubMed] [DOI] [Full Text] [Full Text (PDF)] [Cited by in Crossref: 772] [Cited by in RCA: 731] [Article Influence: 45.7] [Reference Citation Analysis (0)] |
| 29. | Pupo E, Avanzato D, Middonti E, Bussolino F, Lanzetti L. KRAS-Driven Metabolic Rewiring Reveals Novel Actionable Targets in Cancer. Front Oncol. 2019;9:848. [RCA] [PubMed] [DOI] [Full Text] [Full Text (PDF)] [Cited by in Crossref: 70] [Cited by in RCA: 106] [Article Influence: 17.7] [Reference Citation Analysis (0)] |
| 30. | Sholl LM, Hirsch FR, Hwang D, Botling J, Lopez-Rios F, Bubendorf L, Mino-Kenudson M, Roden AC, Beasley MB, Borczuk A, Brambilla E, Chen G, Chou TY, Chung JH, Cooper WA, Dacic S, Lantuejoul S, Jain D, Lin D, Minami Y, Moreira A, Nicholson AG, Noguchi M, Papotti M, Pelosi G, Poleri C, Rekhtman N, Tsao MS, Thunnissen E, Travis W, Yatabe Y, Yoshida A, Daigneault JB, Zehir A, Peters S, Wistuba II, Kerr KM, Longshore JW. The Promises and Challenges of Tumor Mutation Burden as an Immunotherapy Biomarker: A Perspective from the International Association for the Study of Lung Cancer Pathology Committee. J Thorac Oncol. 2020;15:1409-1424. [RCA] [PubMed] [DOI] [Full Text] [Cited by in Crossref: 102] [Cited by in RCA: 205] [Article Influence: 41.0] [Reference Citation Analysis (0)] |
| 31. | Halestrap AP. The SLC16 gene family - structure, role and regulation in health and disease. Mol Aspects Med. 2013;34:337-349. [RCA] [PubMed] [DOI] [Full Text] [Cited by in Crossref: 388] [Cited by in RCA: 560] [Article Influence: 46.7] [Reference Citation Analysis (0)] |
| 32. | Zhao Z, Wu MS, Zou C, Tang Q, Lu J, Liu D, Wu Y, Yin J, Xie X, Shen J, Kang T, Wang J. Downregulation of MCT1 inhibits tumor growth, metastasis and enhances chemotherapeutic efficacy in osteosarcoma through regulation of the NF-κB pathway. Cancer Lett. 2014;342:150-158. [RCA] [PubMed] [DOI] [Full Text] [Cited by in Crossref: 68] [Cited by in RCA: 86] [Article Influence: 7.2] [Reference Citation Analysis (0)] |
| 33. | Wang P, Xie D, Xiao T, Cheng C, Wang D, Sun J, Wu M, Yang Y, Zhang A, Liu Q. H3K18 lactylation promotes the progression of arsenite-related idiopathic pulmonary fibrosis via YTHDF1/m6A/NREP. J Hazard Mater. 2024;461:132582. [RCA] [PubMed] [DOI] [Full Text] [Cited by in RCA: 66] [Reference Citation Analysis (0)] |
| 34. | Luo Y, Yang Z, Yu Y, Zhang P. HIF1α lactylation enhances KIAA1199 transcription to promote angiogenesis and vasculogenic mimicry in prostate cancer. Int J Biol Macromol. 2022;222:2225-2243. [RCA] [PubMed] [DOI] [Full Text] [Cited by in RCA: 116] [Reference Citation Analysis (0)] |
| 35. | Aureli A, Canossi A, Del Beato T, Franceschilli L, Buonomo O, Papola F, De Sanctis F, Lanzilli G, Sileri P, Coppola A, Caratelli S, Arriga R, Orlandi A, Lauro D, Rossi P, Sconocchia G. HLA-DRB1*13:01 allele in the genetic susceptibility to colorectal carcinoma. Int J Cancer. 2015;136:2464-2468. [RCA] [PubMed] [DOI] [Full Text] [Cited by in Crossref: 8] [Cited by in RCA: 17] [Article Influence: 1.5] [Reference Citation Analysis (0)] |
| 36. | Deng H, Chen Y, Wang J, An R. HLA-DRB1: A new potential prognostic factor and therapeutic target of cutaneous melanoma and an indicator of tumor microenvironment remodeling. PLoS One. 2022;17:e0274897. [RCA] [PubMed] [DOI] [Full Text] [Full Text (PDF)] [Cited by in RCA: 3] [Reference Citation Analysis (0)] |
| 37. | Mo X, Zhang CF, Xu P, Ding M, Ma ZJ, Sun Q, Liu Y, Bi HK, Guo X, Abdelatty A, Hu C, Xu HJ, Zhou GR, Jia YL, Xia HP. KCNN4-mediated Ca(2+)/MET/AKT axis is promising for targeted therapy of pancreatic ductal adenocarcinoma. Acta Pharmacol Sin. 2022;43:735-746. [RCA] [PubMed] [DOI] [Full Text] [Cited by in Crossref: 13] [Cited by in RCA: 13] [Article Influence: 4.3] [Reference Citation Analysis (0)] |
| 38. | Jiang SH, Zhu LL, Zhang M, Li RK, Yang Q, Yan JY, Zhang C, Yang JY, Dong FY, Dai M, Hu LP, Li J, Li Q, Wang YH, Yang XM, Zhang YL, Nie HZ, Zhu L, Zhang XL, Tian GA, Zhang XX, Cao XY, Tao LY, Huang S, Jiang YS, Hua R, Qian Luo K, Gu JR, Sun YW, Hou S, Zhang ZG. GABRP regulates chemokine signalling, macrophage recruitment and tumour progression in pancreatic cancer through tuning KCNN4-mediated Ca(2+) signalling in a GABA-independent manner. Gut. 2019;68:1994-2006. [RCA] [PubMed] [DOI] [Full Text] [Cited by in Crossref: 60] [Cited by in RCA: 124] [Article Influence: 20.7] [Reference Citation Analysis (0)] |
| 39. | Liu Y, Chen H, Dong P, Xie G, Zhou Y, Ma Y, Yuan X, Yang J, Han L, Chen L, Shen L. KIF23 activated Wnt/β-catenin signaling pathway through direct interaction with Amer1 in gastric cancer. Aging (Albany NY). 2020;12:8372-8396. [RCA] [PubMed] [DOI] [Full Text] [Full Text (PDF)] [Cited by in Crossref: 13] [Cited by in RCA: 29] [Article Influence: 5.8] [Reference Citation Analysis (0)] |
| 40. | Bai M, Liu X. Diagnostic biomarker KIF23 is associated with immune infiltration and immunotherapy response in gastric cancer. Front Oncol. 2023;13:1191009. [RCA] [PubMed] [DOI] [Full Text] [Cited by in RCA: 7] [Reference Citation Analysis (0)] |


