


Published online May 14, 2024. doi: 10.3748/wjg.v30.i18.2440
Revised: March 19, 2024
Accepted: April 25, 2024
Published online: May 14, 2024
Processing time: 116 Days and 22.3 Hours
Non-alcoholic fatty liver disease (NAFLD) with hepatic histological NAFLD activity score ≥ 4 and fibrosis stage F ≥ 2 is regarded as “at risk” non-alcoholic steatohepatitis (NASH). Based on an international consensus, NAFLD and NASH were renamed as metabolic dysfunction-associated steatotic liver disease (MASLD) and metabolic dysfunction-associated steatohepatitis (MASH), respectively; hence, we introduced the term “high-risk MASH”. Diagnostic values of seven non-invasive models, including FibroScan-aspartate transaminase (FAST), fibrosis-4 (FIB-4), aspartate transaminase to platelet ratio index (APRI), etc. for high-risk MASH have rarely been studied and compared in MASLD.
To assess the clinical value of seven non-invasive models as alternatives to liver biopsy for diagnosing high-risk MASH.
A retrospective analysis was conducted on 309 patients diagnosed with NAFLD via liver biopsy at Beijing Ditan Hospital, between January 2012 and December 2020. After screening for MASLD and the exclusion criteria, 279 patients were included and categorized into high-risk and non-high-risk MASH groups. Utilizing threshold values of each model, sensitivity, specificity, positive predictive value (PPV), and negative predictive values (NPV), were calculated. Receiver operating characteristic curves were constructed to evaluate their diagnostic efficacy based on the area under the curve (AUROC).
MASLD diagnostic criteria were met by 99.4% patients with NAFLD. The MASLD population was analyzed in two cohorts: Overall population (279 patients) and the subgroup (117 patients) who underwent liver transient elastography (FibroScan). In the overall population, FIB-4 showed better diagnostic efficacy and higher PPV, with sensitivity, specificity, PPV, NPV, and AUROC of 26.9%, 95.2%, 73.5%, 72.2%, and 0.75. APRI, Forns index, and aspartate transaminase to alanine transaminase ratio (ARR) showed moderate diagnostic efficacy, whereas S index and gamma-glutamyl transpeptidase to platelet ratio (GPR) were relatively weaker. In the subgroup, FAST had the highest diagnostic efficacy, its sensitivity, specificity, PPV, NPV, and AUROC were 44.2%, 92.3%, 82.1%, 67.4%, and 0.82. The FIB-4 AUROC was 0.76. S index and GPR exhibited almost no diagnostic value for high-risk MASH.
FAST and FIB-4 could replace liver biopsy as more effectively diagnostic methods for high-risk MASH compared to APRI, Forns index, ARR, S index, and GPR; FAST is superior to FIB-4.
Core Tip: Patients with high-risk metabolic dysfunction-associated steatohepatitis (MASH) are more likely to develop cirrhosis or hepatocellular carcinoma. Early diagnosis, particularly without a liver biopsy, presents significant challenges. Exploring non-invasive models may increase detection efficiency. Although metabolic dysfunction-associated steatotic liver disease originates from non-alcoholic fatty liver disease, patient cohorts do not entirely overlap. Our study validated the concordance between these two distinct populations. To determine the effective replacement of liver biopsy with non-invasive models for diagnosing high-risk MASH, we utilized existing data to select seven diagnostic methods and assessed their diagnostic value for high-risk MASH.
- Citation: Yin JY, Yang TY, Yang BQ, Hou CX, Li JN, Li Y, Wang Q. FibroScan-aspartate transaminase: A superior non-invasive model for diagnosing high-risk metabolic dysfunction-associated steatohepatitis. World J Gastroenterol 2024; 30(18): 2440-2453
- URL: https://www.wjgnet.com/1007-9327/full/v30/i18/2440.htm
- DOI: https://dx.doi.org/10.3748/wjg.v30.i18.2440
Non-alcoholic fatty liver disease (NAFLD) is the most prevalent chronic liver disease worldwide[1], encompassing a spectrum from simple accumulation of fat (‘fatty liver’ or steatosis) to non-alcoholic steatohepatitis (NASH), fibrosis, cirrhosis, and hepatocellular carcinoma. The degree of liver fibrosis, particularly F ≥ 2, has been identified as a determinant of disease-specific mortality in patients with NAFLD[2]. NAFLD with a NAFLD activity score (NAS) ≥ 4 and a fibrosis stage F ≥ 2 is regarded as “at risk” NASH[3]. Patients at this stage are more susceptible to cirrhosis or hepatocellular carcinoma, and diagnosis is challenging; early identification is paramount for long-term prognosis of patients[4]. The recent international consensus renamed NAFLD and NASH to metabolic dysfunction-associated steatotic liver disease (MASLD) and metabolic dysfunction-associated steatohepatitis (MASH)[5], respectively; hence, we have accordingly introduced the term “high-risk MASH”. However, the complete equivalence between NASH and MASH remains unclear.
Although liver biopsy remains the “gold standard” for accurately assessing hepatic lipid deposition, inflammation, and fibrosis in patients with NASH, it is considered an invasive procedure and not routinely used in clinical practice[6]. Non-invasive models are anticipated to serve as viable substitutes for liver biopsies in diagnostic methodology[7]. Consequently, we selected seven commonly used non-invasive models, including FibroScan-aspartate transaminase (FAST)[8], fibrosis-4 (FIB-4), aspartate transaminase to platelet ratio index (APRI)[9], Forns index[10], aspartate transaminase to alanine transaminase ratio (ARR)[11], S index[12], and gamma-glutamyl transpeptidase to platelet ratio (GPR)[13], to evaluate their clinical diagnostic values. Among these, FIB-4, APRI, and ARR have been utilized for diagnosing advanced liver fibrosis (F3-4)[11,14], whereas Forns index, S index, and GPR have been used to discern significant fibroses (F2-4)[10,12,13]. FAST, FIB-4, and APRI have also been employed in assessing NASH with NAS ≥ 4 and F ≥ 2[8]. However, data regarding the effective evaluation of high-risk MASH using the optimal non-invasive models in the MASLD population is lacking. The primary objective of this study was to evaluate the effectiveness and clinical utility of seven non-invasive models as alternatives to liver biopsy for identifying high-risk MASH in patients with MASLD.
This study included patients admitted to Beijing Ditan Hospital, affiliated with Capital Medical University, from January 2012 to December 2020. All participants were histologically confirmed to have had NAFLD via liver biopsy and were aged between 15 and 70 years. The study excluded individuals presenting with any of the following factors: (1) Concomitant chronic liver diseases, including but not limited to chronic hepatitis B, chronic hepatitis C, autoimmune liver diseases, drug-induced liver injury, hereditary metabolic liver diseases, and unexplained liver damage or steatosis; (2) excessive alcohol consumption, defined as intake of ≥ 20-50 g/d for females and ≥ 30-60 g/d for males[15]; and (3) the presence of hepatocellular carcinoma or other malignancies. The study was conducted in accordance with the ethical standards as per the 1964 Declaration of Helsinki and its later amendments, and was approved by the Institutional Review Board of Beijing Ditan Hospital, Capital Medical University.
All patients underwent liver tissue histopathology biopsy under ultrasound guidance. The biopsy specimens were fixed in 10% formalin, embedded in paraffin, and tissue sections were stained with hematoxylin and eosin. Two experienced hepatic pathologists, blinded to patient clinical data, independently assessed the sections, using the NASH-CRN histologic scoring system.
Clinical data, laboratory, and imaging test results were meticulously collected from the electronic medical records of Beijing Ditan Hospital for each subject one month before and after the liver biopsy. Data acquired included total cholesterol (TC), triglycerides (TG), high-density lipoprotein cholesterol (HDL-C), low-density lipoprotein cholesterol, fasting blood glucose, platelet count (PLT), aspartate transaminase (AST), alanine aminotransferase (ALT), alkaline phosphatase, gamma-glutamyl transferase (γ-GGT), total bilirubin, albumin (ALB), hemoglobin (HGB), apolipoprotein A1, apolipoprotein B, creatinine (Cr), urea, uric acid, estimated glomerular filtration rate (eGFR), prothrombin time (PT), liver stiffness measurement (LSM), and controlled attenuation parameter (CAP).
MASLD was diagnosed based on the presence of hepatic steatosis accompanied by at least one of the following five cardiovascular metabolic risk factors[15]: (1) Body mass index ≥ 25 kg/m² (or ≥ 23 kg/m² for Asian populations), waist circumference > 94 cm for males and > 80 cm for females, or adjustments made for specific ethnic groups; (2) fasting blood glucose ≥ 5.6 mmol/L (100 mg/dL), 2-h postprandial blood glucose ≥ 7.8 mmol/L (≥ 140 mg/dL), glycated HGB (HbA1c) ≥ 5.7% (39 mmol/L), type 2 diabetes diagnosis, or ongoing treatment for type 2 diabetes; (3) blood pressure ≥ 130/85 mmHg or treatment with antihypertensive medication; (4) plasma TG levels ≥ 1.70 mmol/L (150 mg/dL) or treatment with lipid-lowering therapy; and (5) plasma HDL-C ≤ 1.0 mmol/L (40 mg/dL) for males and ≤ 1.3 mmol/L (50 mg/dL) for females, or treatment with lipid-lowering therapy.
The following formulae represent the non-invasive models evaluated in this study:
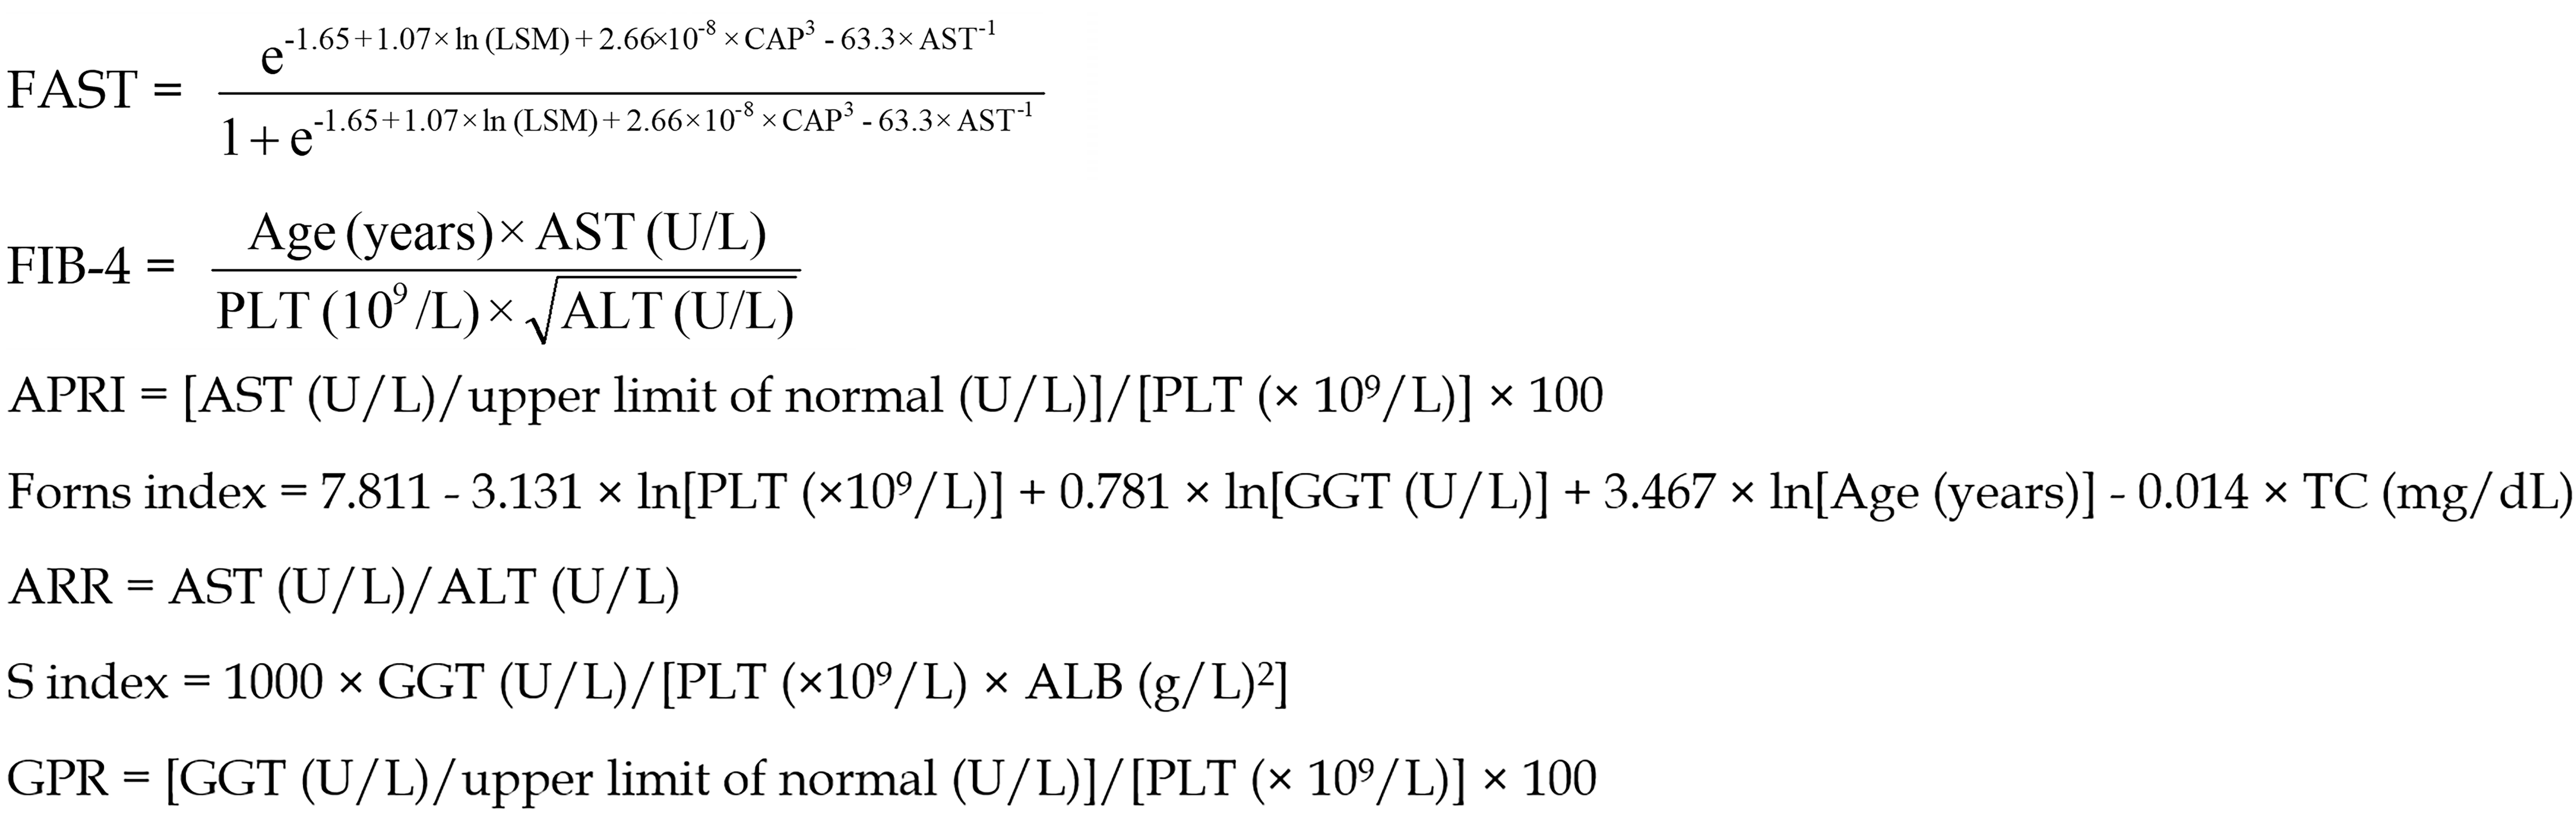
The seven non-invasive models—FAST, FIB-4, APRI, Forns Index, ARR, S index, and GPR—were employed with their respective high threshold values for diagnostic purposes set at 0.67[8], 2.67[16], 1.50[9], 6.90[10], 1.00[11], 0.50[12], and 0.56[13].
Data analysis was performed using SPSS version 25.0 (SPSS Inc., IL, United States), GraphPad Prism version 8.4.0, and R software version 4.2.3. Quantitative data conforming to a normal distribution were expressed as mean ± SD, whereas those not following a normal distribution were presented as median and interquartile range M (P25, P75). For continuously measured variables that were normally distributed and had homogeneous variances, an independent samples t-test was utilized. Non-normally distributed data were assessed using non-parametric tests (Mann-Whitney U test). Categorical variables were tested using χ2. Diagnostic model efficacy in disease identification was evaluated via calculating sensitivity, specificity, positive predictive value (PPV), negative predictive value (NPV), and plotting the receiver operating characteristic curves (ROC). P < 0.05 was considered statistically significant.
We initially identified 309 patients diagnosed with NAFLD via liver biopsy. After excluding two cases that did not meet the diagnostic criteria, 307 patients were considered for MASLD. Subsequently, 28 individuals were excluded owing to missing data, resulting in 279 patients with MASLD included. These 279 cases of MASLD were considered the overall population; whereas, 117 patients undergoing LSM and CAP assessments using transient elastography (FibroScan) for FAST model evaluation represented a subgroup population (Figure 1). The screening results indicated that 99.4% of patients with NAFLD met the diagnostic criteria for MASLD.

Both populations were separately stratified into high-risk and non-high-risk MASH groups according to the high-risk MASH definition. In the overall and subgroup populations, the fibrosis stage of the high-risk MASH group was predominantly stage F2, whereas in the non-high-risk MASH group it was stage F1. Moreover, the number of patients in stages F3 and F4 was significantly higher in the high-risk compared to the non-high-risk MASH groups (Tables 1 and 2).
| NAS and fibrosis stage | Overall population (n = 279) | High-risk MASH group (n = 93) | Non-high-risk MASH group (n = 186) |
| NAS | |||
| 0-3 | 52.0 (18.6) | 0.0 (0.0) | 52.0 (28.0) |
| ≥ 4 | 227.0 (81.4) | 93.0 (100.0) | 134.0 (72.0) |
| Fibrosis stage | |||
| F0 | 11.0 (3.9) | 0.0 (0.0) | 11.0 (5.9) |
| F1 | 169.0 (60.6) | 0.0 (0.0) | 169.0 (90.9) |
| F2 | 65.0 (23.3) | 61.0 (65.6) | 4.0 (2.2) |
| F3 | 25.0 (9.0) | 24.0 (25.8) | 1.0 (0.5) |
| F4 | 9.0 (3.2) | 8.0 (8.6) | 1.0 (0.5) |
| NAS and fibrosis stage | Subgroup population (n = 117) | High-risk MASH group (n = 52) | Non-high-risk MASH group (n = 65) |
| NAS | |||
| 0-3 | 23.0 (19.7) | 0.0 (0.0) | 23.0 (35.4) |
| ≥ 4 | 94.0 (80.3) | 52.0 (100.0) | 42.0 (64.6) |
| Fibrosis stage | |||
| F0 | 2.0 (1.7) | 0.0 (0.0) | 2.0 (3.1) |
| F1 | 58.0 (49.6) | 0.0 (0.0) | 58.0 (89.2) |
| F2 | 34.0 (29.1) | 31.0 (59.6) | 3.0 (4.6) |
| F3 | 15.0 (12.8) | 14.0 (26.9) | 1.0 (1.5) |
| F4 | 8.0 (6.8) | 7.0 (13.5) | 1.0 (1.5) |
According to clinical characteristics of the 279 patients with MASLD (Table 3), 45.2% (126/279) were male, with a median age of 41.0 (30.0, 53.0) and a mean body mass index of 26.8 ± 3.4 kg/m². The proportion of patients in the high-risk MASH group was 33.3% (93/279), whereas that in the non-high-risk MASH group was 66.7% (186/279). The prevalence of females, average age, fasting blood glucose, AST, apolipoprotein A1 levels, and PT were significantly higher in the high-risk MASH group (P < 0.05), whereas PLT, ALB, Cr, and eGFR were comparatively lower (P < 0.05). Furthermore, the incidence of dysglycemia, hypertension, and hyperlipidemia was also higher in the high-risk MASH group (P < 0.05). Significant differences were observed between the high-risk and non-high-risk MASH groups in non-invasive models, including FIB-4, APRI, Forns index, ARR, S index, and GPR (P < 0.05).
| Project | Overall population (n = 279) | High-risk MASH group (n = 93) | Non-high-risk MASH group (n = 186) | P value |
| Demographics | ||||
| Male | 126 (45.2) | 28 (30.1) | 98 (52.7) | < 0.05 |
| Age (yr) | 41.0 (30.0, 53.0) | 48.0 (36.5, 57.0) | 38.0 (29.0, 50.0) | < 0.05 |
| BMI (kg/m2) | 26.8 ± 3.4 | 27.3 ± 3.2 | 26.5 ± 3.6 | 0.26 |
| Metabolic disease | ||||
| Dysglycemia | 187 (67.0) | 72 (77.4) | 115 (61.8) | < 0.05 |
| Hypertension | 72 (25.8) | 32 (34.4) | 40 (21.5) | < 0.05 |
| Hyperlipidemia | 37 (13.3) | 18 (19.4) | 19 (10.2) | < 0.05 |
| Hypertriglyceridemia | 150 (53.8) | 44 (47.3) | 106 (57.0) | 0.13 |
| Low HDL-C | 202 (72.4) | 73 (78.5) | 129 (69.4) | 0.11 |
| Serologic indicators | ||||
| TC (mmol/L) | 4.9 ± 1.0 | 4.9 ± 1.0 | 4.9 ± 1.0 | 0.51 |
| TG (mmol/L) | 1.8 (1.3, 2.7) | 1.7 (1.1, 2.3) | 1.9 (1.3, 2.8) | 0.08 |
| HDL-C (mmol/L) | 1.0 (0.9, 1.2) | 1.1 (0.9, 1.2) | 1.0 (0.9, 1.2) | 0.70 |
| LDL-C (mmol/L) | 3.0 ± 0.8 | 2.9 ± 0.9 | 3.0 ± 0.8 | 0.75 |
| Fasting blood glucose (mmol/L) | 5.9 (5.4, 6.7) | 6.3 (5.6, 7.2) | 5.7 (5.3, 6.4) | < 0.05 |
| PLT (× 109/L) | 222.8 ± 66.1 | 205.6 ± 68.4 | 231.4 ± 63.3 | < 0.05 |
| ALT (U/L) | 90.6 (55.7, 145.5) | 99.1 (55.9, 148.8) | 86.0 (55.2, 139.0) | 0.28 |
| AST (U/L) | 50.1 (31.4, 81.2) | 65.0 (37.7, 107.5) | 43.8 (29.9, 62.4) | < 0.05 |
| ALP (U/L) | 82.0 (65.8, 98.5) | 83.1 (69.5, 98.9) | 79.9 (64.7, 98.4) | 0.36 |
| GGT (U/L) | 63.5 (38.8, 103.1) | 71.5 (45.7, 103.0) | 60.4 (35.9, 105.6) | 0.09 |
| TBIL (μmol/L) | 12.3 (9.4, 16.5) | 13.0 (10.0, 17.5) | 11.7 (9.1, 15.9) | 0.08 |
| ALB (g/L) | 46.1 (43.0, 48.9) | 44.8 (42.1, 48.0) | 46.7 (43.7, 49.4) | < 0.05 |
| HGB (g/L) | 144.0 (134.0, 156.0) | 141.3 (132.0, 153.0) | 146.0 (134.9, 158.0) | 0.07 |
| Apolipoprotein A1 (g/L) | 1.3 (1.2, 1.5) | 1.4 (1.2, 1.5) | 1.3 (1.2, 1.5) | < 0.05 |
| Apolipoprotein B (g/L) | 1.0 (0.8, 1.1) | 0.9 (0.7, 1.2) | 1.0 (0.8, 1.1) | 0.95 |
| Cr (μmol/L) | 61.5 (52.4, 73.0) | 56.9 (50.9, 67.3) | 63.0 (53.0, 74.1) | < 0.05 |
| Urea (mmol/L) | 4.5 (3.8, 5.4) | 4.5 (3.7, 5.4) | 4.5 (3.8, 5.2) | 0.97 |
| Uric acid (μmol/L) | 367.0 (301.0, 433.0) | 369.0 (282.8, 443.0) | 363.5 (304.0, 425.9) | 0.67 |
| eGFR (mL/min) | 110.6 (100.6, 120.2) | 108.0 (98.5, 114.9) | 114.0 (105.0, 124.0) | < 0.05 |
| PT (s) | 11.3 (10.7, 11.9) | 11.6 (11.1, 12.3) | 11.2 (10.6, 11.7) | < 0.05 |
| Non-invasive models | ||||
| FIB-4 | 0.9 (0.6, 1.6) | 1.4 (1.0, 2.8) | 0.8 (0.6, 1.2) | < 0.05 |
| APRI | 0.6 (0.4, 1.0) | 0.9 (0.5, 1.5) | 0.5 (0.3, 0.8) | < 0.05 |
| Forns index | 4.2 (3.0, 5.6) | 5.0 (3.7, 6.3) | 3.9 (2.7, 4.9) | < 0.05 |
| ARR | 0.6 (0.5, 0.7) | 0.6 (0.5, 0.9) | 0.5 (0.4, 0.7) | < 0.05 |
| S index | 0.1 (0.1, 0.3) | 0.2 (0.1, 0.3) | 0.1 (0.1, 0.2) | < 0.05 |
| GPR | 0.7 (0.4, 1.2) | 0.8 (0.5, 1.3) | 0.6 (0.3, 1.0) | < 0.05 |
However, in the 117 patients of the subgroup population (Table 4), the non-invasive model FAST was added to analysis; a total of 52 (44.4%) patients with high-risk MASH and 65 (55.6%) patients with non-high-risk MASH exhibited significant differences only in FAST, FIB-4, APRI, Forns index, and ARR (P < 0.05), with no statistical significance for S index and GPR (P = 0.51, P = 0.81, respectively).
| Non-invasive models | Subgroup population (n = 117) | High-risk MASH group (n = 52) | Non-high-risk MASH group (n = 65) | P value |
| FAST | 0.5 (0.3, 0.7) | 0.6 (0.5, 0.8) | 0.3 (0.2, 0.5) | < 0.05 |
| FIB-4 | 1.0 (0.6, 1.6) | 1.4 (0.9, 2.6) | 0.7 (0.5, 1.2) | < 0.05 |
| APRI | 0.5 (0.3, 1.0) | 0.7 (0.5, 1.2) | 0.4 (0.2, 0.7) | < 0.05 |
| Forns index | 4.4 ± 1.9 | 5.1 ± 1.9 | 3.9 ± 1.7 | < 0.05 |
| ARR | 0.6 (0.5, 0.8) | 0.7 (0.5, 0.9) | 0.5 (0.4, 0.7) | < 0.05 |
| S index | 0.1 (0.1, 0.2) | 0.2 (0.1, 0.3) | 0.1 (0.1, 0.2) | 0.51 |
| GPR | 0.7 (0.5, 1.2) | 0.7 (0.5, 1.2) | 0.7 (0.4, 1.2) | 0.81 |
We also conducted a statistical analysis of the clinical characteristics for the 117 individuals in the subgroup population and 162 individuals in the remaining population (Table 5). The results did not indicate any statistically significant differences in other parameters between the two cohorts aside from ALT.
| Project | Subgroup population | Remaining population | P value |
| (n = 117) | (n = 162) | ||
| Demographics | |||
| Male | 49 (41.9) | 77 (47.5) | 0.35 |
| Age (yr) | 44.0 (32.0, 53.0) | 40.0 (30.0, 53.3) | 0.38 |
| BMI (kg/m2) | 26.4 ± 3.4 | 27.6 ± 3.4 | 0.08 |
| Metabolic disease | |||
| Dysglycemia | 80 (68.4) | 107 (66.0) | 0.68 |
| Hypertension | 33 (28.2) | 39 (24.1) | 0.44 |
| Hyperlipidemia | 21 (17.9) | 16 (9.9) | 0.05 |
| Hypertriglyceridemia | 69 (59.0) | 81 (50.0) | 0.14 |
| Low HDL | 89 (76.1) | 113 (69.8) | 0.24 |
| Serologic indicators | |||
| TC (mmol/L) | 5.0 ± 1.0 | 4.8 ± 1.0 | 0.19 |
| TG (mmol/L) | 2.0 (1.3, 2.9) | 1.7 (1.3, 2.5) | 0.46 |
| HDL-C (mmol/L) | 1.0 (0.9, 1.2) | 1.0 (0.9, 1.2) | 0.98 |
| LDL-C (mmol/L) | 3.0 ± 0.9 | 2.9 ± 0.8 | 0.43 |
| Fasting blood glucose (mmol/L) | 5.9 (5.5, 6.8) | 5.8 (5.3, 6.7) | 0.38 |
| PLT (× 109/L) | 229.2 ± 71.1 | 218.1 ± 62.0 | 0.17 |
| ALT (U/L) | 72.5 (46.0, 125.0) | 100.1 (62.7, 152.6) | 0.01 |
| AST (U/L) | 46.2 (29.8, 77.4) | 52.5 (34.9, 83.1) | 0.11 |
| ALP (U/L) | 77.6 (66.1, 98.1) | 83.6 (65.6, 101.2) | 0.49 |
| GGT (U/L) | 71.4 (43.5, 105.1) | 58.6 (37.5, 103.2) | 0.25 |
| TBIL (μmol/L) | 12.4 (9.5, 16.4) | 12.3 (9.2, 16.7) | 0.88 |
| ALB (g/L) | 46.6 (42.7, 49.0) | 45.6 (43.1, 48.9) | 0.41 |
| HGB (g/L) | 145.0 (136.0, 156.0) | 143.5 (131.0, 156.1) | 0.16 |
| Apolipoprotein A1 (g/L) | 1.4 (1.2, 1.5) | 1.3 (1.1, 1.5) | 0.22 |
| Apolipoprotein B (g/L) | 1.0 (0.8, 1.1) | 0.9 (0.7, 1.1) | 0.10 |
| Cr (μmol/L) | 61.5 (52.7, 71.3) | 61.5 (52.0, 73.1) | 0.93 |
| Urea (mmol/L) | 4.5 (3.8, 5.2) | 4.7 (3.8, 5.4) | 0.41 |
| Uric acid (μmol/L) | 369.0 (304.0, 436.5) | 363.5 (296.0, 433.0) | 0.64 |
| eGFR (mL/min) | 112.5 (103.4, 120.2) | 107.0 (98.5, 119.5) | 0.24 |
| PT (s) | 11.3 (10.7, 11.9) | 11.3 (10.6, 11.9) | 0.90 |
| Non-invasive models | |||
| FIB-4 | 1.0 (0.6, 1.6) | 0.9 (0.6, 1.6) | 0.88 |
| APRI | 0.5 (0.3, 1.0) | 0.6 (0.4, 1.0) | 0.08 |
| Forns index | 4.4 (3.0, 5.6) | 4.1 (3.0, 5.7) | 0.74 |
| ARR | 0.6 (0.5, 0.8) | 0.5 (0.4, 0.7) | 0.06 |
| S index | 0.1 (0.1, 0.2) | 0.1 (0.1, 0.3) | 0.53 |
| GPR | 0.7 (0.5, 1.2) | 0.7 (0.4, 1.2) | 0.45 |
According to the critical values reported in the literature, we conducted a preliminary analysis of seven non-invasive diagnostic models.
Within the overall population, FIB-4, APRI, Forns index, ARR, S index, and GPR in the high-risk MASH group could potentially obviate the liver biopsy requirement in 25, 23, 17, 20, 11, and 65 individuals, respectively (Figure 2A). Table 6 presents the sensitivity, specificity, PPV, and NPV of these models for diagnosing high-risk MASH. The sensitivities of FIB-4, APRI, Forns index, ARR, and S index were relatively low, at 26.9%, 24.7%, 18.3%, 21.5%, and 11.8% respectively, with the S index value being the lowest. In contrast, GPR sensitivity was higher at 69.9%. Except for GPR, which had a specificity of 44.6%, the other models demonstrated high specificity, exceeding 90.0%. FIB-4 had the highest PPV at 73.5%, followed by APRI, Forns index, and ARR with PPVs of 63.9%, 63.0%, and 58.8% respectively. The S index and GPR had the lowest PPVs at 42.3% and 38.7%, respectively. The NPVs for FIB-4, APRI, Forns index, ARR, S index, and GPR were approximately equivalent, at approximately 70.0%.

| Non-invasive models | High threshold criteria | Sensitivity (%) | Specificity (%) | PPV (%) | NPV (%) | AUROC (95%CI) | P value |
| Overall population | |||||||
| FIB-4 | 2.67 | 26.9 | 95.2 | 73.5 | 72.2 | 0.75 (0.69-0.81) | < 0.05 |
| APRI | 1.50 | 24.7 | 93.0 | 63.9 | 71.2 | 0.69 (0.63-0.76) | < 0.05 |
| Forns index | 6.90 | 18.3 | 94.6 | 63.0 | 69.8 | 0.67 (0.61-0.74) | < 0.05 |
| ARR | 1.00 | 21.5 | 92.5 | 58.8 | 70.2 | 0.68 (0.61-0.74) | < 0.05 |
| S index | 0.50 | 11.8 | 91.9 | 42.3 | 67.6 | 0.62 (0.55-0.69) | < 0.05 |
| GPR | 0.56 | 69.9 | 44.6 | 38.7 | 74.8 | 0.60 (0.53-0.67) | < 0.05 |
| Subgroup population | |||||||
| FAST | 0.67 | 44.2 | 92.3 | 82.1 | 67.4 | 0.82 (0.74-0.90) | < 0.05 |
| FIB-4 | 2.67 | 25.0 | 96.9 | 86.7 | 61.8 | 0.76 (0.68-0.85) | < 0.05 |
| APRI | 1.50 | 19.2 | 96.9 | 83.3 | 60.0 | 0.74 (0.65-0.83) | < 0.05 |
| Forns index | 6.90 | 17.3 | 95.4 | 75.0 | 59.0 | 0.68 (0.58-0.77) | < 0.05 |
| ARR | 1.00 | 23.1 | 87.7 | 60.0 | 58.8 | 0.62 (0.52-0.72) | < 0.05 |
| S index | 0.50 | 7.7 | 95.4 | 57.1 | 56.4 | 0.54 (0.43-0.64) | 0.50 |
| GPR | 0.56 | 63.5 | 32.3 | 42.9 | 52.5 | 0.51 (0.41-0.62) | 0.80 |
In the subgroup population, the number of individuals exempted from liver biopsy based on high threshold values of FAST, FIB-4, APRI, Forns index, ARR, S index, and GPR were 23, 13, 10, 9, 12, 4, 33, respectively as depicted in Figure 2B. Table 6 indicates that within this subset, GPR exhibited higher sensitivity, at 63.5%. The sensitivity of FAST was moderate at 44.2%, whereas those of FIB-4, APRI, Forns index, ARR, and S index were relatively lower. The specificity of FIB-4, APRI, Forns index, ARR, and S index was close to or greater than 90.0%; however, that of GPR was 32.3%. PPVs for FAST, FIB-4, and APRI were 82.1%, 86.7%, and 83.3% respectively, which were higher than those for Forns index, ARR, S index, and GPR at 75.0%, 60.0%, 57.1%, and 42.9%, respectively. NPV for FAST was 67.4%, whereas for the other models (FIB-4, APRI, Forns index, ARR, S index, and GPR), the value approached 60.0%.
The diagnostic efficacy of each non-invasive model for high-risk MASH was visually reflected via constructing ROC curves and calculating the area under the curve (AUROC).
In the overall population, as depicted in Figure 3A and Table 6, the AUROC for FIB-4 surpassed that of APRI, Forns index, ARR, S index, and GPR at 0.75 (95%CI: 0.69-0.81). The AUROC for APRI, Forns index, and ARR were relatively similar, within the range of 0.65-0.70. S index and GPR had the lowest AUROC values, at 0.62 (95%CI: 0.55-0.69) and 0.60 (95%CI: 0.53-0.67) respectively.

In the subgroup, as shown in Figure 3B and Table 6, the AUROC for FAST was the highest at 0.82 (95%CI: 0.74-0.90), followed by those of FIB-4, APRI, Forns index, ARR, S-index and GPR. FIB-4 had a value of 0.76 (95%CI: 0.68-0.85), which was comparable to the overall levels but lower than that of FAST. The AUROC values for Forns index and ARR were comparatively lower, at 0.68 (95%CI: 0.58-0.77) and 0.62 (95%CI: 0.52-0.72), whereas those of S index and GPR were near 0.50.
In clinical practice, the diagnosis of high-risk MASH relies not only on liver biopsy, the gold standard, but also on imaging modalities such as hepatic ultrasound, liver transient elastography (FibroScan), magnetic resonance spec
Based on the liver biopsy results, we analyzed and compared the diagnostic efficacy of FAST, FIB-4, APRI, Forns index, ARR, S index, and GPR for high-risk MASH in a cohort of 279 patients and a subgroup of 117 patients. Histopathologically, the fibrosis stage in the high-risk MASH group was primarily stage F2, which was particularly challenging to differentiate in clinical diagnosis[2]. Moreover, compared with the non-high-risk group, the high-risk MASH group presented with more severe fibrosis, underscoring the significance and necessity of our study. Screening within the MASLD population revealed a 99.4% congruence with NAFLD, consistent with a previous study indicating that 99.0% of patients with NAFLD met the criteria for MASLD[21]. In the data analysis of 279 patients, we observed that high-risk MASH was more prevalent in older adults and women; the underlying reasons for this remain unclear. The disparity in AST levels also indicated more extensive hepatic injury in the high-risk MASH group. Elevated PT and reduced levels of PLT and ALB may correlate with higher degrees of fibrosis or even early-stages of cirrhosis in the high-risk MASH group. Higher prevalence rates of dysglycemia, hypertension, and hyperlipidemia in the high-risk MASH group also supports the hypothesis that metabolic factors may accelerate MASLD progression[22].
In previous studies, FAST, FIB-4, and APRI models also have been investigated for non-invasive diagnosis of NAFLD with fibrosis. FAST was proven to have an AUROC of 0.74-0.95[8] or 0.77[23] in patients with NASH + NAS ≥ 4 + F ≥ 2, compared to 0.66[23] for FIB-4. Meta-analyses also indicated that FAST could effectively replace liver biopsy for diagnosing patients at this stage[24]. Forns index, ARR, S index, and GPR have not been extensively studied in the context of NAFLD. Our study included a broader range of research models and shifted the study population from NAFLD to MASLD, serving as a supplement and validation of previous studies. Our findings showed that FIB-4 demonstrated higher AUROC and PPV values than those of APRI, Forns index, ARR, S index, and GPR, indicating better diagnostic efficacy within the overall population of the 279 patients with MASLD. However, in the subgroup comprising 117 patients, FAST achieved an AUROC value of 0.82 and exhibited higher sensitivity, making it a better substitute for liver biopsy in diagnosing high-risk MASH compared to the other models; however it was closely followed by FIB-4. In this study, APRI, Forns index, and ARR consistently showed moderate diagnostic levels, whereas GPR, despite its higher sensitivity, had almost no diagnostic significance for high-risk MASH when considering other indicators such as PPV and AUROC, similar to S index.
This study has three major limitations. It was a single-center study and may have potential biases, necessitating further clinical validation from multicenter studies with larger sample sizes. Moreover, while FAST, APRI, FIB-4, Forns index, and ARR can spare some patients from liver biopsy, the low sensitivity of these models indicates that many cases may remain undiagnosed, requiring confirmation through liver biopsy or other clinical interventions. Additionally, the characteristics of our retrospective data constrain our selection of other non-invasive diagnostic models such as magnetic resonance imaging-AST[25], MR elastography + FIB-4[3], metabolomics-advanced steatohepatitis fibrosis score[4], and hepatic fibrosis score[26].
Our results reveal that 99.4% patients with NAFLD meet the MASLD diagnostic criteria. FAST and FIB-4 could replace liver biopsy more effectively for diagnosing high-risk MASH compared to APRI, Forns index, ARR, S index, and GPR, with FAST being superior to FIB-4. S index and GPR have no diagnostic significance for high-risk MASH in MASLD.
The authors would like to thank pathologists of Beijing Ditan Hospital, Capital Medical University for their assistance in the research project.
Provenance and peer review: Unsolicited article; Externally peer reviewed.
Peer-review model: Single blind
Specialty type: Gastroenterology and hepatology
Country of origin: China
Peer-review report’s classification
Scientific Quality: Grade B
Novelty: Grade B
Creativity or Innovation: Grade B
Scientific Significance: Grade B
P-Reviewer: Peltec A, Moldova S-Editor: Li L L-Editor: A P-Editor: Yuan YY
| 1. | Riazi K, Azhari H, Charette JH, Underwood FE, King JA, Afshar EE, Swain MG, Congly SE, Kaplan GG, Shaheen AA. The prevalence and incidence of NAFLD worldwide: a systematic review and meta-analysis. Lancet Gastroenterol Hepatol. 2022;7:851-861. [RCA] [PubMed] [DOI] [Full Text] [Cited by in Crossref: 149] [Cited by in RCA: 1179] [Article Influence: 393.0] [Reference Citation Analysis (1)] |
| 2. | Vilar-Gomez E, Calzadilla-Bertot L, Wai-Sun Wong V, Castellanos M, Aller-de la Fuente R, Metwally M, Eslam M, Gonzalez-Fabian L, Alvarez-Quiñones Sanz M, Conde-Martin AF, De Boer B, McLeod D, Hung Chan AW, Chalasani N, George J, Adams LA, Romero-Gomez M. Fibrosis Severity as a Determinant of Cause-Specific Mortality in Patients With Advanced Nonalcoholic Fatty Liver Disease: A Multi-National Cohort Study. Gastroenterology. 2018;155:443-457.e17. [RCA] [PubMed] [DOI] [Full Text] [Cited by in Crossref: 612] [Cited by in RCA: 601] [Article Influence: 85.9] [Reference Citation Analysis (0)] |
| 3. | Kim BK, Tamaki N, Imajo K, Yoneda M, Sutter N, Jung J, Lin T, Tu XM, Bergstrom J, Nguyen K, Nguyen L, Le T, Madamba E, Richards L, Valasek MA, Behling C, Sirlin CB, Nakajima A, Loomba R. Head-to-head comparison between MEFIB, MAST, and FAST for detecting stage 2 fibrosis or higher among patients with NAFLD. J Hepatol. 2022;77:1482-1490. [RCA] [PubMed] [DOI] [Full Text] [Cited by in Crossref: 36] [Cited by in RCA: 66] [Article Influence: 22.0] [Reference Citation Analysis (0)] |
| 4. | Noureddin M, Truong E, Mayo R, Martínez-Arranz I, Mincholé I, Banales JM, Arrese M, Cusi K, Arias-Loste MT, Bruha R, Romero-Gómez M, Iruzubieta P, Aller R, Ampuero J, Calleja JL, Ibañez-Samaniego L, Aspichueta P, Martín-Duce A, Kushner T, Ortiz P, Harrison SA, Anstee QM, Crespo J, Mato JM, Sanyal AJ. Serum identification of at-risk MASH: The metabolomics-advanced steatohepatitis fibrosis score (MASEF). Hepatology. 2024;79:135-148. [RCA] [PubMed] [DOI] [Full Text] [Full Text (PDF)] [Cited by in Crossref: 44] [Cited by in RCA: 38] [Article Influence: 38.0] [Reference Citation Analysis (0)] |
| 5. | Chan WK, Chuah KH, Rajaram RB, Lim LL, Ratnasingam J, Vethakkan SR. Metabolic Dysfunction-Associated Steatotic Liver Disease (MASLD): A State-of-the-Art Review. J Obes Metab Syndr. 2023;32:197-213. [RCA] [PubMed] [DOI] [Full Text] [Full Text (PDF)] [Cited by in Crossref: 95] [Cited by in RCA: 279] [Article Influence: 139.5] [Reference Citation Analysis (1)] |
| 6. | Tong XF, Wang QY, Zhao XY, Sun YM, Wu XN, Yang LL, Lu ZZ, Ou XJ, Jia JD, You H. Histological assessment based on liver biopsy: the value and challenges in NASH drug development. Acta Pharmacol Sin. 2022;43:1200-1209. [RCA] [PubMed] [DOI] [Full Text] [Cited by in Crossref: 12] [Cited by in RCA: 2] [Article Influence: 0.7] [Reference Citation Analysis (0)] |
| 7. | European Association for the Study of the Liver. Clinical Practice Guideline Panel; Chair:; EASL Governing Board representative:; Panel members:. EASL Clinical Practice Guidelines on non-invasive tests for evaluation of liver disease severity and prognosis - 2021 update. J Hepatol. 2021;75:659-689. [RCA] [PubMed] [DOI] [Full Text] [Cited by in Crossref: 993] [Cited by in RCA: 1061] [Article Influence: 265.3] [Reference Citation Analysis (0)] |
| 8. | Newsome PN, Sasso M, Deeks JJ, Paredes A, Boursier J, Chan WK, Yilmaz Y, Czernichow S, Zheng MH, Wong VW, Allison M, Tsochatzis E, Anstee QM, Sheridan DA, Eddowes PJ, Guha IN, Cobbold JF, Paradis V, Bedossa P, Miette V, Fournier-Poizat C, Sandrin L, Harrison SA. FibroScan-AST (FAST) score for the non-invasive identification of patients with non-alcoholic steatohepatitis with significant activity and fibrosis: a prospective derivation and global validation study. Lancet Gastroenterol Hepatol. 2020;5:362-373. [RCA] [PubMed] [DOI] [Full Text] [Full Text (PDF)] [Cited by in Crossref: 556] [Cited by in RCA: 550] [Article Influence: 110.0] [Reference Citation Analysis (0)] |
| 9. | Guidelines for the Prevention, Care and Treatment of Persons with Chronic Hepatitis B Infection. Geneva: World Health Organization; 2015 Mar- . [PubMed] |
| 10. | Forns X, Ampurdanès S, Llovet JM, Aponte J, Quintó L, Martínez-Bauer E, Bruguera M, Sánchez-Tapias JM, Rodés J. Identification of chronic hepatitis C patients without hepatic fibrosis by a simple predictive model. Hepatology. 2002;36:986-992. [RCA] [PubMed] [DOI] [Full Text] [Cited by in Crossref: 672] [Cited by in RCA: 721] [Article Influence: 31.3] [Reference Citation Analysis (0)] |
| 11. | McPherson S, Stewart SF, Henderson E, Burt AD, Day CP. Simple non-invasive fibrosis scoring systems can reliably exclude advanced fibrosis in patients with non-alcoholic fatty liver disease. Gut. 2010;59:1265-1269. [RCA] [PubMed] [DOI] [Full Text] [Cited by in Crossref: 572] [Cited by in RCA: 681] [Article Influence: 45.4] [Reference Citation Analysis (0)] |
| 12. | Zhou K, Gao CF, Zhao YP, Liu HL, Zheng RD, Xian JC, Xu HT, Mao YM, Zeng MD, Lu LG. Simpler score of routine laboratory tests predicts liver fibrosis in patients with chronic hepatitis B. J Gastroenterol Hepatol. 2010;25:1569-1577. [RCA] [PubMed] [DOI] [Full Text] [Cited by in Crossref: 76] [Cited by in RCA: 86] [Article Influence: 5.7] [Reference Citation Analysis (0)] |
| 13. | Zhang W, Sun M, Chen G, An Y, Lv C, Wang Y, Shang Q. Reassessment of gamma-glutamyl transpeptidase to platelet ratio (GPR): a large-sample, dynamic study based on liver biopsy in a Chinese population with chronic hepatitis B virus (HBV) infection. Gut. 2018;67:989-991. [RCA] [PubMed] [DOI] [Full Text] [Full Text (PDF)] [Cited by in Crossref: 11] [Cited by in RCA: 19] [Article Influence: 2.7] [Reference Citation Analysis (0)] |
| 14. | Vilar-Gomez E, Chalasani N. Non-invasive assessment of non-alcoholic fatty liver disease: Clinical prediction rules and blood-based biomarkers. J Hepatol. 2018;68:305-315. [RCA] [PubMed] [DOI] [Full Text] [Cited by in Crossref: 331] [Cited by in RCA: 447] [Article Influence: 63.9] [Reference Citation Analysis (0)] |
| 15. | Rinella ME, Lazarus JV, Ratziu V, Francque SM, Sanyal AJ, Kanwal F, Romero D, Abdelmalek MF, Anstee QM, Arab JP, Arrese M, Bataller R, Beuers U, Boursier J, Bugianesi E, Byrne CD, Castro Narro GE, Chowdhury A, Cortez-Pinto H, Cryer DR, Cusi K, El-Kassas M, Klein S, Eskridge W, Fan J, Gawrieh S, Guy CD, Harrison SA, Kim SU, Koot BG, Korenjak M, Kowdley KV, Lacaille F, Loomba R, Mitchell-Thain R, Morgan TR, Powell EE, Roden M, Romero-Gómez M, Silva M, Singh SP, Sookoian SC, Spearman CW, Tiniakos D, Valenti L, Vos MB, Wong VW, Xanthakos S, Yilmaz Y, Younossi Z, Hobbs A, Villota-Rivas M, Newsome PN; NAFLD Nomenclature consensus group. A multisociety Delphi consensus statement on new fatty liver disease nomenclature. Hepatology. 2023;78:1966-1986. [RCA] [PubMed] [DOI] [Full Text] [Full Text (PDF)] [Cited by in Crossref: 1212] [Cited by in RCA: 1313] [Article Influence: 656.5] [Reference Citation Analysis (0)] |
| 16. | Anstee QM, Lawitz EJ, Alkhouri N, Wong VW, Romero-Gomez M, Okanoue T, Trauner M, Kersey K, Li G, Han L, Jia C, Wang L, Chen G, Subramanian GM, Myers RP, Djedjos CS, Kohli A, Bzowej N, Younes Z, Sarin S, Shiffman ML, Harrison SA, Afdhal NH, Goodman Z, Younossi ZM. Noninvasive Tests Accurately Identify Advanced Fibrosis due to NASH: Baseline Data From the STELLAR Trials. Hepatology. 2019;70:1521-1530. [RCA] [PubMed] [DOI] [Full Text] [Cited by in Crossref: 149] [Cited by in RCA: 209] [Article Influence: 34.8] [Reference Citation Analysis (0)] |
| 17. | Ajmera V, Loomba R. Imaging biomarkers of NAFLD, NASH, and fibrosis. Mol Metab. 2021;50:101167. [RCA] [PubMed] [DOI] [Full Text] [Full Text (PDF)] [Cited by in Crossref: 24] [Cited by in RCA: 134] [Article Influence: 33.5] [Reference Citation Analysis (0)] |
| 18. | Rockey DC, Caldwell SH, Goodman ZD, Nelson RC, Smith AD; American Association for the Study of Liver Diseases. Liver biopsy. Hepatology. 2009;49:1017-1044. [RCA] [PubMed] [DOI] [Full Text] [Cited by in Crossref: 1449] [Cited by in RCA: 1580] [Article Influence: 98.8] [Reference Citation Analysis (1)] |
| 19. | Younossi ZM, Loomba R, Anstee QM, Rinella ME, Bugianesi E, Marchesini G, Neuschwander-Tetri BA, Serfaty L, Negro F, Caldwell SH, Ratziu V, Corey KE, Friedman SL, Abdelmalek MF, Harrison SA, Sanyal AJ, Lavine JE, Mathurin P, Charlton MR, Goodman ZD, Chalasani NP, Kowdley KV, George J, Lindor K. Diagnostic modalities for nonalcoholic fatty liver disease, nonalcoholic steatohepatitis, and associated fibrosis. Hepatology. 2018;68:349-360. [RCA] [PubMed] [DOI] [Full Text] [Cited by in Crossref: 230] [Cited by in RCA: 316] [Article Influence: 45.1] [Reference Citation Analysis (0)] |
| 20. | Crossan C, Majumdar A, Srivastava A, Thorburn D, Rosenberg W, Pinzani M, Longworth L, Tsochatzis EA. Referral pathways for patients with NAFLD based on non-invasive fibrosis tests: Diagnostic accuracy and cost analysis. Liver Int. 2019;39:2052-2060. [RCA] [PubMed] [DOI] [Full Text] [Cited by in Crossref: 33] [Cited by in RCA: 58] [Article Influence: 9.7] [Reference Citation Analysis (0)] |
| 21. | Hagström H, Vessby J, Ekstedt M, Shang Y. 99% of patients with NAFLD meet MASLD criteria and natural history is therefore identical. J Hepatol. 2024;80:e76-e77. [RCA] [PubMed] [DOI] [Full Text] [Cited by in Crossref: 73] [Cited by in RCA: 190] [Article Influence: 190.0] [Reference Citation Analysis (0)] |
| 22. | Yang T, Yin J, Li J, Wang Q. The influence of different combinations of cardiometabolic risk factors on the prevalence of MASLD and risk of advanced fibrosis deserves attention. J Hepatol. 2024;80:e82-e85. [RCA] [PubMed] [DOI] [Full Text] [Cited by in Crossref: 8] [Cited by in RCA: 8] [Article Influence: 8.0] [Reference Citation Analysis (0)] |
| 23. | Chang D, Truong E, Mena EA, Pacheco F, Wong M, Guindi M, Todo TT, Noureddin N, Ayoub W, Yang JD, Kim IK, Kohli A, Alkhouri N, Harrison S, Noureddin M. Machine learning models are superior to noninvasive tests in identifying clinically significant stages of NAFLD and NAFLD-related cirrhosis. Hepatology. 2023;77:546-557. [RCA] [PubMed] [DOI] [Full Text] [Cited by in Crossref: 1] [Cited by in RCA: 42] [Article Influence: 21.0] [Reference Citation Analysis (0)] |
| 24. | Ravaioli F, Dajti E, Mantovani A, Newsome PN, Targher G, Colecchia A. Diagnostic accuracy of FibroScan-AST (FAST) score for the non-invasive identification of patients with fibrotic non-alcoholic steatohepatitis: a systematic review and meta-analysis. Gut. 2023;72:1399-1409. [RCA] [PubMed] [DOI] [Full Text] [Cited by in RCA: 47] [Reference Citation Analysis (0)] |
| 25. | Noureddin M, Truong E, Gornbein JA, Saouaf R, Guindi M, Todo T, Noureddin N, Yang JD, Harrison SA, Alkhouri N. MRI-based (MAST) score accurately identifies patients with NASH and significant fibrosis. J Hepatol. 2022;76:781-787. [RCA] [PubMed] [DOI] [Full Text] [Cited by in Crossref: 14] [Cited by in RCA: 125] [Article Influence: 41.7] [Reference Citation Analysis (0)] |
| 26. | Ampuero J, Pais R, Aller R, Gallego-Durán R, Crespo J, García-Monzón C, Boursier J, Vilar E, Petta S, Zheng MH, Escudero D, Calleja JL, Aspichueta P, Diago M, Rosales JM, Caballería J, Gómez-Camarero J, Lo Iacono O, Benlloch S, Albillos A, Turnes J, Banales JM, Ratziu V, Romero-Gómez M; HEPAmet Registry. Development and Validation of Hepamet Fibrosis Scoring System-A Simple, Noninvasive Test to Identify Patients With Nonalcoholic Fatty Liver Disease With Advanced Fibrosis. Clin Gastroenterol Hepatol. 2020;18:216-225.e5. [RCA] [PubMed] [DOI] [Full Text] [Cited by in Crossref: 124] [Cited by in RCA: 115] [Article Influence: 23.0] [Reference Citation Analysis (0)] |