Published online Mar 28, 2024. doi: 10.3748/wjg.v30.i12.1751
Peer-review started: December 26, 2023
First decision: January 30, 2024
Revised: February 11, 2024
Accepted: March 5, 2024
Article in press: March 5, 2024
Published online: March 28, 2024
Processing time: 93 Days and 5.7 Hours
Thiopurine-induced leucopenia significantly hinders the wide application of thiopurines. Dose optimization guided by nudix hydrolase 15 (NUDT15) has significantly reduced the early leucopenia rate, but there are no definitive biomarkers for late risk leucopenia prediction.
To determine the predictive value of early monitoring of DNA-thioguanine (DNATG) or 6-thioguanine nucleotides (6TGN) for late leucopenia under a NUDT15-guided thiopurine dosing strategy in patients with Crohn’s disease (CD).
Blood samples were collected within two months after thiopurine initiation for detection of metabolite concentrations. Late leucopenia was defined as a leukocyte count < 3.5 × 10⁹/L over two months.
Of 148 patients studied, late leucopenia was observed in 15.6% (17/109) of NUDT15/thiopurine methyltransferase (TPMT) normal and 64.1% (25/39) of intermediate metabolizers. In patients suffering late leucopenia, early DNATG levels were significantly higher than in those who did not develop late leucopenia (P = 4.9 × 10⁻¹³). The DNATG threshold of 319.43 fmol/μg DNA could predict late leucopenia in the entire sample with an area under the curve (AUC) of 0.855 (sensitivity 83%, specificity 81%), and in NUDT15/TPMT normal metabolizers, the predictive performance of a threshold of 315.72 fmol/μg DNA was much more remarkable with an AUC of 0.902 (sensitivity 88%, specificity 85%). 6TGN had a relatively poor correlation with late leucopenia whether in the entire sample (P = 0.021) or NUDT15/TPMT normal or intermediate metabolizers (P = 0.018, P = 0.55, respectively).
Proactive therapeutic drug monitoring of DNATG could be an effective strategy to prevent late leucopenia in both NUDT15/TPMT normal and intermediate metabolizers with CD, especially the former.
Core Tip: This study pioneeringly explores if early proactive monitoring of DNA-thioguanine (DNATG) or 6-thioguanine nucleotides stable concentration within two months could predict late leucopenia susceptible population under a nudix hydrolase 15 (NUDT15) genotype-guided thiopurines dosing strategy in patients with Crohn’s disease. We first provide evidence indicating that early proactive monitoring of DNATG during the initial stages of thiopurine therapy could be an effective strategy to discern patients susceptible to developing late leukopenia, especially in NUDT15/thiopurine methyltransferase normal metabolizers, with a concentration threshold of 315.72 fmol/μg DNA.
- Citation: Yang T, Chao K, Zhu X, Wang XD, Chan S, Guan YP, Mao J, Li P, Guan SX, Xie W, Gao X, Huang M. Early proactive monitoring of DNA-thioguanine in patients with Crohn’s disease predicts thiopurine-induced late leucopenia in NUDT15/TPMT normal metabolizers. World J Gastroenterol 2024; 30(12): 1751-1763
- URL: https://www.wjgnet.com/1007-9327/full/v30/i12/1751.htm
- DOI: https://dx.doi.org/10.3748/wjg.v30.i12.1751
Thiopurines, mercaptopurine (MP), and azathioprine (AZA) have been widely used in inflammatory bowel disease (IBD) for 70 years[1]. However, up to 10%-30% of patients discontinue therapy primarily due to adverse effects. Thiopurine-induced leucopenia is one of the most common and potentially fatal toxicities, particularly in Asian populations[2].
Thiopurine methyltransferase (TPMT), a key enzyme in thiopurine metabolism, is involved in the inactive conversion of thiopurines. TPMT polymorphisms are significantly associated with thiopurine-induced leucopenia and have been a landmark discovery in genomics to guide the clinical application of thiopurines. However, the guiding value of TPMT for thiopurine clinical usage is very limited in Asia, because the mutation frequency of TPMT*3C, as the most prevalent variant in Asia, is only 1%-3%[3,4]. Until 2014, a genome-wide association study in Korea revealed a common missense variant, nudix hydrolase 15 (NUDT1)*3 (rs116855232, R139C, p.Arg139Cys), which strongly increased individual susceptibility to thiopurine-induced leucopenia, bringing the gospel to Asian patients for safe use of thiopurines[5].
Thiopurine-induced leucopenia occurs at any time during treatment, ranging from early (within two months) to late onset (over two months)[6,7]. Thiopurine-induced severe, early-onset leucopenia, we now know, can be attributed largely to NUDT15 deficiency. Since its introduction, the highly predictive value of NUDT15*3 for thiopurine-induced leucopenia, mainly for early leucopenia (within two months), has been consistently confirmed, but so far, no definitive conclusion has been reached concerning late leucopenia (over two months)[5,8-10]. In a prospective study, we showed that halved dosage for NUDT15*3 heterozygous patients reduced the incidence of early leucopenia by approximately 50%, but it did not reduce the risk of late leucopenia[9]. Similar findings were also reported in a Japanese study[10]. As thiopurine-induced late leucopenia is common, occurring in as high as 20%-40% of IBD patients[5,8,10], regular follow-up and therapeutic drug monitoring (TDM) are crucial during long-term thiopurine maintenance therapy.
Thiopurine drugs need to undergo extensive enzymatic conversion into 6-thioguanine nucleotides (6TGN) to exert their pharmacological and cytotoxic action. The role of the 6TGN level as an integral component of thiopurine monitoring to minimize adverse reactions has been investigated for decades[1,11-13]. However, whether 6TGN monitoring can reduce thiopurine-induced leucopenia is controversial and debatable[8,13-17]. Two studies have recently shown that late DNA-thioguanine (DNATG), a NUDT15-associated subcellular DNA-incorporated thiopurine metabolite, was strongly related to thiopurine-induced late leucopenia, compared to 6TGN[3,16].
Therefore, it is necessary to verify whether proactive TDM of DNATG or 6TGN in the initial medication phase can predict the occurrence of late leucopenia. After all, early identification of patients at risk of thiopurine-induced late leucopenia is of greater significance than metabolite concentration monitoring after routine blood tests indicating signs of leucopenia.
Herein, we conducted a prospective observational study to explore whether early proactive TDM of DNATG stable concentration within two months could help predict the leucopenia-susceptible population under a NUDT15 genotype-guided thiopurine dosing strategy in patients with Crohn’s disease (CD)[9], compared with 6TGN concentrations over the same period.
Patients diagnosed with CD from June 2019 to December 2022 were recruited in the Sixth Affiliated Hospital, Sun Yat-sen University. After prescribed thiopurines, patients were clinically followed up within two months when blood specimens were collected for TDM (6TGN, DNATG), and every two to three months thereafter. At each follow-up visit, clinical data, and routine blood tests were recorded. Medication adherence was followed up prospectively for a minimum duration of six months to monitor whether leucopenia occurred.
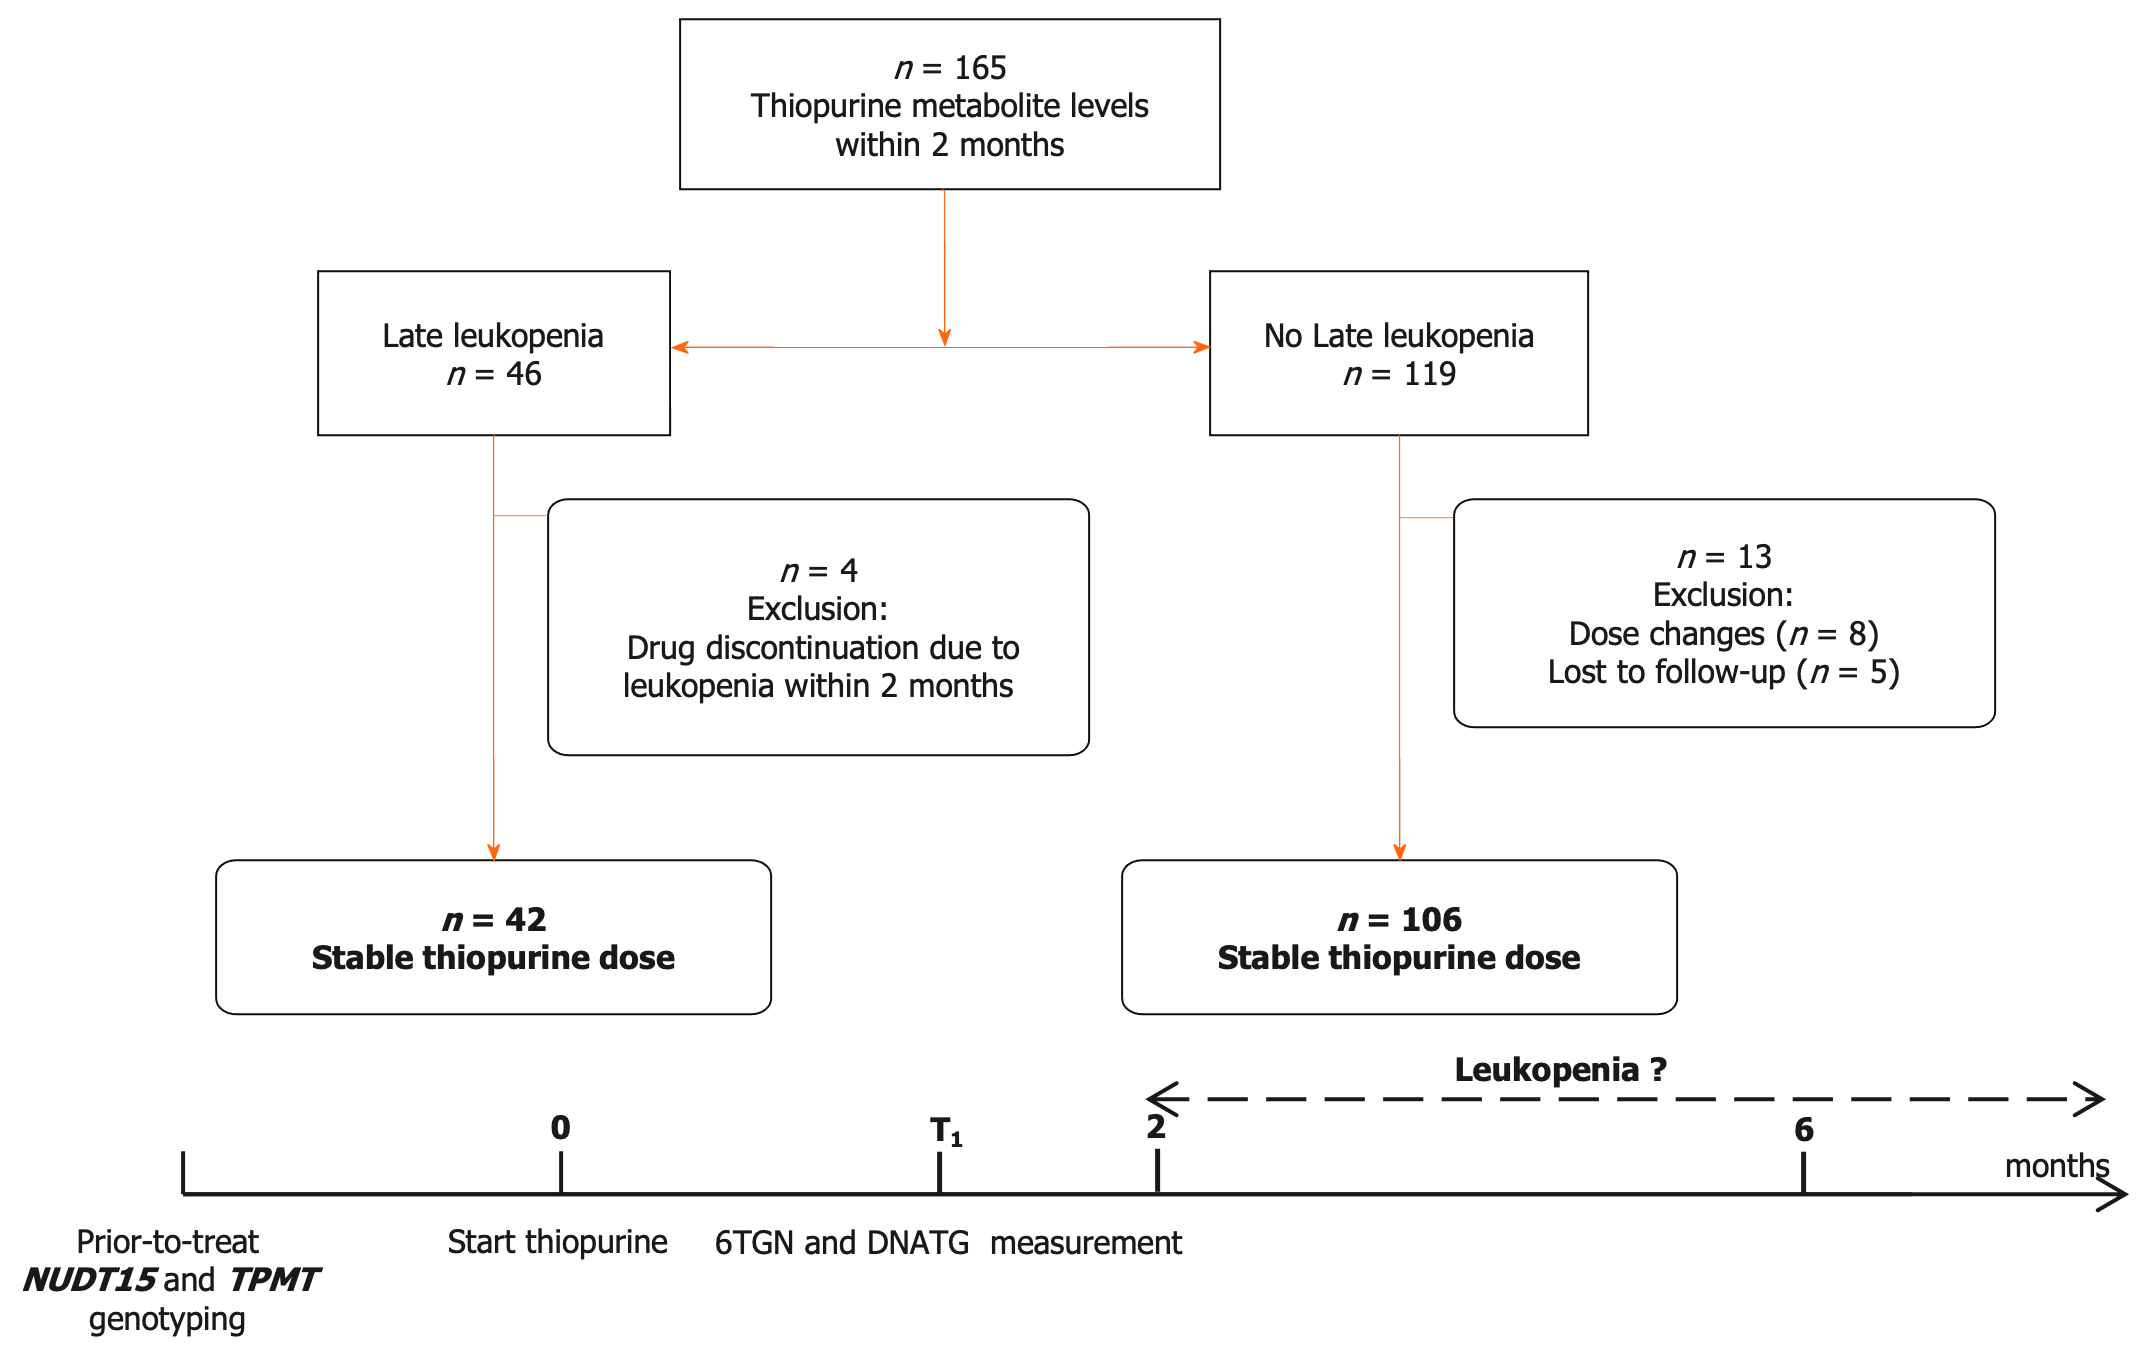
NUDT15 and TPMT genotypes were detected before treatment initiation. Patients with NUDT15 wild-type were prescribed the target dose of 2.0 mg/kg/d AZA or 1.0 mg/kg/d 6-MP, and heterozygous patients were administered the target dose of 1.0 mg/kg/d AZA or 0.5 mg/kg/d 6-MP. Thiopurines were contraindicated in patients with homozygous mutations. The initial dose of AZA was 1.0 mg/kg/d in the wild-type group or 0.5 mg/kg/d in the heterozygous group and then increased to the target dosage in approximately one to two weeks[9]. The dose of 6-MP in mg/kg body weight was obtained by multiplying the dose of AZA by 0.5 as a conversion factor. DNATG and 6TGN levels were determined within the two-month follow up during which patients were medication stable and did not complain of any thiopurine-induced discomfort. The design of this study is depicted in Figure 1.
The clinical information was recorded at every visit until thiopurine discontinuation due to inefficacy, adverse drug reactions, and poor adherence/loss to follow-up. A white blood cell count < 3.5 × 10⁹/L after two or more months of treatment was defined as thiopurine-induced late leucopenia. The exclusion criteria were as follows: Patients with blood transfusion or administration of cyclosporine or methotrexate; patients with insufficient function of the heart, liver, or kidneys; patients with active infection at the sampling time point; and patients suffering from acute adverse reactions within two months. The present study was approved by the Ethics Committee of the Sixth Affiliated Hospital of Sun Yat-sen University. This trial is registered with the Chinese Clinical Trials Register (No. ChiCTR2100050295). All patients recruited provided a written informed consent form to participate in the trial.
DNA was extracted from peripheral leukocytes according to the manufacturer’s instructions (TIANGEN DP349-02, Beijing, China). TPMT*2 (rs1800462, G238C), *3A (rs100460 and rs1142345), *3B (rs100460, G460A), *3C (rs1142345, A719G), and NUDT15*3 (rs116855232, C415T), *5 (rs186364861, G52A), and *6 (rs746071566) genotypes were determined by Sanger sequencing. Detailed methods of quantitative detection of DNATG concentration in leukocytes and 6TGN concentration in erythrocytes have been published previously[3].
Statistical analyses were performed using GraphPad Prism 9.5 (GraphPad, La Jolla, CA, United States) and R software (version 4.2.1; R Foundation). The continuous values are shown as medians (ranges) or median ± interquartile range (IQR) according to the distribution of the values. The nonparametric Spearman test was used for all correlation analyses. χ2 and Fisher’s exact probability tests were used to analyze categorical data, while Mann-Whitney tests were used to analyze measurement data.
The performance and a target threshold of 6TGN or DNATG were evaluated by computing receiver operating characteristic (ROC) curves and the area under the ROC curves (AUC) using the pROC package in R. Cumulative incidence rates of late leucopenia during follow-up were constructed using the Kaplan-Meier method, and the survival curves were compared using the log-rank test with survival and survminer packages in R. Cox proportional hazards regression was used for both univariate and multivariate analysis of thiopurine-induced late leucopenia. Data visualization was performed in Prism 9.5 and the R packages survminer, rms and, ggplot2. Statistical significance was indicated at the 0.05 level.
The flow chart of patient enrollment, exclusion, and follow-up is depicted in Figure 1. A total of 165 patients were recruited in this study, and 17 patients were excluded due to drug discontinuation/dose change/loss of follow-up. A total of 148 patients with DNATG and 6TGN measurements within two months were analyzed in this study. The median patient follow-up time was 13.1 months, with 82.4% of patients followed longitudinally for six months or more. In our study, late leucopenia was observed in 15.6% (17/109) of the NUDT15/TPMT normal and 64.1% (25/39) of intermediate metabolizers, consistent with previous observations in similar populations[4,9,15,18]. Of the 148 patients, 3 were heterozygous for TPMT*3C, and 37 were heterozygous for low activity NUDT15 alleles (21 NUDT15*1/*3, 14 NUDT15*1/*2, 2 NUDT15*1/*6). There were no significant differences in sex, age, dose, weight, comedication, or hematologic indices except for platelets (Table 1).
| Characteristics | Patients | P value | Odds ratio (95%CI) | |
| Leucopenia | Nonleucopenia | |||
| Number of subjects (%) | 42 (28.4) | 106 (71.6) | ||
| Female, n (%) | 14 (33.3) | 22 (20.8) | 0.11 | 1.91 (0.86-4.23) |
| Age (yr) | 29 (12-59) | 26 (13-61) | 0.03 | 0.96 (0.92-0.99) |
| Azathioprine, n (%) | 37 (26.6) | 102 (73.4) | Reference | 0.29 (0.07-1.14) |
| 6-mercaptopurine, n (%) | 5 (55.6) | 4 (44.4) | 0.08 | 1.05 (1.01-1.10) |
| Thiopurine dose (mg) | 87.5 (25-100) | 75 (50-150) | 0.76 | 0.99 (0.98-1.01) |
| Azathioprine | 75 (25-100) | 75 (50-150) | ||
| 6-mercaptopurine | 50 (37.5-50) | 37.5 (25-50) | ||
| Weight (kg) | 52 (40-69) | 55 (37-79) | 0.02 | 1.05 (1.01-1.10) |
| Hematologic indices | ||||
| Leukocyte count (109/L) | 6.25 (4.09-16.66) | 6.92 (4.09-17.60) | 0.83 | 1.31 (0.11-15.71) |
| Absolute neutrophil count (109/L) | 3.98 (1.30-15.55) | 4.59 (1.91-14.76) | 0.78 | 0.70 (0.06-8.31) |
| Absolute lymphocyte count (109/L) | 1.64 (0.41-4.45) | 1.53 (0.27-4.26) | 0.79 | 0.94 (0.57-1.53) |
| Monocyte count (109/L) | 0.49 (0.22-1.98) | 0.57 (0.10-1.72) | 0.66 | 1.29 (0.42-3.91) |
| Hemoglobin (g/L) | 126 (76-165) | 130 (66-166) | 0.43 | 1.01 (0.99-1.02) |
| Platelets (109/L) | 287 (122-589) | 302 (150-680) | 0.10 | 1.00 (0.99-1.01) |
| Comedication (%) | ||||
| Anti-TNF agents | 2 (4.76) | 16 (15.09) | 0.49 | 0.46 (0.05-4.09) |
| Corticosteroids | 2 (4.76) | 5 (4.72) | 0.76 | 1.41 (0.16-12.47) |
| Genotypes (phenotypes) | ||||
| NUDT15*1/*1 (NM) | 18 (42.86) | 93 (87.74) | Reference | |
| NUDT15*1/*3 (IM) | 13 (30.95) | 8 (7.55) | 0.95 | 0.97 (0.34-2.72) |
| NUDT15*1/*2 (IM) | 9 (21.43) | 5 (4.72) | 0.61 | 1.42 (0.37-5.44) |
| NUDT15*1/*6 (IM) | 2 (4.76) | 0 | 0.99 | |
| TPMT*1/*1 (NM) | 40 (95.24) | 105 (99.06) | Reference | |
| TPMT*1/*3C (IM) | 2 (4.76) | 1 (0.94) | 0.19 | 0.94 (0.47-2.35) |
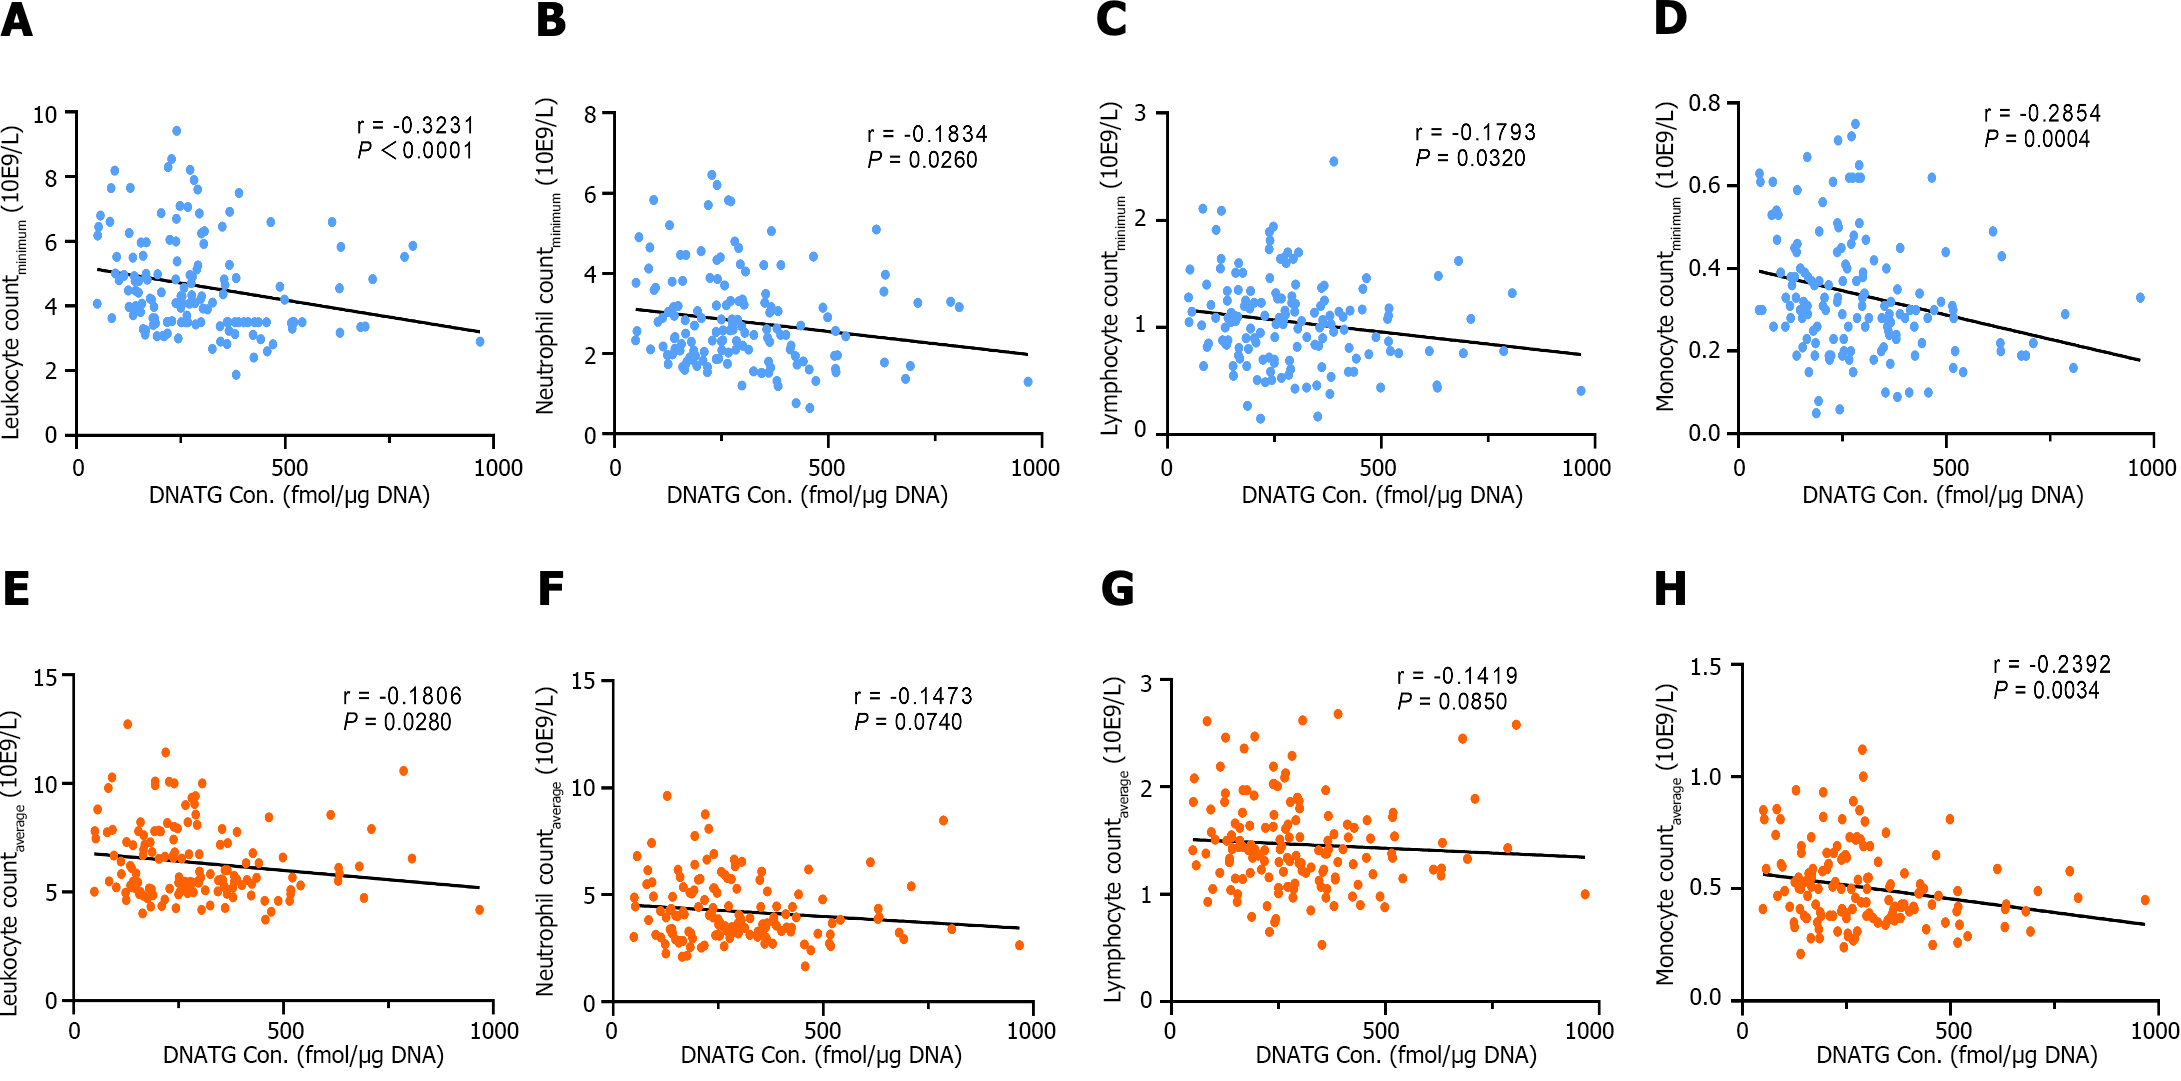
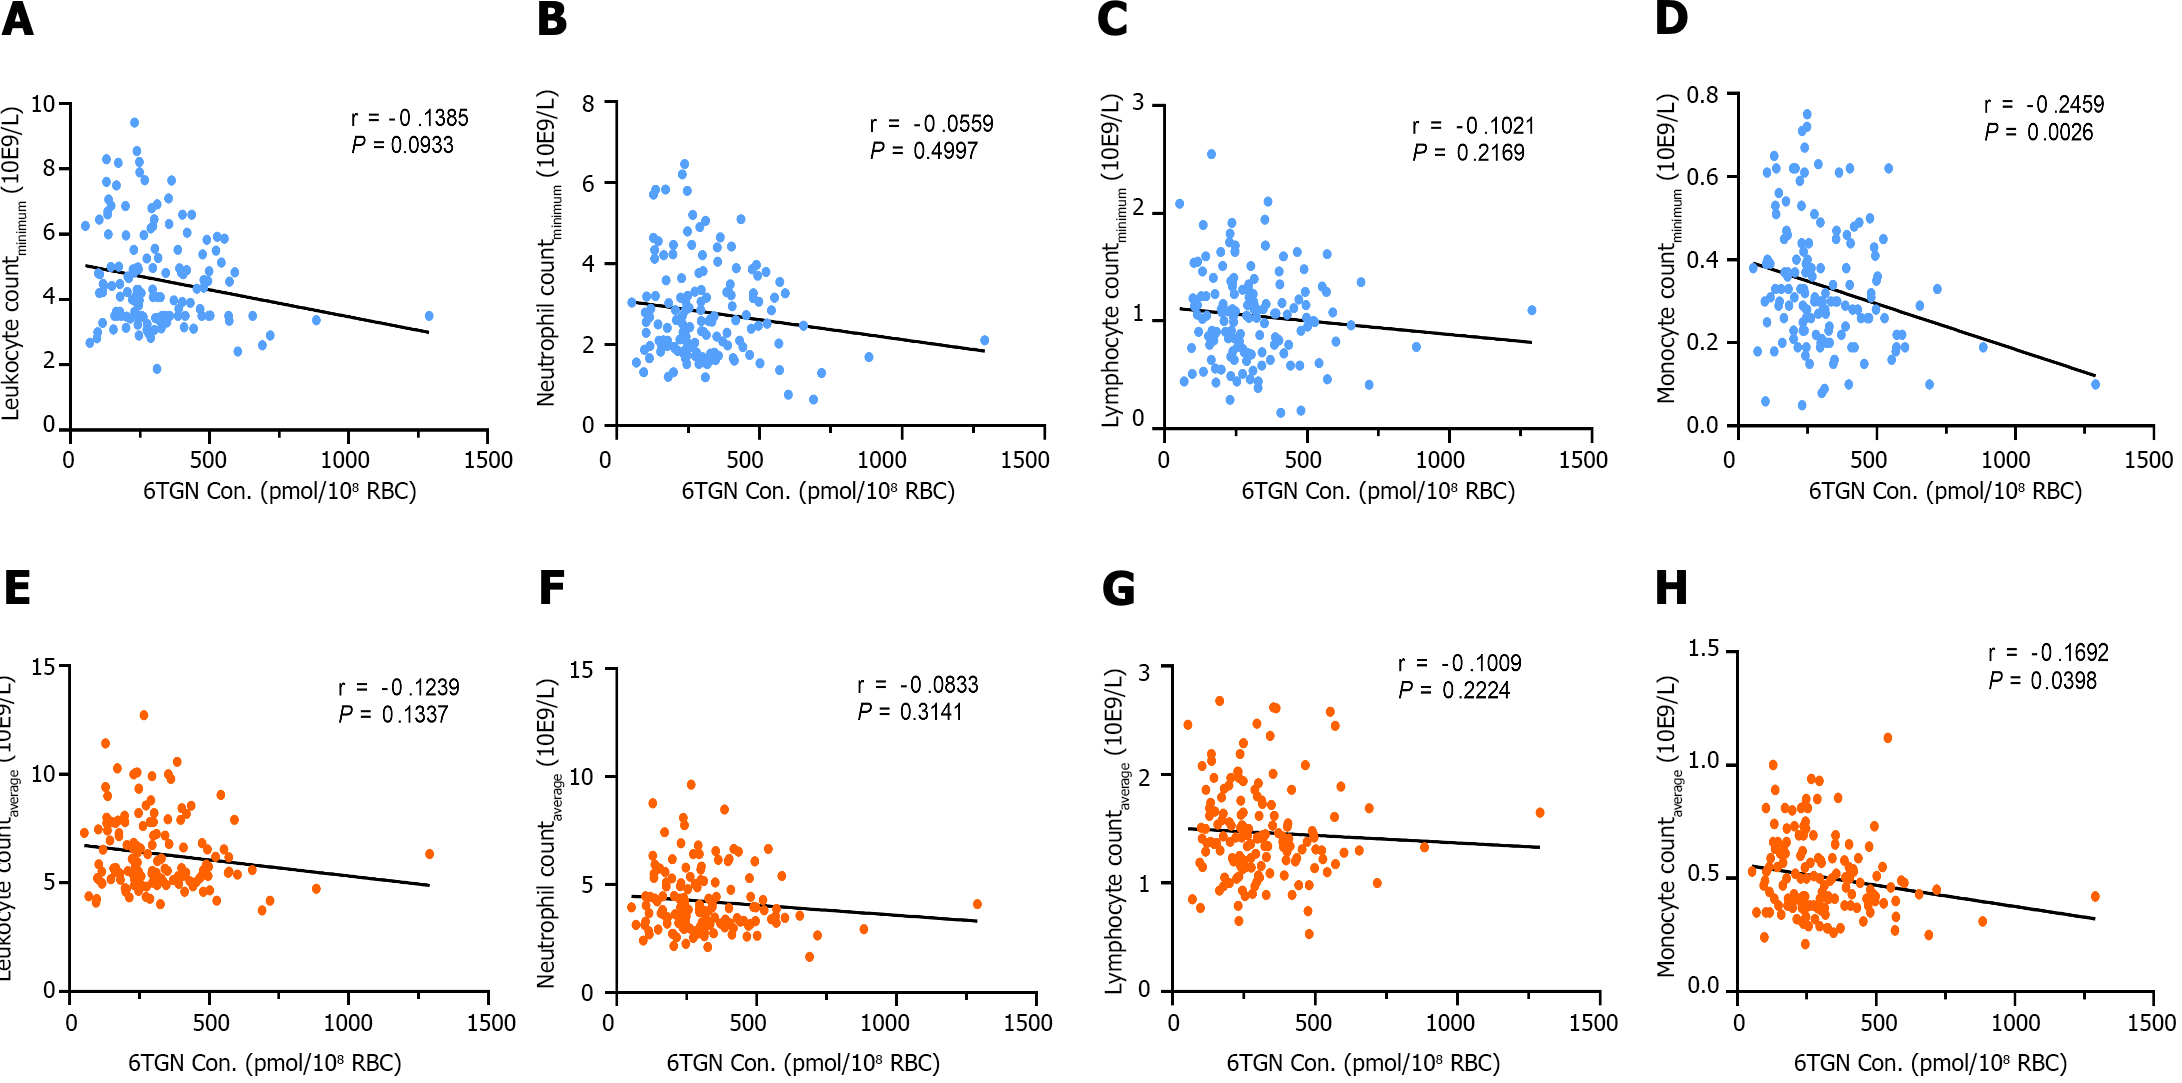
There was a significant negative correlation between early DNATG concentration and the minimum peripheral leukocyte, neutrophil, lymphocyte, and, monocyte counts during follow-up (r = -0.3231, P < 0.0001; r = -0.1834, P = 0.0260; r =
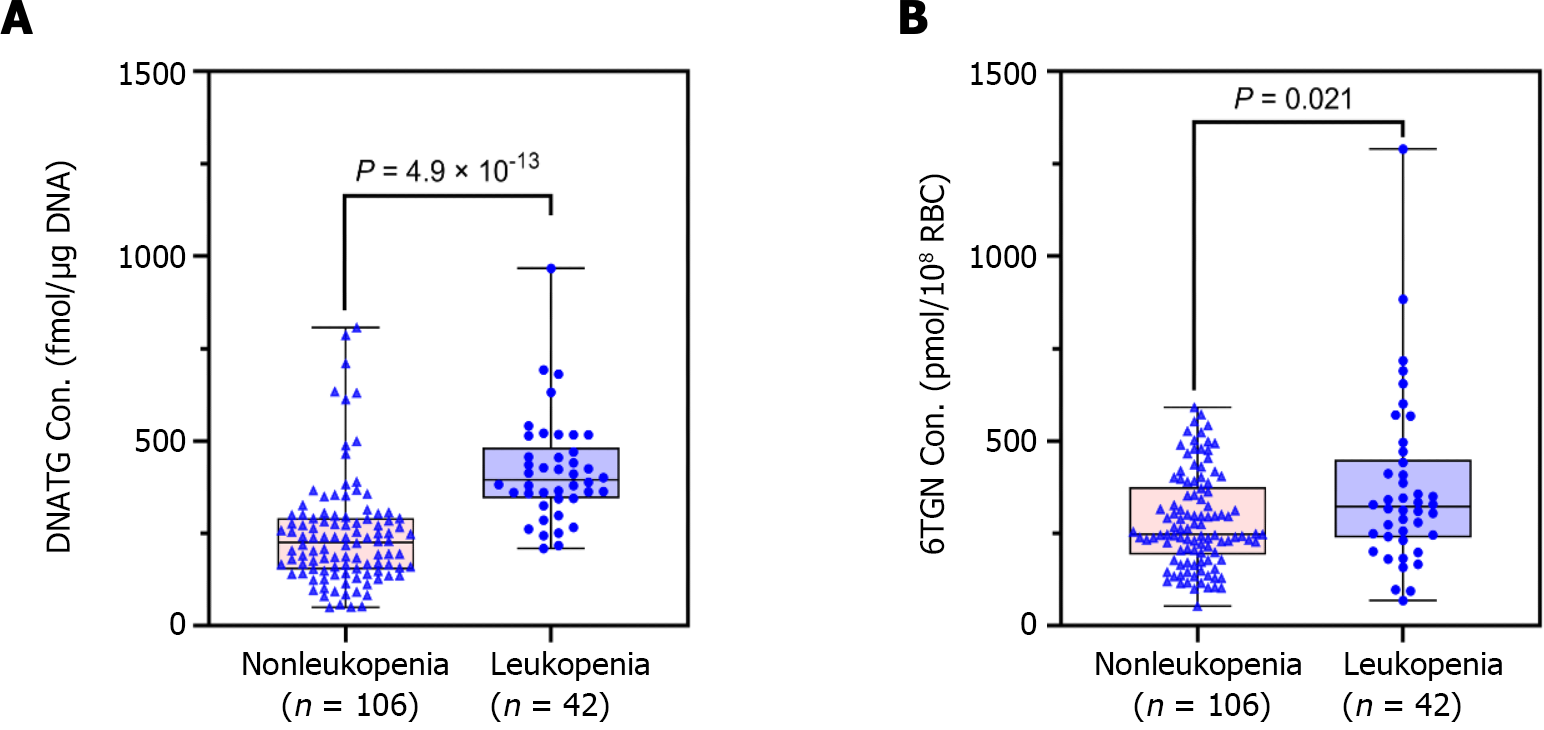
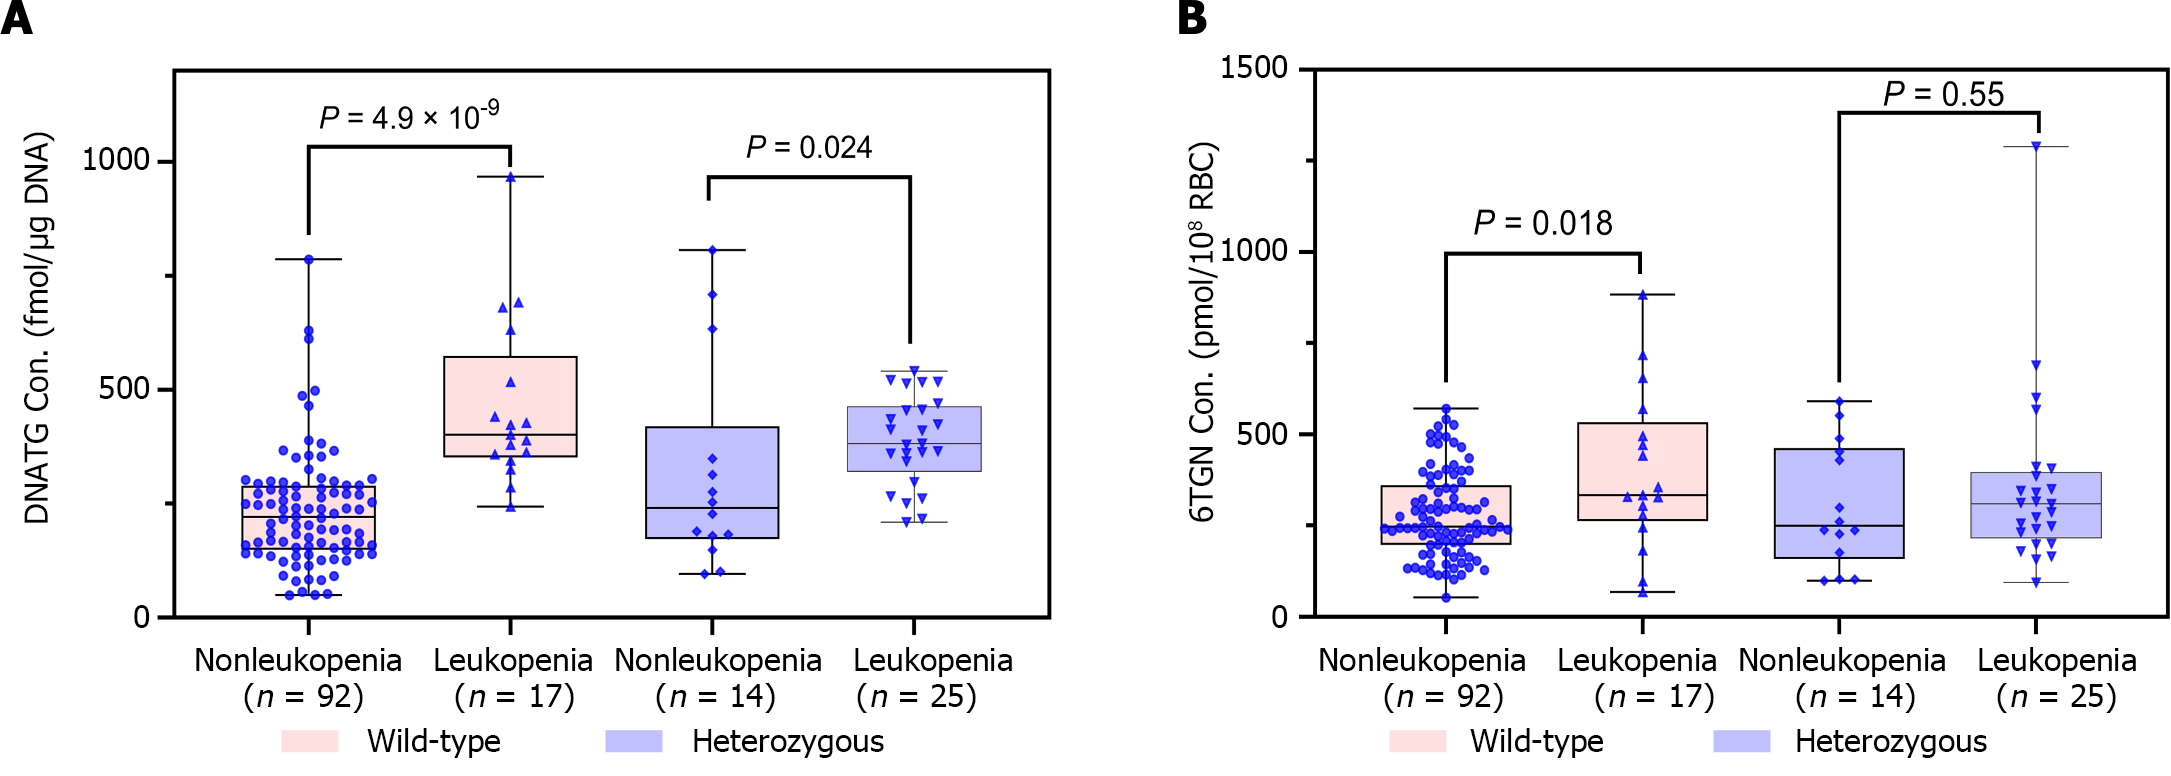
Median early DNATG concentrations were much higher in patients who developed late leucopenia than in those who did not [394.9 ± 137.4 fmol/μg DNA (n = 42) vs 225.3 ± 139.6 fmol/μg DNA (n = 106), P = 4.9 × 10⁻¹³, Figure 4A]. In patients with TPMT/NUDT15 wild-type (n = 109)], early DNATG concentration [401.1 ± 222.9 fmol/μg DNA (n = 17) vs 221.1 ± 140.8 fmol/μg DNA (n = 92), P = 4.9 × 10⁻⁹, Figure 5A] was associated with late leucopenia with much higher significance than in heterozygous patients [382.5 ± 143.1 fmol/μg DNA (n = 25) vs 240.5 ± 248.3 fmol/μg DNA (n = 14), P = 0.024; 3 for TPMT*3C, 21 for NUDT15*3, 2 for NUDT15*6, 14 for NUDT15*2, Figure 5A].
By contrast, median early 6TGN concentrations were slightly higher in patients who developed late leucopenia than in those who did not [322.4 ± 210.6 pmol/8 × 108 red blood cells (RBCs) (n = 42) vs 247.5 ± 182.5 pmol/8 × 108 RBCs (n = 106), P = 0.021, Figure 4B]. Notably, the early 6TGN concentration did not exhibit a significant difference in TPMT/NUDT15 heterozygous patients with or without late leucopenia [310.0 ± 180.6 pmol/8 × 108 RBCs (n = 25) vs 249.9 ± 303.9 pmol/8 × 108 RBCs (n = 14), P = 0.55], although it did in TPMT/NUDT15 wild-type patients with or without late leucopenia [333.7 ± 270.7 pmol/8 × 108 RBCs (n = 17) vs 247.5 ± 162.9 pmol/8 × 108 RBCs (n = 92), P = 0.018] (Figure 5B).
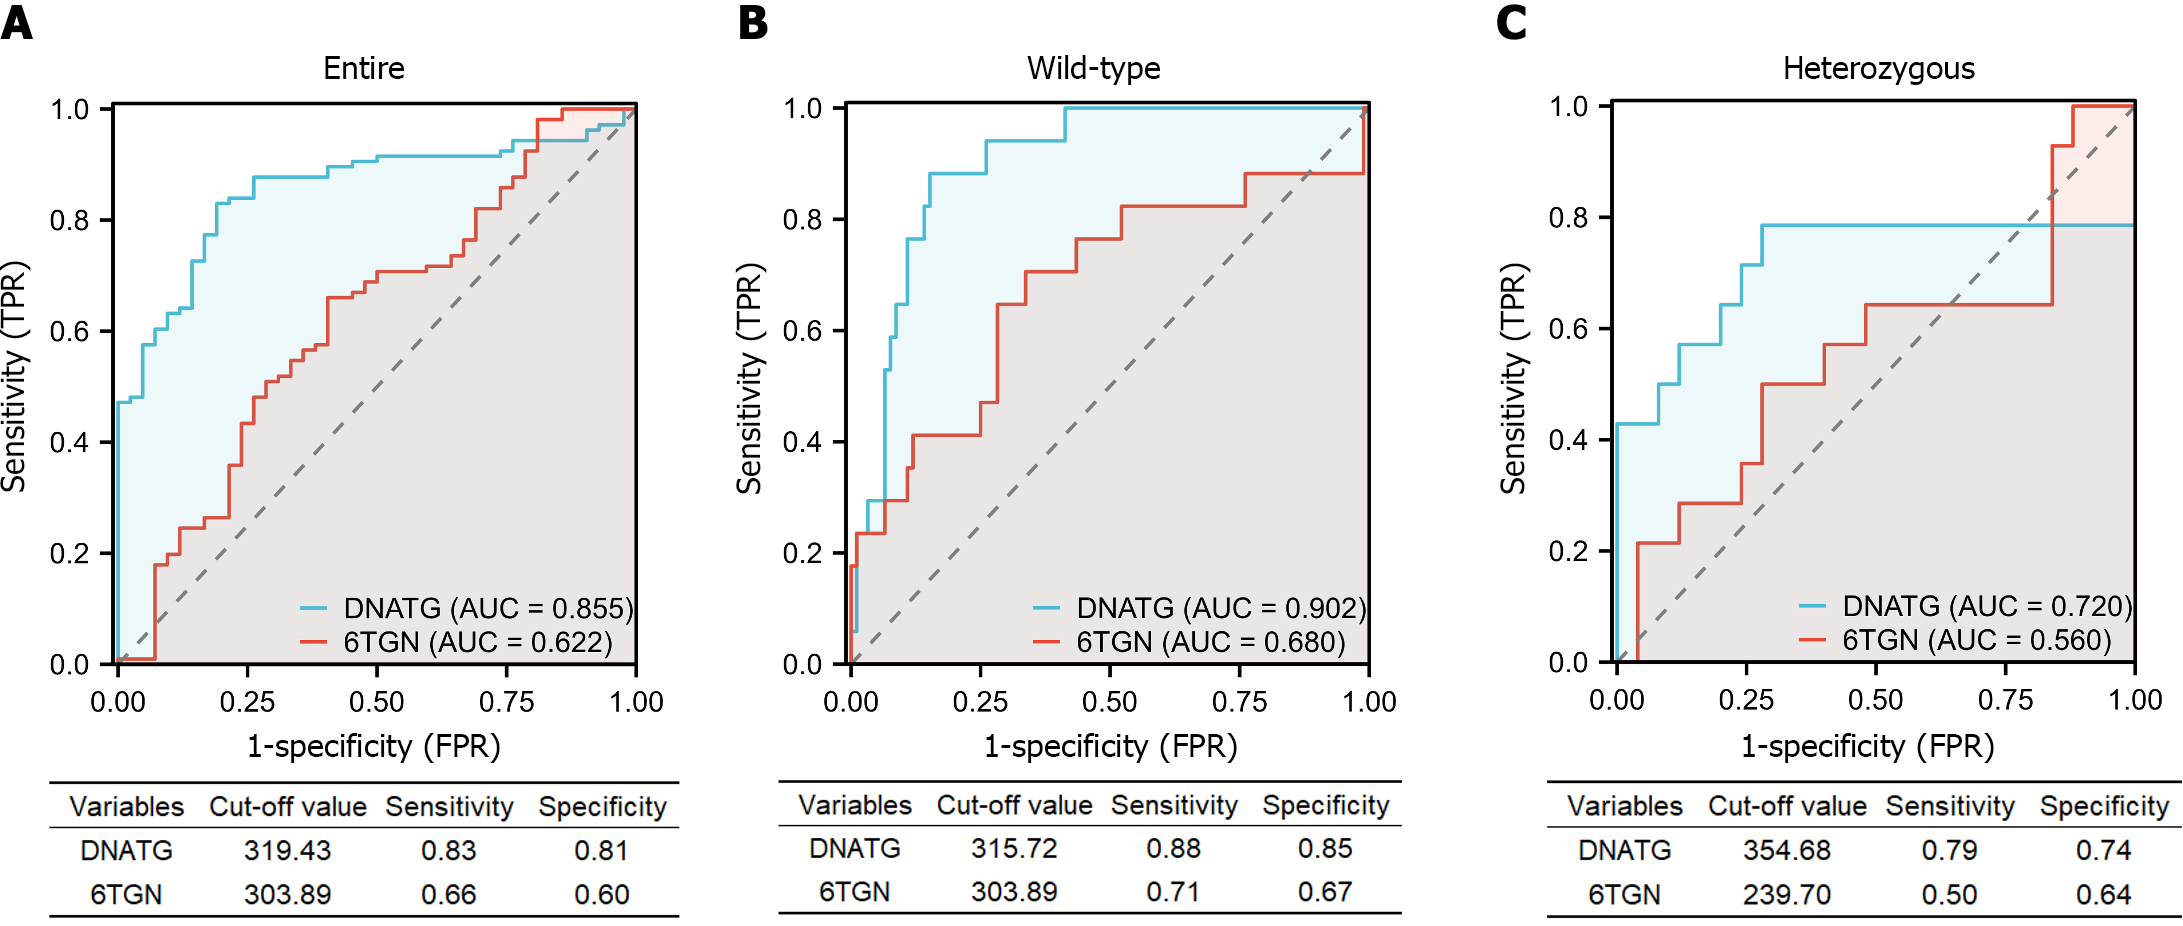
The AUC of the ROC analysis for early DNATG concentrations was 0.855 (sensitivity 83%, specificity 81%) in the total population (Figure 6A), 0.902 (sensitivity 88%, specificity 85%) in TPMT/NUDT15 wild-type (Figure 6B), and 0.72 (sensitivity 79%, specificity 72%) in heterozygous subgroups (Figure 6C) and the cutoff values of DNATG were 319.43, 315.72, and 354.68 fmol/μg DNA, respectively.
The AUC of the ROC analysis for early 6TGN concentration was 0.622 (sensitivity 66%, specificity 60%) in the total population (Figure 6A), 0.680 (sensitivity 71%, specificity 67%) in TPMT/NUDT15 wild-type (Figure 6B), and 0.560 (sensitivity 50%, specificity 64%) in heterozygous subgroups (Figure 6C). Additionally, discontinuations occurred in 35.7% (15/42) of patients who developed late leucopenia (median follow-up: 5.8 months), with 80% (12/15) of them taking the drug for less than a year. Similarly, early DNATG levels were much more impressive in predicting discontinuation events due to recurrent leucopenia, with an AUC of 0.812 (sensitivity 87%, specificity 77%) in the total population, and 0.864 (sensitivity 100%, specificity 67%) in the TPMT/NUDT15 wild-type population (Supplementary Figure 1).
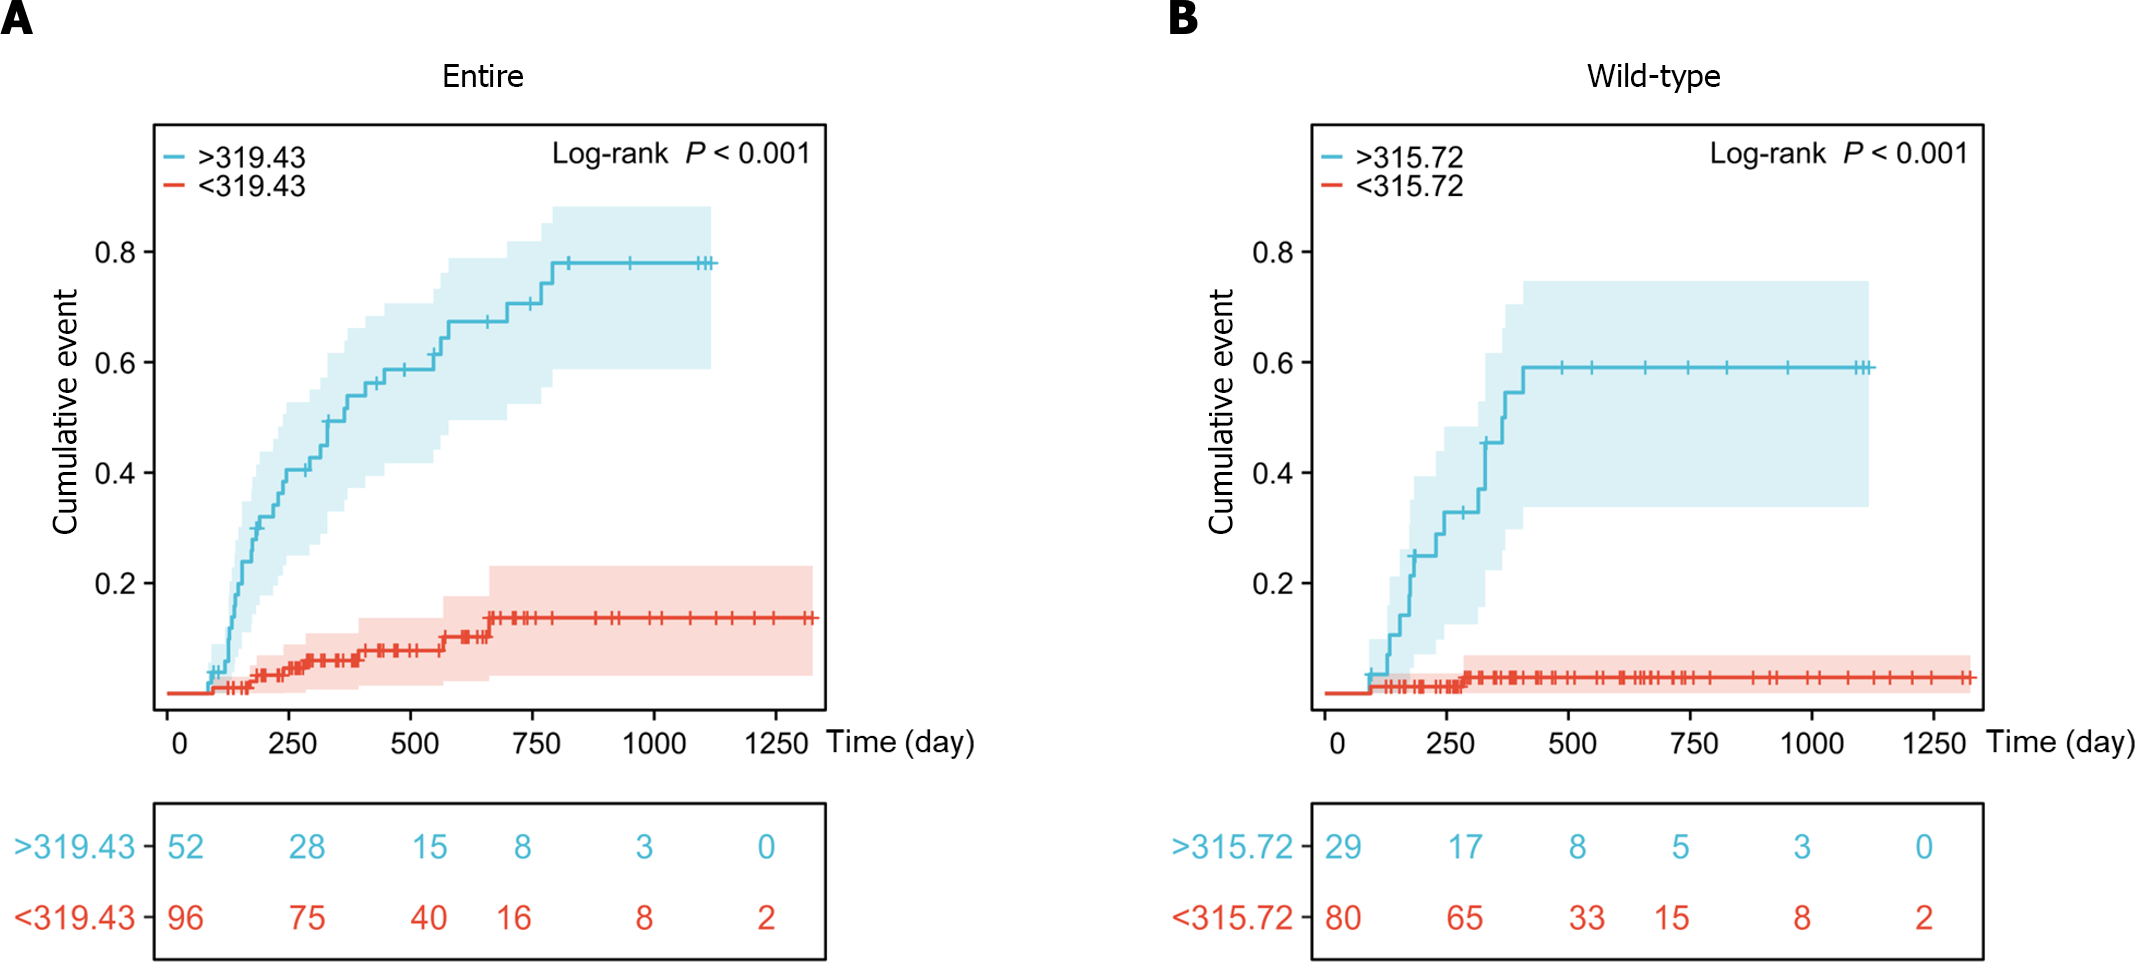
Kaplan-Meier survival analysis showed that the cumulative incidence rates of late leucopenia during follow-up were significantly increased in patients with DNATG concentrations greater than 319.43 fmol/μg DNA in the total population and 315.72 fmol/μg DNA in the TPMT/NUDT15 wild-type population (Figure 7).
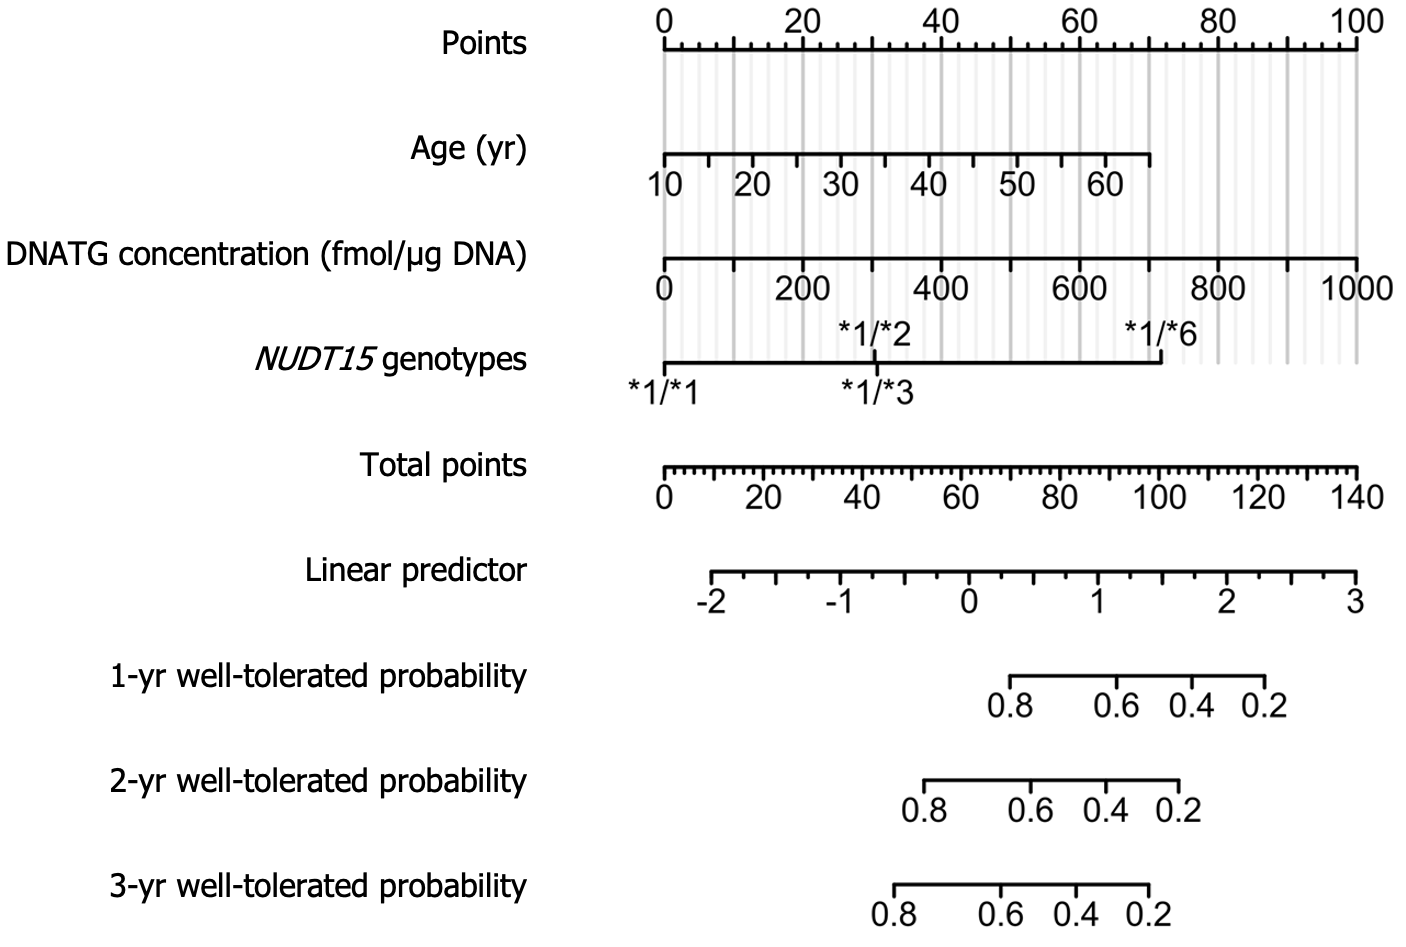
Univariate Cox regression analysis of 148 patients on stable thiopurine therapy showed that age, weight, early DNATG and 6TGN concentrations, and NUDT15 genotypes were relevant determinants for the development of late leucopenia (P < 0.1). After discarding the nonsignificant factors, 6TGN concentrations, in the multivariate analysis, the final Cox model included age, early DNATG concentration, and NUDT15 genotypes (P < 0.05). Predictive variables and hazard ratios for the development of leucopenia are presented in Table 2. To improve the feasibility of clinical application, a nomogram based on multivariate analysis results is shown in Figure 8.
| Characteristics | Univariate analysis | Multivariate analysis | ||
| HR (95%CI) | P value | HR (95%CI) | P value | |
| Age (yr) | 1.04 (1.01-1.08) | 0.005 | 1.06 (1.02-1.09) | 0.002 |
| Weight (kg) | 0.95 (0.91-0.99) | 0.013 | 0.96 (0.92-1.00) | 0.076 |
| DNATG (fmol/μg DNA) | 1.004 (1.002-1.005) | < 0.001 | 1.004 (1.002-1.005) | < 0.001 |
| NUDT15 genotypes | < 0.001 | |||
| NUDT15*1/*1 | Reference | Reference | ||
| NUDT15*1/*6 | 17.99 (3.95-81.90) | < 0.001 | 11.62 (1.51-89.26) | 0.018 |
| NUDT15*1/*3 | 4.93 (2.41-10.10) | < 0.001 | 3.21 (1.54-6.71) | 0.002 |
| NUDT15*1/*2 | 4.50 (2.01- 10.03) | < 0.001 | 3.25 (1.41-7.50) | 0.006 |
| 6TGN (pmol/8 × 108 RBC) | 1.003 (1.001-1.004) | < 0.001 | 1.000 (0.998-1.002) | 0.98 |
| Sex | 0.19 | |||
| Female | Reference | |||
| Male | 0.64 (0.34-1.22) | 0.17 | ||
| TPMT genotypes | 0.31 | |||
| TPMT*1/*1 | Reference | |||
| TPMT*1/*3C | 2.38 (0.57-9.87) | 0.25 | ||
This is the first time that the DNATG level has been reported to be applicable in the prediction of thiopurine-induced late leucopenia. To date, few studies have been conducted to determine the worth of DNATG level and its correlation with thiopurine-induced late leucopenia in IBD patients. In our previous study, we found that late DNATG levels were significantly correlated with late leucopenia and were a better independent factor for late leucopenia than 6TGN. Therefore, we proposed that proactive quantification of DNATG may be a good way to predict late leucopenia and this prospective observational study was conducted thereafter. In this study, we also found that early DNATG concentrations were consistent with late concentrations in representative patients with multiple follow-up DNATG measurements (Supplementary Figure 2), which further indicated the reliability and feasibility of early proactive quantification of DNATG.
In the previous decade, investigations on individualized thiopurines were mainly focused on genotypes of TPMT and NUDT15. The Clinical Pharmacogenetics Implementation Consortium guidelines recommend initial thiopurine dose adjustment based on TPMT and NUDT15 genotypes[19]. Numerous studies have consistently reported that NUDT15 variants serve as the sole or major factors linked to thiopurine-induced early leucopenia, exhibiting a sensitivity and specificity higher than 90%, while TPMT variants demonstrate a sensitivity of 12.1% and a specificity of 97.6%[5]. In addition, some studies have also shown an association between NUDT15 variants and late leucopenia[8]. In the present study, we verified that NUDT15 was a significant independent factor for late risk, and therefore, the importance of pretreatment for the determination of the NUDT15 genotype cannot be overemphasized.
Nonetheless, a large portion of thiopurine-induced leucopenia cannot be explained by NUDT15/TPMT deficiency, which was manifested by the variation in leucopenia in patients receiving optimized thiopurines based on the genotype of NUDT15/TPMT[9]. Meanwhile, a high incidence of late leucopenia (10%-20%) can still be seen in the NUDT15/TPMT wild-type population[3,4,9,18]. It is very important to identify biomarkers for risk in the populations mentioned above.
TDM of 6TGN has been employed in some clinical settings as a strategy to predict thiopurine-induced toxicity for over two decades although the value of 6TGN TDM is still controversial[20-22]. Kang et al[23] reported that the 6-TGN level (goal < 167.1 pmol/8 × 108 RBCs) could be used to adjust AZA doses to reduce late thiopurine-induced leucopenia in NUDT15 intermediate metabolizers.
However, a large number of studies have shown that 6TGN levels are not significantly different between groups with and without leucopenia[8,13-16]. In our previous study[4], late 6TGN levels were significantly associated with late leucopenia in patients with wild-type NUDT15 R139C (P = 0.006, median 413.0 vs 279.7 pmol/8 × 108 RBCs), while no significant association was found between 6TGN levels and leucopenia in patients with NUDT15 R139C variants (P = 0.26). Similarly, in the present study, the early concentrations of 6TGN exhibited no significant difference in TPMT/NUDT15 heterozygous patients with or without late leucopenia (P = 0.55), although it did in the entire sample and TPMT/NUDT15 wild-type patients with or without late leucopenia (P = 0.021, 0.018, respectively). This discrepancy may be because in the study performed by Kang et al[23], 6TGN concentrations were monitored regularly, and doses were adjusted accordingly so that 6TGN levels would be within the therapeutic range of 235-450 pmol/8 × 108 RBCs[24]. In our study, the doses were only adjusted based on genotypes before thiopurine administration.
Furthermore, our current study found that compared to 6TGN, early DNATG levels were more significantly correlated with thiopurine-induced late leucopenia (P = 4.9 × 10⁻¹³vs P = 0.021). The DNATG threshold of 319.43 fmol/μg DNA predicted late leucopenia in the entire sample with an AUC of 0.855 (sensitivity 83%, specificity 81%), and in the NUDT15/TPMT normal metabolizers, the predictability of a threshold of 315.72 fmol/μg DNA was much more impressive with an AUC of 0.902 (sensitivity 88%, specificity 85%). Notably, early DNATG levels were much more impressive in predicting discontinuation events due to recurrent leucopenia with an AUC of 0.864 (sensitivity 100%, specificity 67%) in the TPMT/NUDT15 wild-type population.
In recent years, proactive and reactive TDM strategies in IBD management have been under intense discussion. Reactive TDM in non- or partial responders with active IBD aims to guide treatment changes and routine proactive TDM in patients with quiescent disease aims to reach a target trough concentration during routine clinical care[20]. Many studies have suggested that proactive TDM can provide more clinical benefits than reactive TDM for anti-tumor necrosis factor biologics[25-28]. One Danish study reported that DNATG levels in neutrophils (P < 0.0001) and 6TGN in erythrocytes (P = 0.01) on methotrexate/6-MP maintenance therapy for childhood acute lymphoblastic leukemia, are predictors of neutrophil nadirs within two weeks following high-dose methotrexate infusion[29]. In the present study, it is heartening that early proactive monitoring of DNATG is of very high sensitivity (88%) and specificity (85%) to predict late leucopenia in NUDT15/TPMT wild-type subgroups that would not benefit from the NUDT15 genotype-guided dosing strategy.
In general, pretreatment determination of the NUDT15 genotype is necessary to identify Asian patients with IBD who are susceptible to thiopurine-induced leucopenia. Proactive DNATG therapeutic monitoring is very important, especially for many patients with wild-type NUDT15/TPMT, to avoid late risk.
There are several shortcomings in our study. First, this was a prospective observational study with relatively small sample sizes. In our study, once leucopenia occurred, patients discontinued the thiopurines, switched therapies, or followed a strategy of empiric dose adaptation due to the patient’s wishes and physician discretion. We did not fully determine the benefits of reactive DNATG-TDM-guided dose adaptation decisions with NUDT15-guided initial medication. Further randomized clinical trials are warranted to probe whether routine reactive DNATG monitoring, compared with empiric treatment changes, helps to reduce the incidence of drug withdrawal due to late leucopenia in IBD patients.
In this prospective study of CD patients receiving thiopurines under NUDT15 genotype-guided dosing strategy, we demonstrated that in addition to the NUDT15 genotype, early proactive monitoring of DNATG was highly sensitive in predicting thiopurine-induced late leucopenia. With the cutoff value of 319.43 fmol/μg DNA, late leucopenia cases could be predicted with 83% sensitivity and 81% specificity, and with the cutoff value of 357.05 fmol/μg DNA, the discontinuation of thiopurines could be predicted with 87% sensitivity and 77% specificity. DNATG levels were more significantly associated with late leucopenia than 6TGN levels, which was manifested especially in patients with NUDT15/TPMT wild-type, with a cutoff value of 315.72 fmol/μg DNA (sensitivity 88%, specificity 85%). This study provides empirical evidence indicating that early monitoring of DNATG levels, offers a predictive capability to discern patients susceptible to developing late leucopenia during the initial stages of thiopurine therapy, especially for many patients with wild-type NUDT15/TPMT.
Thiopurine-induced leucopenia significantly hinders the use of thiopurines. Genotype-guided dose optimization has significantly reduced the early leucopenia rate, but there are no definitive biomarkers for late risk prediction.
Can we identify definitive predictors for late risk as early as possible under current genotype-guided thiopurine dosing strategy?
To determine the predictive value of early monitoring of DNA-thioguanine (DNATG) or 6-thioguanine nucleotides (6TGN) for late leucopenia in patients with Crohn’s disease (CD).
Blood samples were collected within two months after thiopurine initiation for detection of metabolite concentrations. Late leucopenia was defined as a leukocyte count < 3.5 × 10⁹/L over two months.
In patients suffering late leucopenia, early DNATG levels were significantly higher than those who did not (P = 4.9 × 10⁻¹³). DNATG threshold of 319.43 fmol/μg DNA could predict late leucopenia in the entire sample collection with an area under the curve (AUC) of 0.855 (sensitivity 83%, specificity 81%), and in the nudix hydrolase 15 (NUDT15)/thiopurine methyltransferase (TPMT) normal metabolizers, the prediction performance of a threshold of 315.72 fmol/μg DNA was much more remarkable with an AUC of 0.902 (sensitivity 88%, specificity 85%). 6TGN had a relatively poor correlation with late leucopenia whether in the entire sample collection (P = 0.021) or NUDT15/TPMT normal or intermediate metabolizers (P = 0.018, P = 0.55, respectively).
Early DNATG concentration was significantly correlated with thiopurine-induced late leucopenia in CD patients, especially in NUDT15/TPMT normal metabolizers.
Proactive therapeutic drug monitoring to keep DNATG concentration below 320 fmol/μg DNA could be an effective strategy to prevent thiopurine-induced late leucopenia in CD patients.
Provenance and peer review: Unsolicited article; Externally peer reviewed.
Peer-review model: Single blind
Specialty type: Gastroenterology and hepatology
Country/Territory of origin: China
Peer-review report’s scientific quality classification
Grade A (Excellent): A
Grade B (Very good): 0
Grade C (Good): 0
Grade D (Fair): 0
Grade E (Poor): 0
P-Reviewer: Bayoumy AB, Netherlands S-Editor: Wang JJ L-Editor: A P-Editor: Chen YX
| 1. | Crouwel F, Buiter HJC, de Boer NK. The Thiopurine Tale: An Unexpected Journey. J Crohns Colitis. 2022;16:1177-1183. [RCA] [PubMed] [DOI] [Full Text] [Cited by in Crossref: 2] [Cited by in RCA: 2] [Article Influence: 0.7] [Reference Citation Analysis (0)] |
| 2. | Kakuta Y, Kinouchi Y, Shimosegawa T. Pharmacogenetics of thiopurines for inflammatory bowel disease in East Asia: prospects for clinical application of NUDT15 genotyping. J Gastroenterol. 2018;53:172-180. [RCA] [PubMed] [DOI] [Full Text] [Full Text (PDF)] [Cited by in Crossref: 46] [Cited by in RCA: 65] [Article Influence: 9.3] [Reference Citation Analysis (0)] |
| 3. | Zhu X, Chao K, Yang T, Wang XD, Guan S, Tang J, Xie W, Yu AM, Yang QF, Li M, Yang HS, Diao N, Hu PJ, Gao X, Huang M. DNA-Thioguanine Nucleotides as a Marker for Thiopurine Induced Late Leukopenia after Dose Optimizing by NUDT15 C415T in Chinese Patients with IBD. Clin Pharmacol Ther. 2022;112:1236-1242. [RCA] [PubMed] [DOI] [Full Text] [Cited by in RCA: 6] [Reference Citation Analysis (0)] |
| 4. | Zhu X, Wang XD, Chao K, Zhi M, Zheng H, Ruan HL, Xin S, Ding N, Hu PJ, Huang M, Gao X. NUDT15 polymorphisms are better than thiopurine S-methyltransferase as predictor of risk for thiopurine-induced leukopenia in Chinese patients with Crohn's disease. Aliment Pharmacol Ther. 2016;44:967-975. [RCA] [PubMed] [DOI] [Full Text] [Cited by in Crossref: 69] [Cited by in RCA: 88] [Article Influence: 9.8] [Reference Citation Analysis (0)] |
| 5. | Yang SK, Hong M, Baek J, Choi H, Zhao W, Jung Y, Haritunians T, Ye BD, Kim KJ, Park SH, Park SK, Yang DH, Dubinsky M, Lee I, McGovern DP, Liu J, Song K. A common missense variant in NUDT15 confers susceptibility to thiopurine-induced leukopenia. Nat Genet. 2014;46:1017-1020. [RCA] [PubMed] [DOI] [Full Text] [Cited by in Crossref: 412] [Cited by in RCA: 422] [Article Influence: 38.4] [Reference Citation Analysis (0)] |
| 6. | Gisbert JP, Gomollón F. Thiopurine-induced myelotoxicity in patients with inflammatory bowel disease: a review. Am J Gastroenterol. 2008;103:1783-1800. [RCA] [PubMed] [DOI] [Full Text] [Cited by in Crossref: 173] [Cited by in RCA: 186] [Article Influence: 10.9] [Reference Citation Analysis (0)] |
| 7. | Lewis JD, Abramson O, Pascua M, Liu L, Asakura LM, Velayos FS, Hutfless SM, Alison JE, Herrinton LJ. Timing of myelosuppression during thiopurine therapy for inflammatory bowel disease: implications for monitoring recommendations. Clin Gastroenterol Hepatol. 2009;7:1195-201; quiz 1141. [RCA] [PubMed] [DOI] [Full Text] [Full Text (PDF)] [Cited by in Crossref: 50] [Cited by in RCA: 50] [Article Influence: 3.1] [Reference Citation Analysis (0)] |
| 8. | Asada A, Nishida A, Shioya M, Imaeda H, Inatomi O, Bamba S, Kito K, Sugimoto M, Andoh A. NUDT15 R139C-related thiopurine leukocytopenia is mediated by 6-thioguanine nucleotide-independent mechanism in Japanese patients with inflammatory bowel disease. J Gastroenterol. 2016;51:22-29. [RCA] [PubMed] [DOI] [Full Text] [Cited by in Crossref: 82] [Cited by in RCA: 82] [Article Influence: 9.1] [Reference Citation Analysis (0)] |
| 9. | Chao K, Huang Y, Zhu X, Tang J, Wang X, Lin L, Guo H, Zhang C, Li M, Yang Q, Huang J, Ye L, Hu P, Huang M, Cao Q, Gao X. Randomised clinical trial: dose optimising strategy by NUDT15 genotyping reduces leucopenia during thiopurine treatment of Crohn's disease. Aliment Pharmacol Ther. 2021;54:1124-1133. [RCA] [PubMed] [DOI] [Full Text] [Cited by in Crossref: 7] [Cited by in RCA: 19] [Article Influence: 4.8] [Reference Citation Analysis (0)] |
| 10. | Kakuta Y, Naito T, Onodera M, Kuroha M, Kimura T, Shiga H, Endo K, Negoro K, Kinouchi Y, Shimosegawa T. NUDT15 R139C causes thiopurine-induced early severe hair loss and leukopenia in Japanese patients with IBD. Pharmacogenomics J. 2016;16:280-285. [RCA] [PubMed] [DOI] [Full Text] [Cited by in Crossref: 107] [Cited by in RCA: 126] [Article Influence: 12.6] [Reference Citation Analysis (0)] |
| 11. | Dubinsky MC, Lamothe S, Yang HY, Targan SR, Sinnett D, Théorêt Y, Seidman EG. Pharmacogenomics and metabolite measurement for 6-mercaptopurine therapy in inflammatory bowel disease. Gastroenterology. 2000;118:705-713. [RCA] [PubMed] [DOI] [Full Text] [Cited by in Crossref: 771] [Cited by in RCA: 722] [Article Influence: 28.9] [Reference Citation Analysis (0)] |
| 12. | Osterman MT, Kundu R, Lichtenstein GR, Lewis JD. Association of 6-thioguanine nucleotide levels and inflammatory bowel disease activity: a meta-analysis. Gastroenterology. 2006;130:1047-1053. [RCA] [PubMed] [DOI] [Full Text] [Cited by in Crossref: 307] [Cited by in RCA: 287] [Article Influence: 15.1] [Reference Citation Analysis (0)] |
| 13. | Ooi CY, Bohane TD, Lee D, Naidoo D, Day AS. Thiopurine metabolite monitoring in paediatric inflammatory bowel disease. Aliment Pharmacol Ther. 2007;25:941-947. [RCA] [PubMed] [DOI] [Full Text] [Cited by in Crossref: 47] [Cited by in RCA: 47] [Article Influence: 2.6] [Reference Citation Analysis (0)] |
| 14. | Odahara S, Uchiyama K, Kubota T, Ito Z, Takami S, Kobayashi H, Saito K, Koido S, Ohkusa T. A Prospective Study Evaluating Metabolic Capacity of Thiopurine and Associated Adverse Reactions in Japanese Patients with Inflammatory Bowel Disease (IBD). PLoS One. 2015;10:e0137798. [RCA] [PubMed] [DOI] [Full Text] [Full Text (PDF)] [Cited by in Crossref: 19] [Cited by in RCA: 19] [Article Influence: 1.9] [Reference Citation Analysis (0)] |
| 15. | Zhu X, Chao K, Li M, Xie W, Zheng H, Zhang JX, Hu PJ, Huang M, Gao X, Wang XD. Nucleoside diphosphate-linked moiety X-type motif 15 R139C genotypes impact 6-thioguanine nucleotide cut-off levels to predict thiopurine-induced leukopenia in Crohn's disease patients. World J Gastroenterol. 2019;25:5850-5861. [RCA] [PubMed] [DOI] [Full Text] [Full Text (PDF)] [Cited by in CrossRef: 5] [Cited by in RCA: 6] [Article Influence: 1.0] [Reference Citation Analysis (0)] |
| 16. | Toyonaga T, Kobayashi T, Kuronuma S, Ueno A, Kiyohara H, Okabayashi S, Takeuchi O, Redfern CPF, Terai H, Ozaki R, Sagami S, Nakano M, Coulthard SA, Tanaka Y, Hibi T. Increased DNA-incorporated thiopurine metabolite as a possible mechanism for leukocytopenia through cell apoptosis in inflammatory bowel disease patients with NUDT15 mutation. J Gastroenterol. 2021;56:999-1007. [RCA] [PubMed] [DOI] [Full Text] [Cited by in Crossref: 2] [Cited by in RCA: 9] [Article Influence: 2.3] [Reference Citation Analysis (0)] |
| 17. | Duley JA, Florin TH. Thiopurine therapies: problems, complexities, and progress with monitoring thioguanine nucleotides. Ther Drug Monit. 2005;27:647-654. [RCA] [PubMed] [DOI] [Full Text] [Cited by in Crossref: 74] [Cited by in RCA: 83] [Article Influence: 4.4] [Reference Citation Analysis (0)] |
| 18. | Chao K, Wang X, Cao Q, Qian J, Wu K, Zhu X, Yang H, Liang J, Lin L, Huang Z, Zhang Y, Huang Y, Sun Y, Xue X, Huang M, Hu P, Lan P, Gao X. Combined Detection of NUDT15 Variants Could Highly Predict Thiopurine-induced Leukopenia in Chinese Patients with Inflammatory Bowel Disease: A Multicenter Analysis. Inflamm Bowel Dis. 2017;23:1592-1599. [RCA] [PubMed] [DOI] [Full Text] [Cited by in Crossref: 37] [Cited by in RCA: 53] [Article Influence: 6.6] [Reference Citation Analysis (0)] |
| 19. | Relling MV, Schwab M, Whirl-Carrillo M, Suarez-Kurtz G, Pui CH, Stein CM, Moyer AM, Evans WE, Klein TE, Antillon-Klussmann FG, Caudle KE, Kato M, Yeoh AEJ, Schmiegelow K, Yang JJ. Clinical Pharmacogenetics Implementation Consortium Guideline for Thiopurine Dosing Based on TPMT and NUDT15 Genotypes: 2018 Update. Clin Pharmacol Ther. 2019;105:1095-1105. [RCA] [PubMed] [DOI] [Full Text] [Cited by in Crossref: 280] [Cited by in RCA: 435] [Article Influence: 72.5] [Reference Citation Analysis (0)] |
| 20. | Vande Casteele N, Herfarth H, Katz J, Falck-Ytter Y, Singh S. American Gastroenterological Association Institute Technical Review on the Role of Therapeutic Drug Monitoring in the Management of Inflammatory Bowel Diseases. Gastroenterology. 2017;153:835-857.e6. [RCA] [PubMed] [DOI] [Full Text] [Cited by in Crossref: 196] [Cited by in RCA: 229] [Article Influence: 28.6] [Reference Citation Analysis (0)] |
| 21. | Feng R, Guo J, Zhang SH, Qiu Y, Chen BL, He Y, Zeng ZR, Ben-Horin S, Chen MH, Mao R. Low 6-thioguanine nucleotide level: Effective in maintaining remission in Chinese patients with Crohn's disease. J Gastroenterol Hepatol. 2019;34:679-685. [RCA] [PubMed] [DOI] [Full Text] [Cited by in Crossref: 4] [Cited by in RCA: 6] [Article Influence: 1.0] [Reference Citation Analysis (0)] |
| 22. | Cuffari C, Seidman EG, Latour S, Théorêt Y. Quantitation of 6-thioguanine in peripheral blood leukocyte DNA in Crohn's disease patients on maintenance 6-mercaptopurine therapy. Can J Physiol Pharmacol. 1996;74:580-585. [PubMed] |
| 23. | Kang B, Kim TJ, Choi J, Baek SY, Ahn S, Choi R, Lee SY, Choe YH. Adjustment of azathioprine dose should be based on a lower 6-TGN target level to avoid leucopenia in NUDT15 intermediate metabolisers. Aliment Pharmacol Ther. 2020;52:459-470. [RCA] [PubMed] [DOI] [Full Text] [Cited by in Crossref: 18] [Cited by in RCA: 9] [Article Influence: 1.8] [Reference Citation Analysis (0)] |
| 24. | Dervieux T, Meyer G, Barham R, Matsutani M, Barry M, Boulieu R, Neri B, Seidman E. Liquid chromatography-tandem mass spectrometry analysis of erythrocyte thiopurine nucleotides and effect of thiopurine methyltransferase gene variants on these metabolites in patients receiving azathioprine/6-mercaptopurine therapy. Clin Chem. 2005;51:2074-2084. [RCA] [PubMed] [DOI] [Full Text] [Cited by in Crossref: 87] [Cited by in RCA: 89] [Article Influence: 4.5] [Reference Citation Analysis (0)] |
| 25. | Lega S, Phan BL, Rosenthal CJ, Gordon J, Haddad N, Pittman N, Benkov KJ, Dubinsky MC. Proactively Optimized Infliximab Monotherapy Is as Effective as Combination Therapy in IBD. Inflamm Bowel Dis. 2019;25:134-141. [RCA] [PubMed] [DOI] [Full Text] [Cited by in Crossref: 56] [Cited by in RCA: 74] [Article Influence: 12.3] [Reference Citation Analysis (0)] |
| 26. | Papamichael K, Chachu KA, Vajravelu RK, Vaughn BP, Ni J, Osterman MT, Cheifetz AS. Improved Long-term Outcomes of Patients With Inflammatory Bowel Disease Receiving Proactive Compared With Reactive Monitoring of Serum Concentrations of Infliximab. Clin Gastroenterol Hepatol. 2017;15:1580-1588.e3. [RCA] [PubMed] [DOI] [Full Text] [Cited by in Crossref: 184] [Cited by in RCA: 189] [Article Influence: 23.6] [Reference Citation Analysis (0)] |
| 27. | Papamichael K, Vajravelu RK, Vaughn BP, Osterman MT, Cheifetz AS. Proactive Infliximab Monitoring Following Reactive Testing is Associated With Better Clinical Outcomes Than Reactive Testing Alone in Patients With Inflammatory Bowel Disease. J Crohns Colitis. 2018;12:804-810. [RCA] [PubMed] [DOI] [Full Text] [Cited by in Crossref: 102] [Cited by in RCA: 92] [Article Influence: 13.1] [Reference Citation Analysis (0)] |
| 28. | Löwenberg M, Volkers A, van Gennep S, Mookhoek A, Montazeri N, Clasquin E, Duijvestein M, van Bodegraven A, Rietdijk S, Jansen J, van Asseldonk D, van der Zanden E, Dijkgraaf M, West R, de Boer N, D'Haens G. Mercaptopurine for the Treatment of Ulcerative Colitis: A Randomized Placebo-Controlled Trial. J Crohns Colitis. 2023;17:1055-1065. [RCA] [PubMed] [DOI] [Full Text] [Cited by in RCA: 16] [Reference Citation Analysis (0)] |
| 29. | Vang SI, Schmiegelow K, Frandsen T, Rosthøj S, Nersting J. Mercaptopurine metabolite levels are predictors of bone marrow toxicity following high-dose methotrexate therapy of childhood acute lymphoblastic leukaemia. Cancer Chemother Pharmacol. 2015;75:1089-1093. [RCA] [PubMed] [DOI] [Full Text] [Cited by in Crossref: 12] [Cited by in RCA: 13] [Article Influence: 1.3] [Reference Citation Analysis (0)] |


