


Published online Mar 21, 2024. doi: 10.3748/wjg.v30.i11.1609
Peer-review started: December 13, 2023
First decision: December 27, 2023
Revised: January 9, 2024
Accepted: March 4, 2024
Article in press: March 4, 2024
Published online: March 21, 2024
Processing time: 99 Days and 1.3 Hours
Liver cancer is one of the deadliest malignant tumors worldwide. Immunotherapy has provided hope to patients with advanced liver cancer, but only a small fraction of patients benefit from this treatment due to individual differences. Identifying immune-related gene signatures in liver cancer patients not only aids physicians in cancer diagnosis but also offers personalized treatment strategies, thereby improving patient survival rates. Although several methods have been developed to predict the prognosis and immunotherapeutic efficacy in patients with liver cancer, the impact of cell-cell interactions in the tumor microenvironment has not been adequately considered.
To identify immune-related gene signals for predicting liver cancer prognosis and immunotherapy efficacy.
Cell grouping and cell-cell communication analysis were performed on single-cell RNA-sequencing data to identify highly active cell groups in immune-related pathways. Highly active immune cells were identified by intersecting the highly active cell groups with B cells and T cells. The significantly differentially expressed genes between highly active immune cells and other cells were subsequently selected as features, and a least absolute shrinkage and selection operator (LASSO) regression model was constructed to screen for diagnostic-related features. Fourteen genes that were selected more than 5 times in 10 LASSO regression experiments were included in a multivariable Cox regression model. Finally, 3 genes (stathmin 1, cofilin 1, and C-C chemokine ligand 5) significantly associated with survival were identified and used to construct an immune-related gene signature.
The immune-related gene signature composed of stathmin 1, cofilin 1, and C-C chemokine ligand 5 was identified through cell-cell communication. The effectiveness of the identified gene signature was validated based on experimental results of predictive immunotherapy response, tumor mutation burden analysis, immune cell infiltration analysis, survival analysis, and expression analysis.
The findings suggest that the identified gene signature may contribute to a deeper understanding of the activity patterns of immune cells in the liver tumor microenvironment, providing insights for personalized treatment strategies.
Core Tip: In this study, CellChat was employed to infer cell-cell communication, thereby selecting highly active cell groups in immune-related pathways on single-cell RNA-sequencing data. Highly active immune cells were identified by intersecting these groups with B and T cells. Subsequently, significantly differentially expressed genes between highly active immune cells and the remaining cells were incorporated into the Lasso regression model. Ultimately, incorporating genes selected more than 5 times in 10 Lasso regression experiments into a multivariable Cox regression model, 3 genes (stathmin 1, cofilin 1, and C-C chemokine ligand 5) significantly associated with survival were identified to construct a gene signature.
- Citation: Li JT, Zhang HM, Wang W, Wei DQ. Identification of an immune-related gene signature for predicting prognosis and immunotherapy efficacy in liver cancer via cell-cell communication. World J Gastroenterol 2024; 30(11): 1609-1620
- URL: https://www.wjgnet.com/1007-9327/full/v30/i11/1609.htm
- DOI: https://dx.doi.org/10.3748/wjg.v30.i11.1609
Liver cancer, a malignant tumor with consistently high global incidence and mortality rates, has long been a focal point of medical research and clinical intervention[1,2]. In particular, within the rapidly advancing field of immunotherapy, immune checkpoint blockade (ICB) treatment has emerged as an innovative therapeutic approach, offering renewed hope for patients with liver cancer[3]. This strategy has achieved significant clinical efficacy by preventing tumor cells from suppressing the immune system and stimulating the body’s own immune response[3-5]. However, only a small fraction of liver cancer patients benefit from this treatment, and the molecular basis underlying the control of immune responses and evasion has not been determined[6,7]. To better guide treatment strategies and predict patient prognosis, it is imperative to explore into the molecular mechanisms and immune characteristics of liver cancer.
The success of immunotherapy in liver cancer hinges on a comprehensive understanding of the tumor immune microenvironment, necessitating the exploration of high-throughput technologies to unravel intricate molecular interactions[8-10]. Using bulk RNA sequencing (RNA-seq) data, Tang et al[11] first screened gene modules partitioned by weighted gene co-expression network analysis that were most relevant to tumor immune phenotype genes. Subse
However, cellular crosstalk in the tumor microenvironment should also be considered, as it plays a crucial role in shaping the immune landscape of liver cancer[8,16,17]. The construction of a cell-cell communication network facilitates the identification of key participants in tumor-immune crosstalk. In this context, CellChat, a computational framework for inferring cell-cell communication, provides a powerful means to identify the communication networks within the liver cancer microenvironment[18,19]. In CellChat, the dynamic process of intercellular communication is simulated using the law of mass action, and the inferred ligand-receptor pairs are systematically classified into functionally relevant signaling pathways[19]. The activity level of a cell group in immune-related pathways can be quantified by counting the number of times the cell group is used as a source and target.
In this study, we aimed to leverage the power of bulk RNA-seq and scRNA-seq data integration to identify a comprehensive immune-related gene signature in liver cancer. By focusing on the cell-cell communication network using the CellChat framework, we sought to unravel the intricate interplay among diverse cell groups within the liver cancer microenvironment. The identified gene signature holds promise for predicting liver cancer prognosis and understanding potential immunotherapeutic responses, providing valuable insights for personalized treatment strategies.
The liver cancer bulk RNA-seq data, which included 50 normal and 369 tumor samples, 368 of which included total survival time and status, were downloaded from The Cancer Genome Atlas (TCGA) database. The liver cancer scRNA-seq data were downloaded from the Gene Expression Omnibus database with the accession number GSE125449 and included 8853 cells and 7 cell types[20]: Cancer-associated fibroblast, tumor-associated macrophage, malignant cell, TEC, cells with an unknown entity but that express hepatic progenitor cell markers, T cell, and B cell. For bulk RNA-seq data, a logarithmic transformation with a base of 2 was first performed on the original count data. The expression values of genes with the same name were subsequently averaged. The R package Seurat was used for preprocessing the scRNA-seq data. Specifically, the NormalizeData and FindVariableFeatures functions were used to normalize the data and select 2000 highly variable genes, respectively. Standardization and principal component analysis were performed using the ScaleData and RunPCA functions, respectively. The first ten principal components were used to construct a shared nearest-graph through the FindNeighbors function. Two-dimensional cell visualization was achieved via the RunUMAP function.
The Louvain algorithm, employed for cell grouping, was implemented through the function FindClusters in the R package Seurat, with the resolution parameter set to 0.5. Based on these cell grouping results, the cell-cell interaction network was inferred through CellChat. Specifically, the entire human ligand-receptor interaction database CellChatDB was chosen as the foundation for this article. CellChat utilizes the law of mass action to simulate ligand-receptor-mediated signal interactions, which can not only infer intercellular communication but also further classify significant ligand-receptor pairs into functionally related signaling pathways. Immune-related pathways were identified by searching for pathway functions on the official Kyoto Encyclopedia of Genes and Genomes website (https://www.kegg.jp). The number of times each cell group served as a source and target in immune-related pathways was counted, and the top 20% of cell groups were considered highly active. Highly active immune-related cells were identified by the intersection of the obtained highly active cell groups with T and B cells.
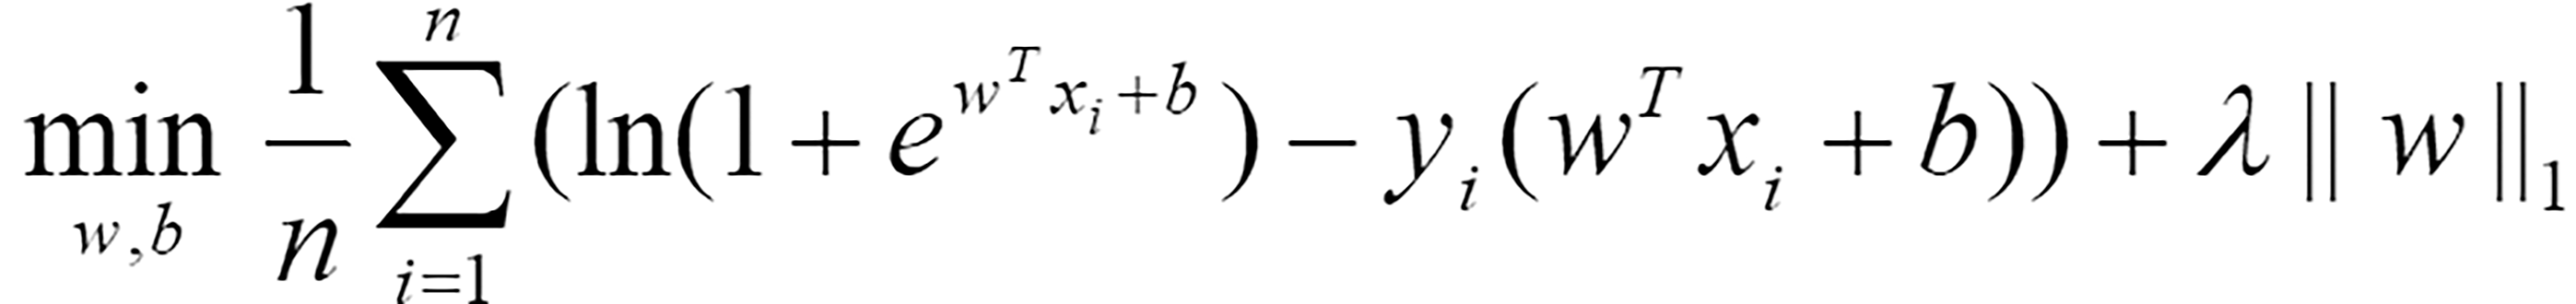
Differential expression analysis was performed through the R package limma[21]. The significantly differentially expressed genes between highly active immune cells and other cells were selected using the criteria |log(fold change)|> 1 and P < 0.05. The genes shared between these genes and the bulk RNA-seq data were included in the following LASSO regression model for selecting diagnostic-related features:
 (1)
(1)
Where n represents the number of samples, w = (w1,w2,… wm)T is the coefficient vector corresponding to m shared genes, xi = (xi1,xi2,…,xim)T is the expression level of m genes in the i-th sample, b is the offset, λ represents the regularization parameter determined by 10-fold cross validation, and yi represents the label corresponding to the i-th sample. If a sample was considered to be a tumor, this value was 1; otherwise, it was 0. Eighty percent of the samples were randomly selected as the training set for LASSO regression, while the remaining 20% of the samples were used as the test set to evaluate the effectiveness of the selected diagnostic-related features. The coefficient vector w and threshold b in Equation (1) were solved through the R package glmnet[22]. To avoid randomness in the experimental results, the dataset was divided 10 times by setting random seeds from 1 to 10. Genes that were selected more than 5 times were considered diagnostic-related features.
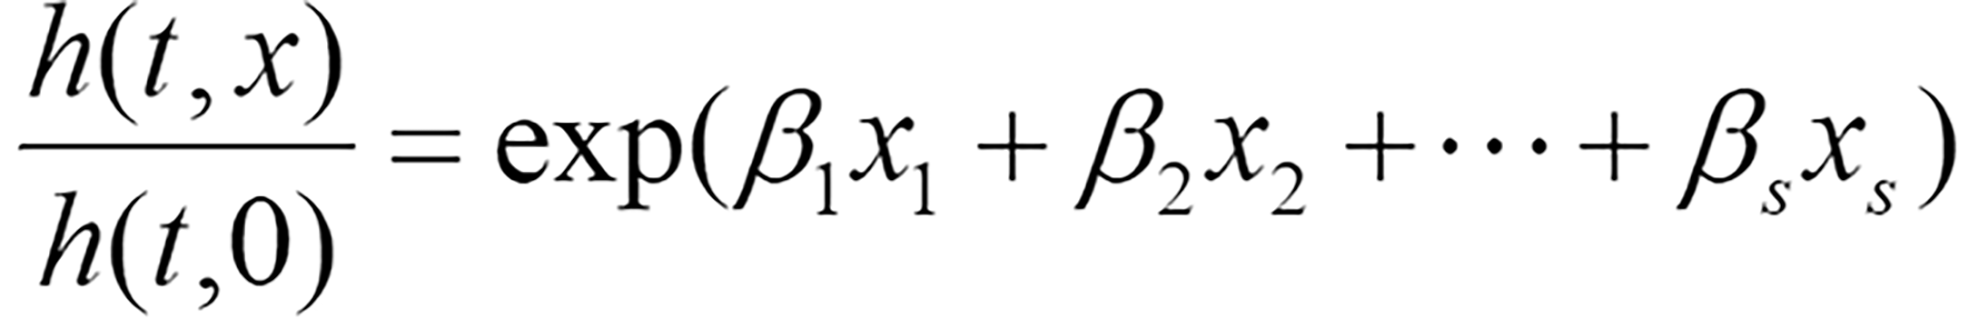
To comprehensively evaluate the impact of risk factors on patient survival, diagnostic-related features were included in the following multivariable Cox regression model:
 (2)
(2)
Where h(t,x) represents the risk function at time t, h(t,0) denotes the baseline risk function, and (β1,β2,…,βs)T is the regression coefficient vector corresponding to s diagnostic-related features, which is solved through the R package survival.
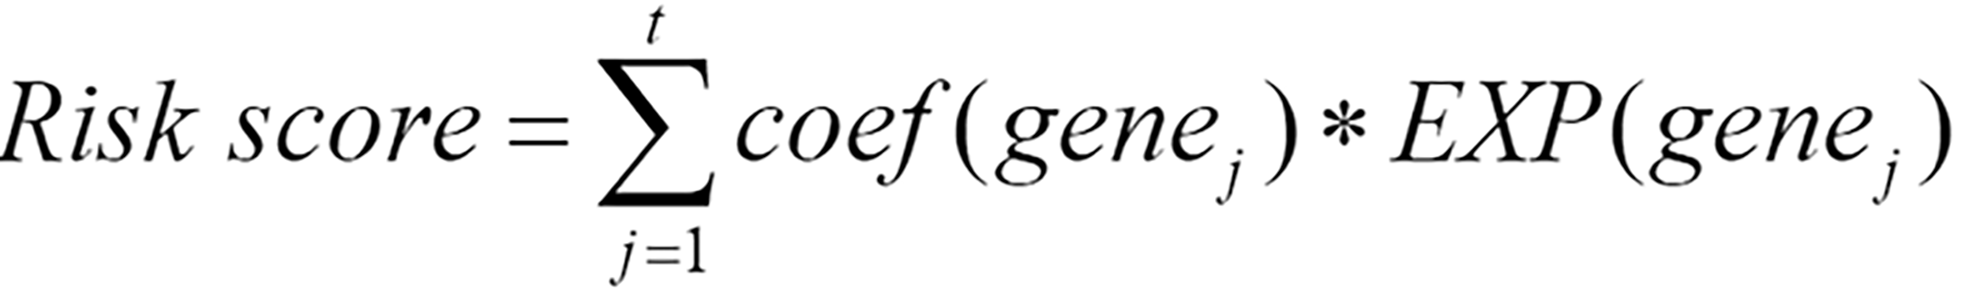
After performing multivariable Cox regression analysis, genes significantly associated with survival were selected according to a criterion of p < 0.05 to identify the following gene signature:
 (3)
(3)
Where genej represents the j-th gene among the t genes significantly associated with survival, coef(genej) represents the coefficient of genej when only genes significantly related to survival were included in the multivariable Cox regression, and EXP(genej) represents the preprocessed expression values of genej. When coef(genej) is greater than 0, the expression level of genej increases, and the patient’s survival risk increases; when the coefficient is less than 0, the expression level of this gene increases, and the survival risk decreases.
The preprocessed scRNA-seq data were divided into 15 cell groups using the Louvain algorithm. The UMAP visualization of 15 cell groups and 7 cell types was presented in Figure 1A and B, respectively. Subsequently, the communication network between cell groups was inferred through the CellChat, and 16 immune-related pathways were identified. The cell-cell communication within signal pathways inferred integrin beta2 and major histocompatibility class I were demonstrated as examples in Figure 2A and B, respectively. In Figure 2A, cell group 12 serves as the source targeting the other six cell groups, while in Figure 2B, it serves as the target for all cell groups. The number of times each cell group served as a source and target in immune-related pathways was statistically displayed in Table 1. The top 20% of the cell groups in descending order were identified as highly active cell groups, i.e., cell groups 12, 15, and 6. A total of 240 highly active immune cells were identified by intersecting 1009 cells from cell groups 6, 12, and 15 with 3785 T cells and B cells, as shown in Figure 3. These cells are involved in multiple immune-related signaling pathways and play a critical role in regulating immune responses.


| Number of times | |||||||||||||||
| Cell group | 12 | 15 | 6 | 2 | 10 | 9 | 14 | 11 | 8 | 1 | 7 | 13 | 3 | 5 | 4 |
| Frequency | 195 | 195 | 100 | 84 | 76 | 72 | 65 | 50 | 48 | 44 | 41 | 35 | 26 | 22 | 9 |
Differential expression analysis was also conducted between 240 highly active immune cells and the remaining 8613 cells. Then, 50 significantly differentially expressed genes were identified, and 46 genes shared between them and bulk RNA-seq data were included in the LASSO regression model. Of these, 14 genes were identified as diagnostic-related genes because they were selected more than 5 times in 10 experiments. The average diagnostic accuracy on the test set over 10 experiments was 96.55%, indicating that the selected features were effective. Subsequently, multivariable Cox regression analysis was conducted, and 3 genes [stathmin 1 (STMN1), C-C chemokine ligand 5 (CCL5), and cofilin 1 (CFL1)] out of 14 were selected to construct a gene signature due to their significant correlation with patient survival. The coefficients and P values of the 14 diagnostic-related genes were listed in Table 2. Ultimately, the following gene signature was generated by incorporating only STMN1, CCL5, and CFL1 into the multivariable Cox regression analysis model:
 .
.
Patients with higher risk scores were considered to have worse prognoses. The samples were divided into high-risk and low-risk groups based on the median of this risk score.
| Gene | Coefficient | P value |
| NUSAP1 | -0.108515073 | 0.219706452 |
| STMN1 | 0.367886836 | 0.006598885 |
| UBE2C | -0.038808062 | 0.692223045 |
| CKS1B | 0.019614361 | 0.885123337 |
| HMGB1 | -0.036928764 | 0.841313659 |
| CCL5 | -0.351813314 | 0.000909645 |
| DUT | -0.200404711 | 0.201189097 |
| PFN1 | 0.156824573 | 0.389822262 |
| ITM2A | -0.021567354 | 0.742760958 |
| CCL4 | 0.146793282 | 0.182629575 |
| CFL1 | 0.688652826 | 0.001683044 |
| IL32 | -0.054741614 | 0.491028415 |
| MT2A | 0.033545401 | 0.525093809 |
| IFITM3 | -0.053229362 | 0.706251853 |
To assess the difference in survival between the high-risk and low-risk groups, Kaplan-Meier survival analysis was conducted, and the log-rank test was employed for statistical analysis. Figure 4 illustrated the significant difference between the high-risk and low-risk groups (P < 0.0001), with the median survival time of patients in the low-risk group being approximately three times longer than that in the high-risk group. These results indicated that the identified gene signature could significantly distinguish between patients with favorable and poor prognoses.

Furthermore, expression analysis of the individual genes constituting the gene signature was conducted in the high-risk and low-risk groups, as well as in tumor and normal samples; the results were presented in Figure 5. A t test was performed to assess whether there were significant differences between two groups of samples, and the obtained P values were displayed in all boxplots. The STMN1 and CFL1 genes had significantly greater expression in the high-risk group and tumor samples, while the CCL5 gene had greater expression in the low-risk group and normal samples. Meta-analysis revealed that in liver cancer, STMN1 and CFL1 are considered oncogenes, and their upregulation is closely associated with poor prognosis[23,24]. The CCL5-high subtype is significantly correlated with immune cells and markedly improved overall survival[25]. This finding is consistent with the findings in Figure 5, providing additional confirmation for the reliability of the identified gene signature.

The relative infiltration of immune cells in the high-risk and low-risk groups was investigated using the single-sample gene set enrichment analysis algorithm[26]. This algorithm was implemented through the function GSVA in the R package GSVA. A reference gene set comprising 28 reported immune cell types was utilized for the analysis[27]. Figure 6 showed that out of the 28 immune cell types, 20 exhibited significant correlations with the risk groups. The Kruskal-Wallis test was used to evaluate significant differences between two groups. In particular, the infiltration levels in cell types activated B cell, effector memory CD8 T cell, eosinophil, immature B cell, mast cell, and type 1 T helper cell were significantly greater in the low-risk group than in the high-risk group. These results indicated that an immune-related gene signature identified through cell-cell communication plays a crucial role in stratifying the risk of liver cancer.

Tumor mutation burden (TMB) was approved by the United States Food and Drug Administration in 2020 as a biomarker for predicting the response to immunotherapy[28]. To assess the relationship between the identified gene signature and the immune response, the TMB of the samples was computed using mutation data obtained from liver cancer patients downloaded from the TCGA database. Figure 7A illustrated the TMB distribution across all samples. Figure 7B and C showed the mutation landscapes of the high-risk and the low-risk groups, respectively. Among the top 10 mutated genes, 6 were common between the high-risk group and the low-risk group, but each gene had a different mutation type. Furthermore, the TMB in the high-risk and low-risk groups identified by the gene signature proposed in this article, as well as the groups identified by the gene signatures proposed by Tang et al[11] and Wang et al[12], were separately analyzed, as shown in Figure 7D-F. However, only the samples from the high-risk and low-risk groups defined by the proposed gene signature showed a significant difference in TMB (P = 0.01106). These results strongly demonstrated that the identified gene signature could predict the efficacy of immunotherapy.

The TIDE algorithm, which simulates both the immune evasion mechanisms of immune function suppression and immune cell exclusion, more accurately predicts patient prognosis than individual biomarkers alone[29]. Currently, this algorithm has been widely applied for predicting patient responses to ICB therapy. In this article, the TIDE algorithm was used to analyze the response of liver cancer patients to immunotherapy using an online tool (http://tide.dfci.harvard.edu/). A higher TIDE score indicates that the patient is more prone to experiencing immune escape and is likely to exhibit poor efficacy in response to immunotherapy. The Pearson correlation coefficient between TIDE scores and Risks cores was calculated, and the significant correlation trends between the two were illustrated in Figure 8A.

Furthermore, the TIDE scores corresponding to the high-risk and low-risk groups identified by the gene signature in this article, as well as the groups identified by the gene signatures reported by Tang et al[11] and Wang et al[12], are depicted in Figure 8B-D. The TIDE scores exhibited significant differences across all high-risk and low-risk groups, with the minimum P value observed among groups stratified by the proposed gene signature (P = 3.762e-10). Moreover, compared to those of the other two methods, the gene signature identified in this article requires the fewest genes. A significant correlation was observed between TIDE score and Risk scores, and a distinction was made between the high-risk and low-risk groups, suggesting that the identified gene signature could serve as a valuable tool for predicting the efficacy of immunotherapy.
Our research demonstrated that utilizing cell-cell communication information to identify immune-related gene signature outperformed two other methods in terms of predictive performance. However, it’s worth noting that we focused on cell-cell communication at the cell group level rather than at the level of individual cells. Investigating the interactions between cells at single-cell resolution and their impact on predicting patient prognosis and immunotherapeutic efficacy is a direction for our future research.
In summary, our integrated analysis of bulk and scRNA-seq data, coupled with the exploration of the cell-cell communication network, has identified a comprehensive immune-related gene signature with clinical and therapeutic implications. The identified gene signature not only demonstrates potential as a prognostic tool for liver cancer but also provides invaluable insights into the dynamics of immune responses within the tumor microenvironment.
Immunotherapy has provided hope to patients with advanced liver cancer, but only a small fraction of patients benefit from this treatment due to individual differences. Although several methods have been developed to predict the prognosis and immunotherapeutic efficacy in patients with liver cancer, the impact of cell-cell interactions in the tumor microenvironment has not been adequately considered.
Recent research has demonstrated the crucial role of cell-cell interactions in shaping the immune landscape of liver cancer.
This study aims to identify immune-related gene signatures through cell-cell interactions to predict prognosis and immunotherapeutic efficacy in liver cancer.
In this study, CellChat was employed to infer cell-cell communication, thereby selecting highly active cell groups in immune-related pathways on single-cell RNA-sequencing (scRNA-seq) data. Highly active immune cells were identified by intersecting these groups with B and T cells. Subsequently, significantly differentially expressed genes between highly active immune cells and the remaining cells were incorporated into the Lasso regression model. Ultimately, incorporating genes selected more than 5 times in 10 Lasso regression experiments into a multivariable Cox regression model, 3 genes (stathmin 1, cofilin 1, and C-C chemokine ligand 5) significantly associated with survival were identified to construct a gene signature.
The immune-related gene signature composed of stathmin 1, cofilin 1, and C-C chemokine ligand 5 was identified through cell-cell communication. The identified gene signature has been validated to be superior to the other two methods through immunotherapy response prediction, tumor mutation burden analysis, and immune cell infiltration analysis, enabling better prediction of prognosis and immune therapy efficacy in liver cancer.
This study suggest that the identified gene signature may contribute to a deeper understanding of the activity patterns of immune cells in the liver tumor microenvironment, providing insights for personalized treatment strategies.
This article utilized cell-cell communication information and machine learning method, combined with Cox regression, to comprehensively analyze bulk and scRNA-seq data, identifying clinically and therapeutically relevant immune-related gene signature.
Provenance and peer review: Invited article; Externally peer reviewed.
Peer-review model: Single blind
Specialty type: Gastroenterology and hepatology
Country/Territory of origin: China
Peer-review report’s scientific quality classification
Grade A (Excellent): A
Grade B (Very good): 0
Grade C (Good): 0
Grade D (Fair): 0
Grade E (Poor): 0
P-Reviewer: Rodrigues AT, Brazil S-Editor: Wang JJ L-Editor: A P-Editor: Cai YX
| 1. | Sung H, Ferlay J, Siegel RL, Laversanne M, Soerjomataram I, Jemal A, Bray F. Global Cancer Statistics 2020: GLOBOCAN Estimates of Incidence and Mortality Worldwide for 36 Cancers in 185 Countries. CA Cancer J Clin. 2021;71:209-249. [RCA] [PubMed] [DOI] [Full Text] [Cited by in Crossref: 75126] [Cited by in RCA: 64627] [Article Influence: 16156.8] [Reference Citation Analysis (176)] |
| 2. | Bakrania A, Joshi N, Zhao X, Zheng G, Bhat M. Artificial intelligence in liver cancers: Decoding the impact of machine learning models in clinical diagnosis of primary liver cancers and liver cancer metastases. Pharmacol Res. 2023;189:106706. [RCA] [PubMed] [DOI] [Full Text] [Cited by in RCA: 23] [Reference Citation Analysis (0)] |
| 3. | Villarruel-Melquiades F, Mendoza-Garrido ME, García-Cuellar CM, Sánchez-Pérez Y, Pérez-Carreón JI, Camacho J. Current and novel approaches in the pharmacological treatment of hepatocellular carcinoma. World J Gastroenterol. 2023;29:2571-2599. [RCA] [PubMed] [DOI] [Full Text] [Full Text (PDF)] [Cited by in CrossRef: 8] [Cited by in RCA: 9] [Article Influence: 4.5] [Reference Citation Analysis (2)] |
| 4. | Fritz JM, Lenardo MJ. Development of immune checkpoint therapy for cancer. J Exp Med. 2019;216:1244-1254. [RCA] [PubMed] [DOI] [Full Text] [Full Text (PDF)] [Cited by in Crossref: 90] [Cited by in RCA: 132] [Article Influence: 22.0] [Reference Citation Analysis (0)] |
| 5. | Kalbasi A, Ribas A. Tumour-intrinsic resistance to immune checkpoint blockade. Nat Rev Immunol. 2020;20:25-39. [RCA] [PubMed] [DOI] [Full Text] [Cited by in Crossref: 443] [Cited by in RCA: 1017] [Article Influence: 169.5] [Reference Citation Analysis (0)] |
| 6. | Shen W, Chen Y, Lei P, Sheldon M, Sun Y, Yao F, Ma L. Immunotherapeutic Approaches for Treating Hepatocellular Carcinoma. Cancers (Basel). 2022;14. [RCA] [PubMed] [DOI] [Full Text] [Full Text (PDF)] [Cited by in Crossref: 16] [Cited by in RCA: 17] [Article Influence: 5.7] [Reference Citation Analysis (0)] |
| 7. | Llovet JM, Castet F, Heikenwalder M, Maini MK, Mazzaferro V, Pinato DJ, Pikarsky E, Zhu AX, Finn RS. Immunotherapies for hepatocellular carcinoma. Nat Rev Clin Oncol. 2022;19:151-172. [RCA] [PubMed] [DOI] [Full Text] [Cited by in Crossref: 206] [Cited by in RCA: 1012] [Article Influence: 337.3] [Reference Citation Analysis (2)] |
| 8. | Donne R, Lujambio A. The liver cancer immune microenvironment: Therapeutic implications for hepatocellular carcinoma. Hepatology. 2023;77:1773-1796. [RCA] [PubMed] [DOI] [Full Text] [Cited by in Crossref: 114] [Cited by in RCA: 328] [Article Influence: 164.0] [Reference Citation Analysis (0)] |
| 9. | Thorgeirsson SS, Lee JS, Grisham JW. Molecular prognostication of liver cancer: end of the beginning. J Hepatol. 2006;44:798-805. [RCA] [PubMed] [DOI] [Full Text] [Cited by in Crossref: 48] [Cited by in RCA: 50] [Article Influence: 2.6] [Reference Citation Analysis (0)] |
| 10. | Suvà ML, Tirosh I. Single-Cell RNA Sequencing in Cancer: Lessons Learned and Emerging Challenges. Mol Cell. 2019;75:7-12. [RCA] [PubMed] [DOI] [Full Text] [Cited by in Crossref: 187] [Cited by in RCA: 304] [Article Influence: 60.8] [Reference Citation Analysis (0)] |
| 11. | Tang Y, Guo C, Yang Z, Wang Y, Zhang Y, Wang D. Identification of a Tumor Immunological Phenotype-Related Gene Signature for Predicting Prognosis, Immunotherapy Efficacy, and Drug Candidates in Hepatocellular Carcinoma. Front Immunol. 2022;13:862527. [RCA] [PubMed] [DOI] [Full Text] [Full Text (PDF)] [Cited by in Crossref: 22] [Cited by in RCA: 22] [Article Influence: 7.3] [Reference Citation Analysis (0)] |
| 12. | Wang Z, Zhu J, Liu Y, Liu C, Wang W, Chen F, Ma L. Development and validation of a novel immune-related prognostic model in hepatocellular carcinoma. J Transl Med. 2020;18:67. [RCA] [PubMed] [DOI] [Full Text] [Full Text (PDF)] [Cited by in Crossref: 41] [Cited by in RCA: 68] [Article Influence: 13.6] [Reference Citation Analysis (0)] |
| 13. | Yofe I, Dahan R, Amit I. Single-cell genomic approaches for developing the next generation of immunotherapies. Nat Med. 2020;26:171-177. [RCA] [PubMed] [DOI] [Full Text] [Cited by in Crossref: 48] [Cited by in RCA: 80] [Article Influence: 16.0] [Reference Citation Analysis (0)] |
| 14. | Yang D, Kuang T, Zhou Y, Su Y, Shen J, Yu B, Zhao K, Ding Y. Tumor-associated endothelial cell prognostic risk model and tumor immune environment modulation in liver cancer based on single-cell and bulk RNA sequencing: Experimental verification. Int Immunopharmacol. 2023;124:110870. [RCA] [PubMed] [DOI] [Full Text] [Reference Citation Analysis (0)] |
| 15. | Li J, Zhang H, Mu B, Zuo H, Zhou K. Identifying phenotype-associated subpopulations through LP_SGL. Brief Bioinform. 2023;25. [RCA] [PubMed] [DOI] [Full Text] [Cited by in Crossref: 1] [Cited by in RCA: 1] [Article Influence: 0.5] [Reference Citation Analysis (0)] |
| 16. | Zhou G, Boor PPC, Bruno MJ, Sprengers D, Kwekkeboom J. Immune suppressive checkpoint interactions in the tumour microenvironment of primary liver cancers. Br J Cancer. 2022;126:10-23. [RCA] [PubMed] [DOI] [Full Text] [Cited by in Crossref: 6] [Cited by in RCA: 18] [Article Influence: 6.0] [Reference Citation Analysis (0)] |
| 17. | Zhang Q, Lou Y, Bai XL, Liang TB. Immunometabolism: A novel perspective of liver cancer microenvironment and its influence on tumor progression. World J Gastroenterol. 2018;24:3500-3512. [RCA] [PubMed] [DOI] [Full Text] [Full Text (PDF)] [Cited by in CrossRef: 53] [Cited by in RCA: 63] [Article Influence: 9.0] [Reference Citation Analysis (0)] |
| 18. | Ma L, Heinrich S, Wang L, Keggenhoff FL, Khatib S, Forgues M, Kelly M, Hewitt SM, Saif A, Hernandez JM, Mabry D, Kloeckner R, Greten TF, Chaisaingmongkol J, Ruchirawat M, Marquardt JU, Wang XW. Multiregional single-cell dissection of tumor and immune cells reveals stable lock-and-key features in liver cancer. Nat Commun. 2022;13:7533. [RCA] [PubMed] [DOI] [Full Text] [Full Text (PDF)] [Cited by in RCA: 93] [Reference Citation Analysis (0)] |
| 19. | Jin S, Guerrero-Juarez CF, Zhang L, Chang I, Ramos R, Kuan CH, Myung P, Plikus MV, Nie Q. Inference and analysis of cell-cell communication using CellChat. Nat Commun. 2021;12:1088. [RCA] [PubMed] [DOI] [Full Text] [Full Text (PDF)] [Cited by in Crossref: 3052] [Cited by in RCA: 4073] [Article Influence: 1018.3] [Reference Citation Analysis (0)] |
| 20. | Ma L, Hernandez MO, Zhao Y, Mehta M, Tran B, Kelly M, Rae Z, Hernandez JM, Davis JL, Martin SP, Kleiner DE, Hewitt SM, Ylaya K, Wood BJ, Greten TF, Wang XW. Tumor Cell Biodiversity Drives Microenvironmental Reprogramming in Liver Cancer. Cancer Cell. 2019;36:418-430.e6. [RCA] [PubMed] [DOI] [Full Text] [Cited by in Crossref: 390] [Cited by in RCA: 546] [Article Influence: 91.0] [Reference Citation Analysis (0)] |
| 21. | Ritchie ME, Phipson B, Wu D, Hu Y, Law CW, Shi W, Smyth GK. limma powers differential expression analyses for RNA-sequencing and microarray studies. Nucleic Acids Res. 2015;43:e47. [RCA] [PubMed] [DOI] [Full Text] [Full Text (PDF)] [Cited by in Crossref: 16184] [Cited by in RCA: 25699] [Article Influence: 2569.9] [Reference Citation Analysis (0)] |
| 22. | Friedman J, Hastie T, Tibshirani R. Regularization Paths for Generalized Linear Models via Coordinate Descent. J Stat Softw. 2010;33:1-22. [RCA] [PubMed] [DOI] [Full Text] [Cited by in Crossref: 7447] [Cited by in RCA: 8418] [Article Influence: 561.2] [Reference Citation Analysis (0)] |
| 23. | Zhang R, Gao X, Zuo J, Hu B, Yang J, Zhao J, Chen J. STMN1 upregulation mediates hepatocellular carcinoma and hepatic stellate cell crosstalk to aggravate cancer by triggering the MET pathway. Cancer Sci. 2020;111:406-417. [RCA] [PubMed] [DOI] [Full Text] [Full Text (PDF)] [Cited by in Crossref: 33] [Cited by in RCA: 70] [Article Influence: 11.7] [Reference Citation Analysis (0)] |
| 24. | Li S, Xu L, Wu G, Huang Z, Huang L, Zhang F, Wei C, Shen Q, Li R, Zhang L, Xu X. Remodeling Serine Synthesis and Metabolism via Nanoparticles (NPs)-Mediated CFL1 Silencing to Enhance the Sensitivity of Hepatocellular Carcinoma to Sorafenib. Adv Sci (Weinh). 2023;10:e2207118. [RCA] [PubMed] [DOI] [Full Text] [Cited by in RCA: 23] [Reference Citation Analysis (0)] |
| 25. | Xia Y, Zhou L, Yang HC, Yu CW. Chemokine CCL5 immune subtypes of human liver cancer with prognostic significance. Int Immunopharmacol. 2022;113:109372. [RCA] [PubMed] [DOI] [Full Text] [Reference Citation Analysis (0)] |
| 26. | Barbie DA, Tamayo P, Boehm JS, Kim SY, Moody SE, Dunn IF, Schinzel AC, Sandy P, Meylan E, Scholl C, Fröhling S, Chan EM, Sos ML, Michel K, Mermel C, Silver SJ, Weir BA, Reiling JH, Sheng Q, Gupta PB, Wadlow RC, Le H, Hoersch S, Wittner BS, Ramaswamy S, Livingston DM, Sabatini DM, Meyerson M, Thomas RK, Lander ES, Mesirov JP, Root DE, Gilliland DG, Jacks T, Hahn WC. Systematic RNA interference reveals that oncogenic KRAS-driven cancers require TBK1. Nature. 2009;462:108-112. [RCA] [PubMed] [DOI] [Full Text] [Full Text (PDF)] [Cited by in Crossref: 1822] [Cited by in RCA: 2695] [Article Influence: 168.4] [Reference Citation Analysis (0)] |
| 27. | Charoentong P, Finotello F, Angelova M, Mayer C, Efremova M, Rieder D, Hackl H, Trajanoski Z. Pan-cancer Immunogenomic Analyses Reveal Genotype-Immunophenotype Relationships and Predictors of Response to Checkpoint Blockade. Cell Rep. 2017;18:248-262. [RCA] [PubMed] [DOI] [Full Text] [Cited by in Crossref: 1446] [Cited by in RCA: 3187] [Article Influence: 398.4] [Reference Citation Analysis (0)] |
| 28. | Subbiah V, Solit DB, Chan TA, Kurzrock R. The FDA approval of pembrolizumab for adult and pediatric patients with tumor mutational burden (TMB) ≥10: a decision centered on empowering patients and their physicians. Ann Oncol. 2020;31:1115-1118. [RCA] [PubMed] [DOI] [Full Text] [Cited by in Crossref: 82] [Cited by in RCA: 175] [Article Influence: 35.0] [Reference Citation Analysis (0)] |
| 29. | Jiang P, Gu S, Pan D, Fu J, Sahu A, Hu X, Li Z, Traugh N, Bu X, Li B, Liu J, Freeman GJ, Brown MA, Wucherpfennig KW, Liu XS. Signatures of T cell dysfunction and exclusion predict cancer immunotherapy response. Nat Med. 2018;24:1550-1558. [RCA] [PubMed] [DOI] [Full Text] [Cited by in Crossref: 1184] [Cited by in RCA: 3398] [Article Influence: 485.4] [Reference Citation Analysis (0)] |