


Published online Mar 14, 2024. doi: 10.3748/wjg.v30.i10.1377
Peer-review started: October 31, 2023
First decision: December 5, 2023
Revised: January 2, 2024
Accepted: February 6, 2024
Article in press: February 6, 2024
Published online: March 14, 2024
Processing time: 135 Days and 0.4 Hours
Crohn’s disease (CD) is often misdiagnosed as intestinal tuberculosis (ITB). However, the treatment and prognosis of these two diseases are dramatically different. Therefore, it is important to develop a method to identify CD and ITB with high accuracy, specificity, and speed.
To develop a method to identify CD and ITB with high accuracy, specificity, and speed.
A total of 72 paraffin wax-embedded tissue sections were pathologically and clinically diagnosed as CD or ITB. Paraffin wax-embedded tissue sections were attached to a metal coating and measured using attenuated total reflectance fourier transform infrared spectroscopy at mid-infrared wavelengths combined with XGBoost for differential diagnosis.
The results showed that the paraffin wax-embedded specimens of CD and ITB were significantly different in their spectral signals at 1074 cm-1 and 1234 cm-1 bands, and the differential diagnosis model based on spectral characteristics combined with machine learning showed accuracy, specificity, and sensitivity of 91.84%, 92.59%, and 90.90%, respectively, for the differential diagnosis of CD and ITB.
Information on the mid-infrared region can reveal the different histological components of CD and ITB at the molecular level, and spectral analysis combined with machine learning to establish a diagnostic model is expected to become a new method for the differential diagnosis of CD and ITB.
Core Tip: Crohn’s disease (CD) is often misdiagnosed as intestinal tuberculosis (ITB). However, the treatment and prognosis of these two diseases are dramatically different. Therefore, it is important to develop a method to identify CD and ITB with high accuracy, specificity, and speed. For the first time the paraffin wax-embedded tissue sections were attached to a metal coating and measured using attenuated total reflectance fourier transform infrared spectroscopy at mid-infrared wavelengths combined with XGBoost for differential diagnosis of CD and ITB. Information on the mid-infrared region can reveal the different histological components of CD and ITB at the molecular level, and spectral analysis combined with machine learning to establish a diagnostic model is expected to become a new method for the differential diagnosis of CD and ITB.
- Citation: Li YP, Lu TY, Huang FR, Zhang WM, Chen ZQ, Guang PW, Deng LY, Yang XH. Differential diagnosis of Crohn’s disease and intestinal tuberculosis based on ATR-FTIR spectroscopy combined with machine learning. World J Gastroenterol 2024; 30(10): 1377-1392
- URL: https://www.wjgnet.com/1007-9327/full/v30/i10/1377.htm
- DOI: https://dx.doi.org/10.3748/wjg.v30.i10.1377
Crohn’s disease (CD) is an inflammatory bowel disease involving interactions between various pathogenic factors of unknown etiology[1,2]. CD has a high prevalence in North America and Europe but has shown an apparent increasing prevalence across the globe in recent years, especially in the Asia-Pacific region (China, India, etc.)[3,4]. Intestinal tuberculosis (ITB) is a primary or secondary chronic intestinal infection caused by Mycobacterium tuberculosis (M. tuberculosis)[5]. Due to economic development, lifestyle, and other reasons, ITB is mostly prevalent in Asia, but its prevalence in developed countries and regions has increased in recent years[6]. CD and ITB are two completely different diseases with similar symptoms, signs, and examination results, but completely different treatment methods, and misdiagnosis and mistreatment may cause serious consequences and even patient death[7]. Therefore, it is important to differentiate between CD and ITB prior to treatment.
Currently, CD and ITB can be diagnosed by many methods, such as observation of clinical manifestations[8], endoscopy[9-13], histopathological examination[14], imaging examination[15,16], and M. tuberculosis detection[17-19], but these methods have limitations. Patients with CD and ITB have similar clinical manifestations. On histopathological biopsy examination, the specific manifestation of ITB was caseous necrotizing granuloma, and the specific manifestation of CD was non-caseous granuloma, but the detection rate of each manifestation was not high. Given the many similarities between ITB and CD, high misdiagnosis rates, and likely severe consequences of misdiagnosis and mistreatment, there is an urgent need to develop a new, rapid, and accurate differential diagnostic method.
Infrared spectroscopy is a fast and non-destructive detection technology that works mainly through illumination of the surface of a material with infrared light to induce changes in the molecular vibrations of the material, which are then used to conduct qualitative and quantitative analyses of the material. Regular fourier transform infrared (FTIR) spectrometers equipped with accessories for attenuated total reflectance (ATR) have the advantages of simple specimen preparation, no need for chemical reagents, non-destructiveness, and no special requirements for specimen size and water content. The main component of biological tissues is water, and in addition to water, tissues mainly contain organic compounds, such as proteins, lipids, and sugars, which have strong infrared activity. For example, the characteristic absorption of proteins in the mid-infrared region is mainly attributed to the stretching vibration of the amide carbonyl C = O in the band-1685-1630 cm-1, also known as the amide I band, and the scissoring vibration of NH2 in R-CONH2 molecules in the band-1640-1600 cm-1, also known as the amide II band[20]. These materials undergo significant changes in structure, conformation, and quantity during the pathological processes of tissues and cells, which may cause a certain degree of difference between diseased and normal tissues in the infrared absorption spectra. Different pathological processes result in different tissue components. Infrared spectroscopy is particularly sensitive to specimen changes, thereby providing a possibility for differential diagnosis of the disease.
Given that infrared spectroscopy may contain abundant characteristic biochemical information, and in view of the complexity of CD and ITB pathology, this study is the first to propose a new differential diagnosis method for CD and ITB based on ATR-FTIR spectroscopy combined with machine learning. Paraffin wax-embedded tissue sections with a confirmed diagnosis of CD or ITB were subjected to ATR-FTIR measurements, and the spectral feature changes in the two types of sections in different spectral regions were analyzed. Next, the spectral features were combined with eXtreme Gradient Boosting of the gradient boosted decision trees (XGBoost) to establish a machine-learning model as a new, fast, and accurate detection method for the differential diagnosis of CD and ITB.
A Bruker Vertex 70 FTIR spectrometer equipped with an ATR specimen measurement accessory was used. The ATR specimen cell was composed of a mixed crystal of diamond and ZnSe. The specimen was illuminated with infrared light at an incident angle of 45° such that total internal reflection occurred three times. Spectra were acquired in the range of 4000-600 cm-1 using a deuterated triglycine sulfate detector with a KBr beam splitter. The number of scans was 16, the resolution was 4 cm-1, the experimental temperature was 25 °C ± 1 °C, and the relative humidity was 46%. During spectral acquisition, paraffin wax-embedded tissue sections of the intestinal mucosa were attached to the ATR accessory to obtain the FTIR absorption spectra. Each specimen was measured in three regions and each measurement was repeated 16 times and averaged.
Specimen information: A total of 72 paraffin wax-embedded tissue sections that were pathologically and clinically diagnosed with CD or ITB with typical microscopic pathological features were collected from four hospitals: The Department of Gastroenterology of the 74th Army Group Hospital (formerly the 421 Hospital), Nanfang Hospital of Southern Medical University, Guangzhou Chest Hospital, and General Hospital of Southern Military Command, consisting of 28 CD tissue sections (16 males and 12 females) and 44 ITB tissue sections (36 males and 8 females). All specimens were from the same ethnic group with the same socioeconomic background, and were collected in accordance with the relevant laws and regulations.
Specimen preparation process: (1) Metal-coated slide preparation: Ordinary quartz glass slides were coated with a metal-silver film, as shown in Figure 1. We filed an application for a patent for the invention of our method for coating a metal-coated slide; (2) Conventional paraffin wax embedding: The study objects were paraffin wax-embedded tissue sections; after collection from patients. All fresh tissue specimens were fixed in formalin solution, washed, dehydrated, and embedded according to routine methods; (3) Mounting: Paraffin wax-embedded tissues were sectioned and picked with forceps after being subjected to routine warming treatment, and the selected tissue sections were accurately mounted onto a metal-silver film; and (4) Dewaxing: Dewaxing was carried out using xylene and gradient ethanol in a typical procedure as follows: the specimen was treated with the solvent in the order of xylene (first time, 15 min), xylene (second time, 15 min), 100% ethanol (first time, 3 min), 100% ethanol (second time, 3 min), 95% ethanol (3 min), 83% ethanol (3 min), 70% ethanol (3 min), 50% ethanol (3 min), 30% ethanol (3 min), and distilled water (3 min); after dewaxing, the sections were allowed to stand for more than 30 h and then subjected to spectral measurement.

Optimization of dewaxing durations: To explore the effect of the dewaxing duration on the spectral measurement results, tissue sections attached to the metal slides were dewaxed for different durations and then subjected to spectral measurements: (1) Pre-test: Two paraffin wax-embedded specimens (one CD and the other ITB) were taken and each was sliced into eight sections for dewaxing. Every six hours from the start of the dewaxing, two sections from the same original specimen were removed from the dewaxing process and subjected to spectral measurements in the time order of 0 (not dewaxed), 6 h (waxed; the same hereinafter), 12 h, 18 h, 24 h, 30 h, 36 h, and 42 h for a total of eight time points; and (2) Confirmation test: Two paraffin wax-embedded specimens (one CD and the other ITB) were obtained, and each was sliced into five sections for dewaxing. Two sections were sequentially removed from the dewaxing procedure at 25 h, 26 h, 27 h, 28 h, and 29 h after the start of dewaxing and were subjected to spectral measurements, resulting in five time points.
XGBoost is short for Extreme Gradient Boosting, which works by constructing a set of classification and regression tree (CART) models and summing up the results of multiple CARTs as the final predictive output. The greatest advantage of this method is that during training, classifiers with good classification performance can compensate for those with poor classification performance. The theoretical basis is that the model classification output based on a combination of multiple-base classifiers is better than that based on a single-base classifier[21].
This principle is illustrated in Figure 2. In each iteration of gradient boosting, residuals are used to correct the previous predictor by optimizing a specific loss function. The loss function was significantly improved by including a regularization term to balance the gradient of the objective function and complexity of the model to avoid overfitting[22]. This principle is mathematically expressed by equation (Eq.) 1.


The training parameters for a given data set are denoted as, and “L” is the loss function of the training set, such as square loss or logic loss, which measures the fitness of the model to the training data. is a regularization term, such as an L1-regularization or L2-regularization term, which mainly measures the complexity of the model. The simpler the model, the better its ability to prevent over-fitting. Because the base classifiers are decision trees, the output of the model is obtained by averaging every tree’s classification or regression result over the ensemble F of k decision trees.
The objective function after t iterations can be expressed as Eq. 2.
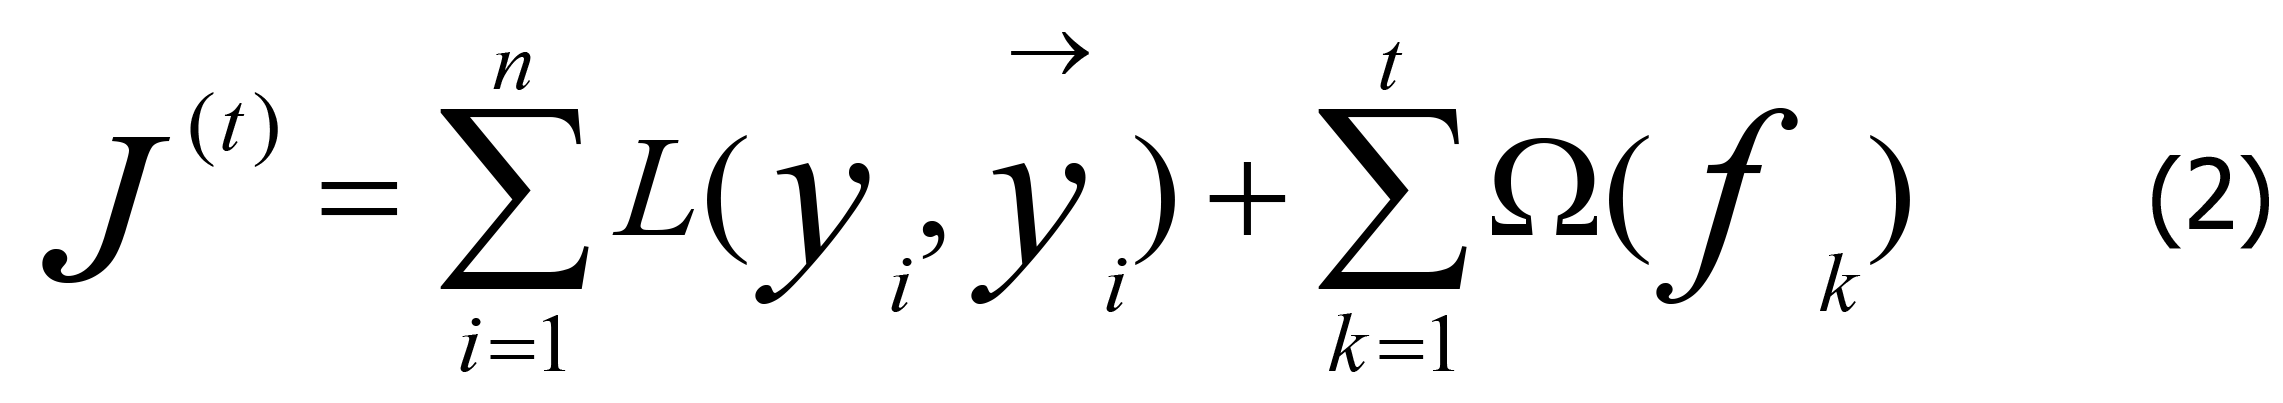
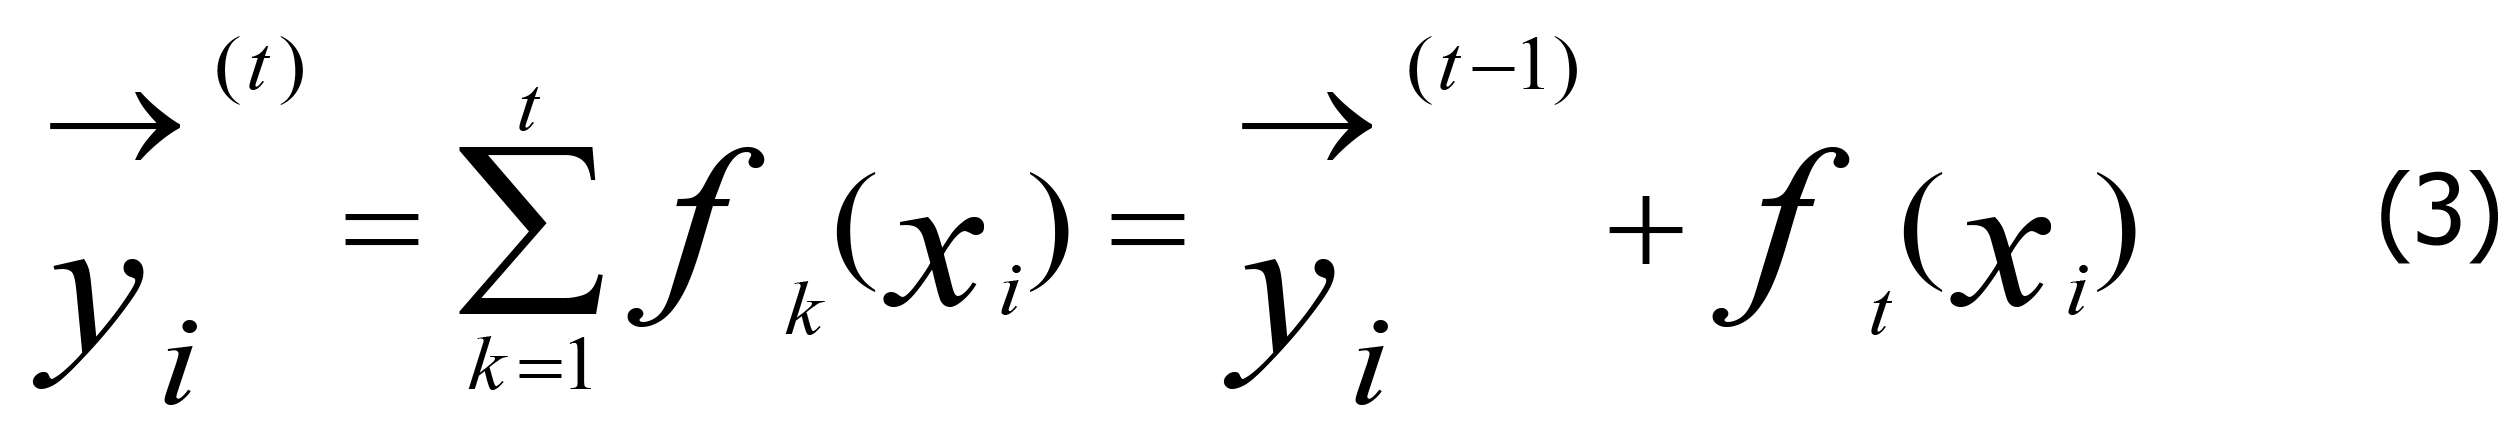
In Eq. (2), n is the number of predictions, and →(t)/yi is expressed by Eq. 3.
The regularization term Ω (fk) of the decision tree is defined as Eq. 4.
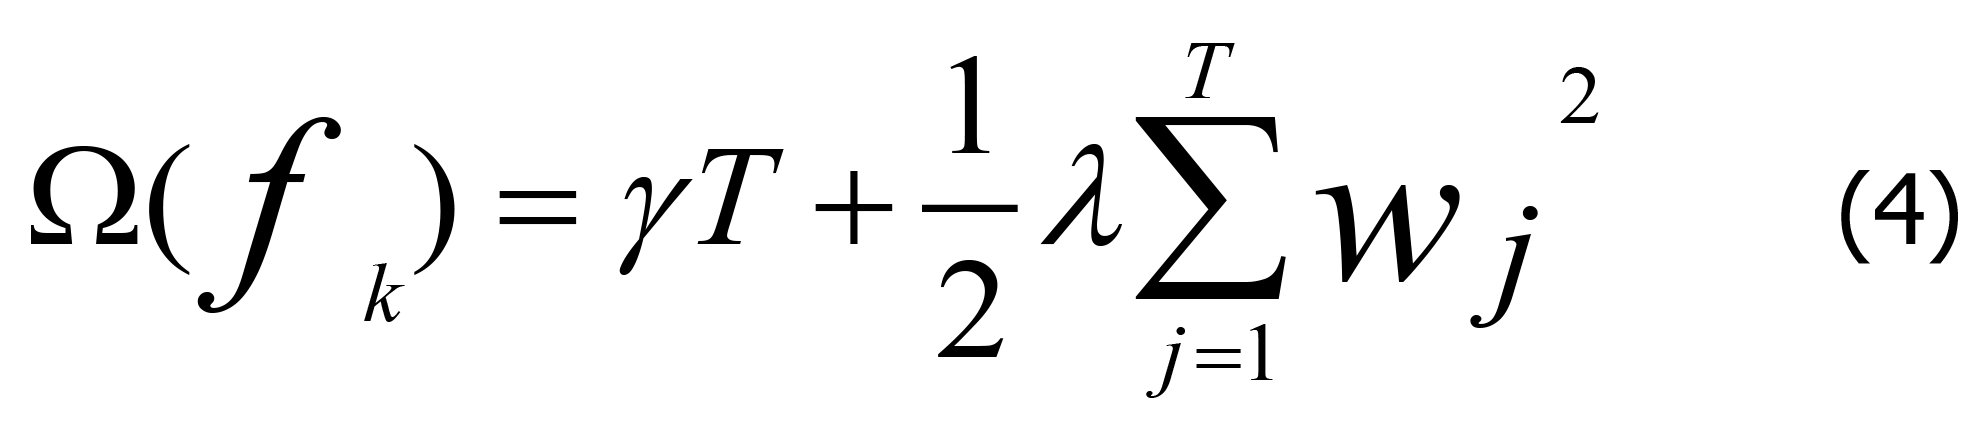
In Eq. 4, γ is the complexity of each leaf, T is the number of child leaf nodes in the decision tree, and λ is the penalty parameter. In the XGBoost method, the loss function is approximated using a second-order Taylor expansion rather than the first-order Taylor expansion, which is adopted for general gradient boosting. Assuming that the loss function is the mean square error (MSE) function, the objective function can be expressed as below.
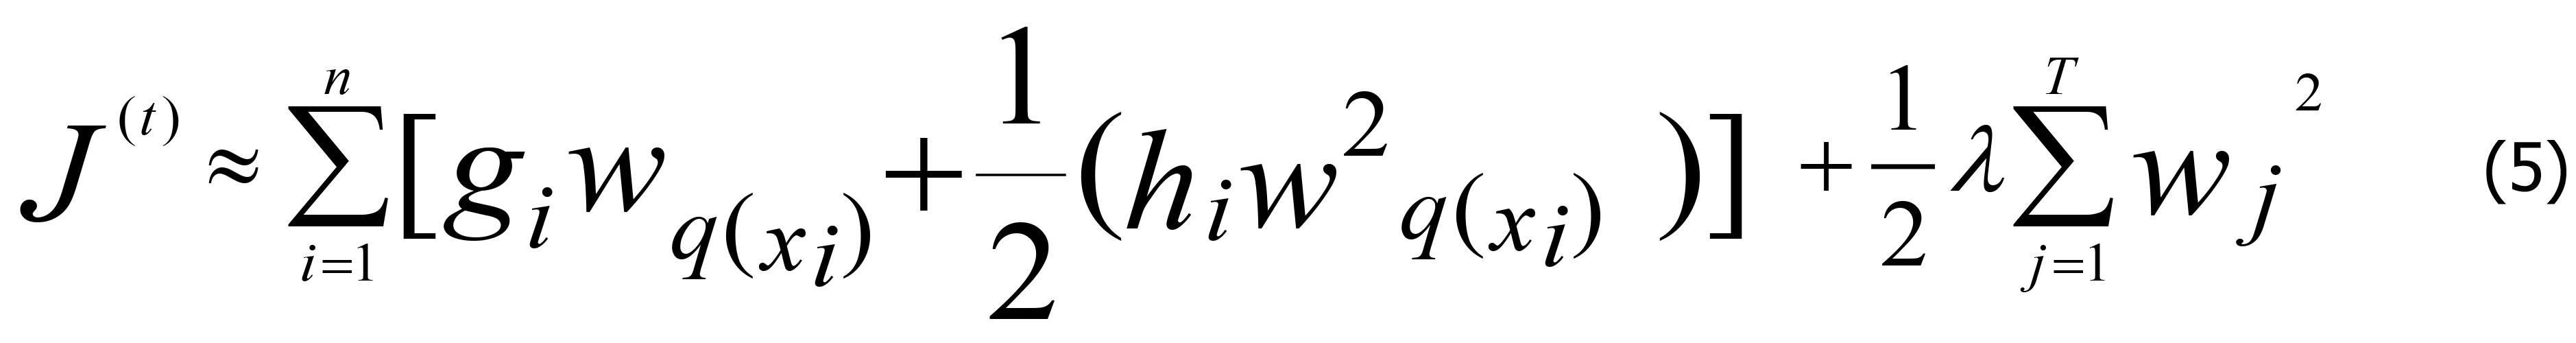
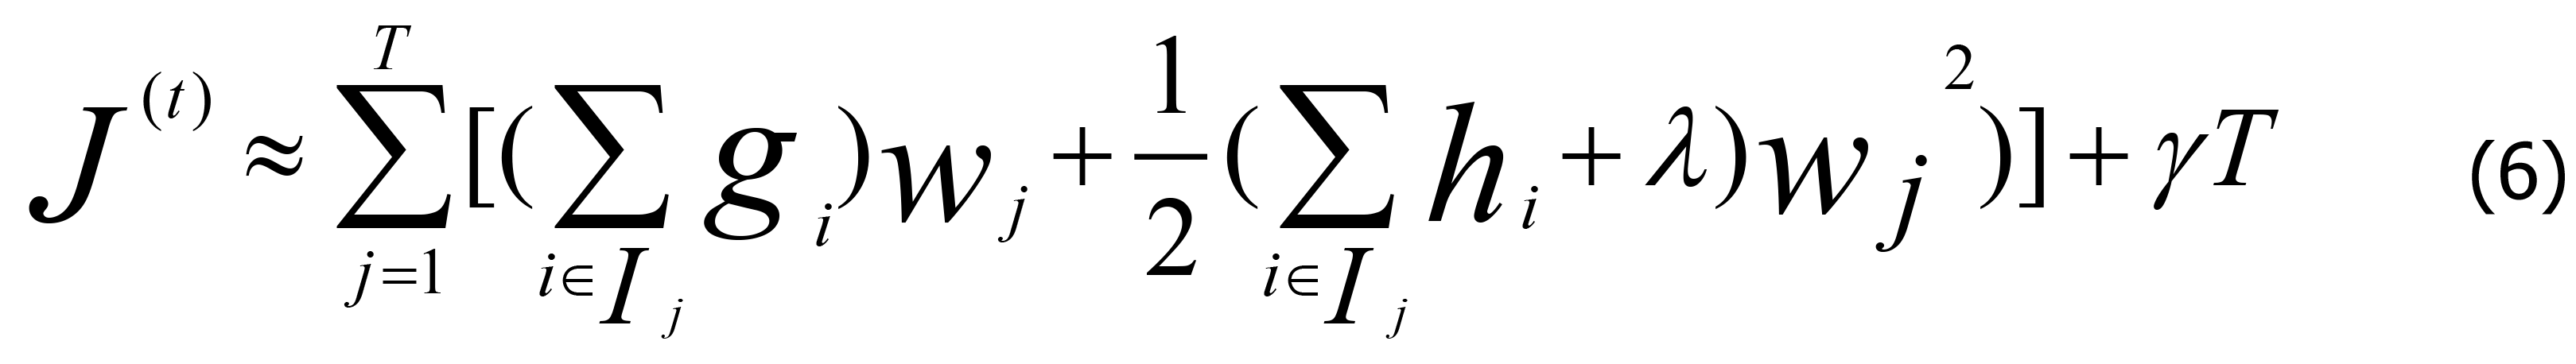
In Eq. 5, the constant term can be dropped for simplicity, and q (xi) is a function that assigns data points to a corresponding child leaf node, with gi and hi representing the first and second derivatives of the MSE loss function, respectively. In Eq. 5, the loss function was determined by the sum of the loss values of each data sample. As each data sample corresponds to only one leaf node, the loss function can also be represented by the sum of the loss values of each leaf node. Accordingly, Eq. 5 can be rewritten as Eq. 6.
According to Eqs. 3-13, Gi and Hi can be defined as in Eq. 7.
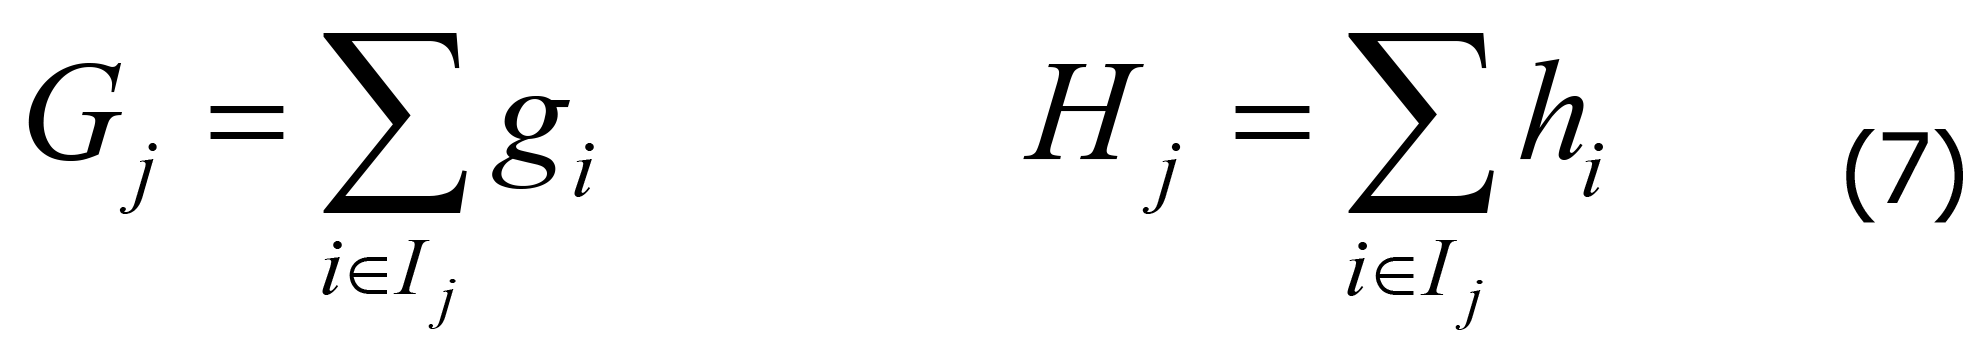
Where Ij represents all data samples in leaf node j. Therefore, the optimization of the objective function can be transformed into minimizing the quadratic function.
Regarding the main model parameters, the parameter space of XGBoost is mainly comprised of three types of parameters: general, booster, and learning objective. The general and learning objective parameters are intended to guide the overall functioning and control the metrics for the results of each step, whereas the booster parameters control each boosting step and are the main tuning parameters. The booster parameters include n_estimators, learning_rate, min_child_weight, gamma, subsample, and alpha. The parameter n_estimators is the number of base classifiers. If the number is set to a value that is too small or too large, underfitting or overfitting will occur. Learning_rate represents the weight reduction coefficient of each base classifier, and an incorrect setting of this parameter leads to failure in model fitting. Min_child_weight represents the minimum sum of instance weights required in a child leaf node and is used to improve the generalization of the model. Gamma controls the decrease in the value of the model loss function when a node splits. The subsample mainly controlled the probability of random sampling for each tree, which was typically set in the range of 0.5-1.0. The regularization parameter alpha represents the L1-regularization term of the weight and is used to reduce the complexity of the model.
The machine learning model was mainly run in Python 3.6.1, and scientific computing libraries, such as numpy 1.12.1, and pandas 0.19.2, were used for training and importing. Scikit-learn 0.18.1, and Xgboost 0.6 were used to support the XGBoost-based integrated learning model.
The accuracy, specificity, and sensitivity are important evaluation indicators for XGBoost-based diagnosis models. The greater the accuracy of these indicators, the better the diagnostic performance of the model. The formulas for each parameter are shown in Eqs. 8-10.

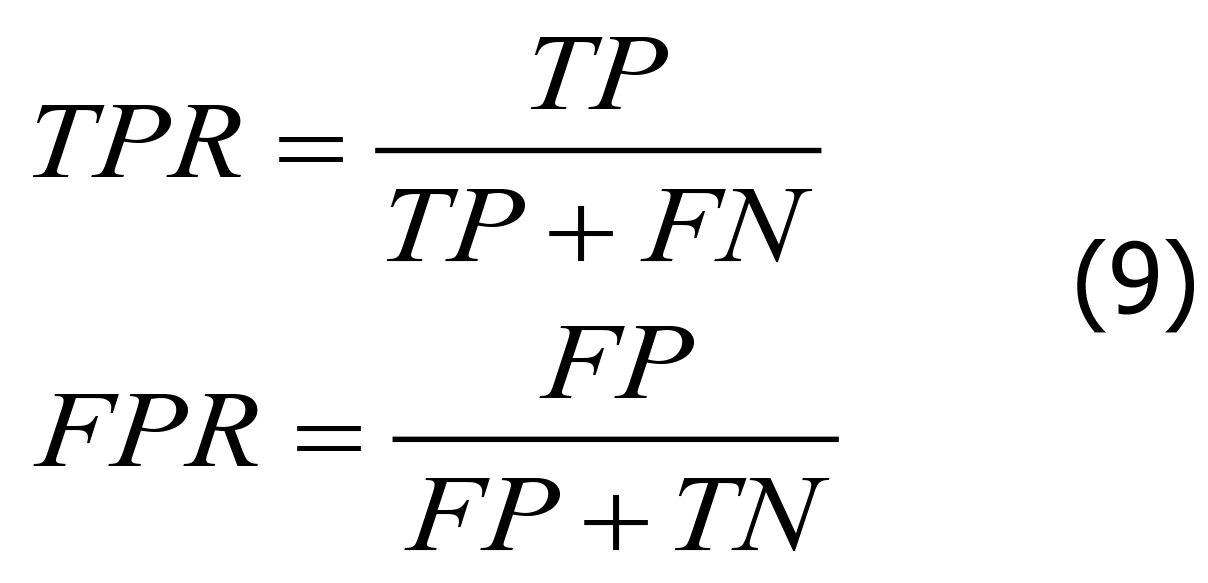
In Eq. 8, “TPR” is the sensitivity, “FPR” is the specificity, “TP” is the number of positive samples in the dataset correctly classified by the model, “FN” is the number of positive samples in the dataset incorrectly classified by the model, “FP” is the number of negative samples in the dataset incorrectly classified by the model, and “TN” is the number of negative samples in the dataset correctly classified by the model. In Eq. 10, “M” and “N” represent the number of positive and negative samples, respectively.
Pathological diagnosis was conducted in accordance with the “Chinese Consensus on the Diagnosis and Treatment of Inflammatory Bowel Disease”[23]. The CD biopsy specimens included in this study all had characteristic manifestations, such as focal chronic inflammation, structural abnormalities of the focal crypt, and non-caseous granulomas. In the absence of granulomas, at least three of the following characteristic pathological manifestations must be observed: (1) Segmental or focal lesions; (2) confluent longitudinal linear ulcers; (3) pebble-like appearance and fistula formation; (4) mesenteric fat-enwrapped lesions; and (5) intestinal wall thickening and stenosis. If there were non-caseous granulomas, another characteristic manifestation of CD was observed under an optical microscope, and all specimens with ITB symptoms were excluded. Typical CD specimens are shown in Figure 3A. The characteristic manifestations of CD under an optical microscope include: (1) Transmural inflammation; (2) aggregated distribution of inflammation and transmural lymphoid hyperplasia; (3) submucosal thickening (due to fibrosis and fibromuscular tissue damage, inflammation, and edema); (4) fissures (fissure-like ulcers); (5) non-caseous granulomas (including lymph nodes); (6) abnormalities of the intestinal nervous system (submucosal nerve fiber hyperplasia, ganglion inflammation, and proliferation of intermuscular nerve fibers); and (7) normal maintenance of mucus secretion in the epithelium (the goblet cells are usually normal). ITB specimens underwent typical pathological changes, such as the appearance of caseous granulomas or related cell structures, as shown in Figure 3B. Specimens without the aforementioned significant pathological features were excluded from the study, as shown in Figure 3C and D.

Effects of the background glass and paraffin wax: The effects of the background quartz glass and paraffin wax were investigated. As shown in Figure 4A, the characteristic absorption bands of quartz glass are centered at 785 cm-1, 990 cm-1, and 1145 cm-1, whereas the characteristic absorption bands of paraffin wax are centered at 2956 cm-1, 2916 cm-1, 2848 cm-1, 1461 cm-1, and 719 cm-1, as shown in Figure 4B. The characteristic absorption of proteins, lipids, and carbohydrates in the mid-infrared region occurs mainly in the 1800 cm-1-600 cm-1 and 3000 cm-1-2500cm-1 bands. Therefore, these bands interfere with the characteristic signals of the tissues.

To remove the interference of the background quartz glass and paraffin wax, a metal-silver film with a diameter of 5 mm was coated on quartz glass to shield the interfering absorption of the quartz glass. Figure 5 presents the shielding performance of the metal-silver in undewaxed sections 1, 2, and 3. The characteristic absorption of quartz glass at 785 cm-1, 990 cm-1, and 1145 cm-1 was substantially shielded. In addition, paraffin wax-embedded tissue sections were dewaxed to reduce the interfering absorption of paraffin wax, as depicted in Figure 5. After being subjected to the dewaxing for 6 h, 12 h, and 18 h, the characteristic absorption of paraffin wax at 1461 cm-1 and 719 cm-1 was essentially eliminated, whereas its characteristic absorption at 2956 cm-1, 2916 cm-1, and 2848 cm-1 remained to some extent.

Optimization of dewaxing duration: To further reduce the interfering effects of paraffin wax on the absorption of tissue sections, the duration of dewaxing was optimized. First, the paraffin wax-embedded tissue sections were subjected to the dewaxing process for a time series of 6 h, 12 h, 18 h, 24 h, 30 h, 36 h, and 42 h, followed by observation of the absorption at 3000-2500 cm-1 as shown in Figure 6A. An abrupt decrease in absorption occurred from 24 h to 30 h of dewaxing, while the absorption after 30 h showed little variation. Second, further optimization was performed for a dewaxing duration of 24-30 h as shown in Figure 6B; after 26 h, the characteristic absorption of paraffin wax leveled off without further reduction. Therefore, the optimal dewaxing time was determined to be 26 h.

Spectral feature analysis: The infrared spectral features of the biological tissues are outlined in Table 1. In addition to water, the intestinal mucosa mainly contains organic compounds such as lipids, proteins, and sugars, all of which have strong infrared activity. For example, the absorption band at 1800-1700 cm-1 is mainly attributed to the stretching vibration of lipid C = O; the absorption band at 1685-1630 cm-1 is mainly attributed to the stretching vibration of amide carbonyl C = O, also known as the amide I band; the absorption band at 1640-1600 cm-1 is mainly attributed to the scissoring vibration of NH2 in R-CONH2 molecules, also known as the amide II band; the 1500-800 cm-1 absorption band is mainly attributed to the stretching vibration of the P-O bond and the P = O double bond in nucleic acids as well as the stretching vibration of sugar C-OH[24]. The FTIR-ATR spectra of CD and ITB tissues are shown in Figure 7. The water absorption band was centered at approximately 3302 cm-1, and the vibration absorption bands of CH3 and CH2 were mainly centered at 2956 cm-1, 2916 cm-1, and 2848 cm-1, whereas the characteristic absorption bands of other tissue components mainly appeared at 1645 cm-1, 1539 cm-1, 1456 cm-1, 1394 cm-1, 1234 cm-1, and 1056 cm-1 in the mid-infrared fingerprint region (1800-800 cm-1).

| Bands position (cm-1) | Assignments of group | Assignments of substance |
| 2925 | υas, CH3 | Lipid related |
| 2855 | υas, CH2 | Lipid related |
| 1740 | υC=O | Lipid |
| 1640 | Amide I | Protein |
| 1550 | Amide II | Protein |
| 1460 | δC-H | Lipid related |
| 1400 | δC-H, δC-O-H | Lipid related |
| 1305 | δC-H, δC-O-H | Undetermined |
| 1240 | υas, PO2- | Nucleic acid related |
| 1160 | υC-O, δC-O-H, δC-O-C | Carbohydrate related |
| 1120 | υC-O, δC-O-H, δC-O-C | Carbohydrate related |
| 1080 | υas, PO2- | Nucleic acid related |
Analysis results of the ITB and CD FTIR-ATR spectra are shown in Figure 7. Figure 7B depicts the average spectral intensity of the characteristic absorption bands, with the error bars representing the intrinsic fluctuation of the spectral band intensity. The average spectral intensity of ITB at 3302 cm-1, 2956 cm-1, 2916 cm-1, 2848 cm-1, 1645 cm-1, 1539 cm-1, 1456 cm-1, 1394 cm-1, and 1234 cm-1 was slightly higher than that of CD, while CD had slightly higher average spectral intensity at 1056 cm-1 than ITB. However, both ITB and CD showed large intrinsic fluctuations in spectral intensity, with a significant overlap of spectral intensity within the error ranges. Therefore, the differential diagnosis of ITB and CD based on the original spectral intensity is subject to large uncertainties and likely leads to misjudgment.
The derivative spectra are shown in Figure 8. Between ITB and CD, the first- and second-derivative spectra differed significantly at 1134 cm-1 (carbohydrate C-O bond) and 1074 cm-1 (phosphodiester bond P-O), respectively. An intensity comparison of the two characteristic absorption bands is shown in Figure 9, with the error bars representing the intrinsic fluctuations of CD and ITB in the spectral intensity. The average spectral intensity of CD at 1134 cm-1 was stronger than that of ITB, with the former fluctuating in a relatively large range and the latter in a relatively small range; however, the two intensities overlapped severely within almost half of the error ranges. The average spectral intensity of CD at 1074 cm-1 was stronger than that of ITB, with the former fluctuating in a relatively large range and the latter in a relatively small range; the two intensities overlapped within almost one-third of the error ranges. As shown above, ITB and CD still showed a significant overlap in the intensity distribution of the derivative spectra despite the obvious characteristic absorption bands, which likely led to misdiagnosis. Therefore, it is necessary to employ a machine learning-based classification method to extract the spectral characteristics of the ITB and CD in a more effective manner.


Sample set partitioning: At present, the methods for selecting data samples mainly include the random sampling (RS) method, the Kenard-Stone (KS) method, the SPXY method (i.e., sample set partitioning based on joint x-y distances), and the duplex method. In the experiment, the RS method was used to partition sample sets. The prediction set samples of an XGBoost model are usually required to be independent; that is, they should not originate from the original calibration set samples. Therefore, for the 72 specimens collected in the study, each was measured in three different regions to generate three average spectra, totaling 194, after excluding spectra with outlying data points. Next, 194 spectra were randomly partitioned at a ratio of 3:1 into a calibration set (n = 145) and an independent prediction set (n = 49), as shown in Table 2.
| Sample set | CD | ITB | Total |
| Training set | 79 | 66 | 145 |
| Prediction set | 22 | 27 | 49 |
XGBoost model results: In this study, an XGBoost model was designed in accordance with the characteristics of the ATR-FTIR spectral data and the classification requirements to perform the binary classification of ITB and CD. The entire procedure is shown in Figure 10. The procedure consisted of three steps: Figure 10A and B acquisition of ATR-FTIR spectral datasets; Figure 10C implementation of principal component analysis and independent component analysis to extract the fingerprint spectral features of ITB and CD; and Figure 10C-E the use of a series of XGBoost decision trees as classifiers to classify the extracted fingerprint spectral features to produce the classification information for ITB and CD.

As shown in Table 3, a comparison of different data preprocessing methods revealed that the first-derivative spectra yielded the best results, with 17 ITB specimens and 23 CD specimens correctly identified by the model using original data, 20 ITB specimens and 25 CD specimens correctly identified by the model using first-derivative spectral data, and 16 ITB specimens and 26 CD specimens correctly identified by the model using second-derivative spectral data. As shown above, the preprocessing methods significantly influenced the models, and the number of misdiagnosed cases based on the derivative spectra was smaller than that based on the original spectra. In particular, the first-derivative spectral model exhibited the highest accuracy (91.84%).
| Group | True value | Predicted value | Accuracy (%) | |
| ITB | CD | |||
| Original spectral data | ITB | 17.0000 | 5.0000 | |
| CD | 4.0000 | 23.0000 | ||
| Specificity (%) | 0.8519 | |||
| Sensitivity (%) | 0.7727 | |||
| Accuracy (%) | 0.8163 | |||
| First derivative spectral data | ITB | 20.0000 | 2.0000 | |
| CD | 2.0000 | 25.0000 | ||
| Specificity (%) | 0.9259 | |||
| Sensitivity (%) | 0.9090 | |||
| Accuracy (%) | 0.9184 | |||
| Second derivative spectral data | ITB | 16.0000 | 6.0000 | |
| CD | 1.0000 | 26.0000 | ||
| Specificity (%) | 0.9630 | |||
| Sensitivity (%) | 0.7270 | |||
| Accuracy (%) | 0.8571 | |||
In this study, the XGBoost model parameters were optimized using a grid search method. The relevant search ranges were set as follows: Max_depth varied between 1 and 50 with steps of 1; n_estimators varied between 1 and 500 with steps of 10; min_child_weight varied between 1 and 30 with steps of 1; gamma varied between 0 and 15 with steps of 1; subsample varied between 0 and 1.1 with steps of 0.1; alpha varied between 0 and 10 with steps of 0.2; and learning_rate varied between 0 and 0.2 with steps of 0.01. The optimization process of the XGBoost model parameters is illustrated in Figure 10, and the optimal parameters are listed in Table 4.
| Parameters | Step length | Optimal range | AUC (%) | Accuracy (%) | ||
| Optimal value | Test | Optimal value | Test | |||
| Max_depth | 1.00 | (1, 50.0) | 3.0 | 79.9 | 4.0. | 74.5 |
| N_estimators | 10.00 | -1500 | 71.0 | 80.3 | 81.0 | 74.4 |
| Min_child_weight | 1.00 | (1, 30.0) | 4.0 | 82.1 | 4.0 | 76.0 |
| Gamma | 1.00 | (0, 15.0) | 0 | 82.1 | 0 | 76.0 |
| Subsample | 0.10 | (0, 1.1) | 1.0. | 82.1 | 1.0. | 76.0 |
| Alpha | 0.10 | (0, 10.0) | 0.3 | 82.0 | 2.8 | 75.9 |
| Learning_rate | 0.01 | (0, 0.2) | 0.1 | 82.0 | 0.1 | 75.2 |
As shown in Figure 11, the accuracy and area under the curve (AUC) increased gradually with the increase in max_depth, n_estimators, subsample, and learning_rate, eventually approaching a stable value, and decreased with an increase in min_child_weight, gamma, and alpha, eventually approaching a stable value. The AUC was significantly greater than accuracy in all cases. The optimal parameters of the XGBoost model are listed in Table 4: Max_depth = 3, n_estimators = 71, min_child_weight = 4, gamma = 0, subspecimen = 1, alpha = 0.3, and learningrate = 0.1. Finally, all optimal parameters were used to establish an optimal XGBoost model, which led to a sensitivity of 90.90% (20/22), specificity of 92.59% (25/27), and accuracy of 91.84% (45/49) for differential diagnoses, as shown in Table 3.

Differential diagnosis of CD and ITB has long been the focus of research worldwide. Daperno et al[25] established a diagnostic model for CD and ITB based on endoscopic parameters, with a sensitivity and specificity of 82.9% and 82.0%, respectively. Ramadass et al[26] extracted DNA from fecal specimens and conducted a polymerase chain reaction for M. tuberculosis (TB-PCR) targeting the IS6110 sequence, achieving a sensitivity of 79% and a specificity of 88% for the differential diagnosis of CD and ITB. Li et al[27] of the Department of Gastroenterology, Peking Union Medical College Hospital of the Chinese Academy of Medical Sciences, investigated the usefulness of in vitro interferon γ release assay (T-SPOT.TB) in differentiating ITB from CD and determined the sensitivity and specificity of T-SPOT. The prevalence of TB in the diagnosis of CD was 84.2% and 75.4%, respectively. Kedia et al[28] used computed tomography of the small intestine to diagnose CD and ITB and achieved a sensitivity of 68% and specificity of 80%. Despite many clinical studies on the differential diagnosis of CD and ITB using clinical features, radiology, endoscopy, histopathology, immunology, M. tuberculosis identification, and serum markers, these methods have drawbacks that result in great difficulty in the differential diagnosis of CD and ITB and high misdiagnosis rates.
In order to overcome obstacles to the differential diagnosis of CD and ITB, ATR-FTIR spectroscopy in the mid-infrared region was adopted in this study as a new method for the differential diagnosis of CD and ITB. In recent years, extensive studies have been conducted on the application of ATR-FTIR spectroscopy for the differential diagnosis of diseases[29-34]. However, one drawback of infrared spectroscopy is that groups with infrared activity are subject to a high degree of collinearity, making it difficult to understand disease progression through changes in the groups. As shown in Figures 7B and 9, the pathological differences between tissues and cells were prone to be obscured by the differences between individual specimens and the noise of instrumentation, with a significant overlap in the distribution of the band position and peak intensity of the ATR-FTIR spectroscopy. Therefore, the differential diagnosis of TB and CD based solely on spectral intensities is subject to large errors and is likely to lead to misdiagnosis. Therefore, to reduce the influence of these factors and extract effective discriminative information, this study, for the first time, proposes a differential diagnosis model for CD and ITB based on the combination of spectral information with machine learning.
XGBoost is a type of machine learning algorithm based on multiple classifiers, with the advantages of fast computation speed, good learning performance, and ability to process large-scale complex data[35]. This algorithm has been widely used in biomedicine[36-38]. The results of this study showed that the differential diagnosis model of CD and ITB based on ATR-FTIR spectral information combined with XGBoost achieved an accuracy rate of up to 91.84%, a significant improvement over previous research results. The high diagnostic accuracy of the XGBoost-based method is mainly due to its ability to differentiate subtle differences in the composition and concentration of the intestinal mucosa by differentiating the differences in the position, intensity, and shape of the characteristic absorption bands in ATR-FTIR spectroscopy. Machine learning can be used to determine the best classification function from these spectral feature differences to obtain satisfactory classification results.
In addition, to eliminate the background interference of the glass substrate and paraffin wax, ATR-FTIR spectroscopy was improved in three ways: (1) Quartz glass was used as the substrate. As shown in Figure 4A, compared with ordinary glass, quartz glass is transparent in the infrared region and does not interfere with the spectral signal of paraffin wax-embedded tissues; (2) The paraffin wax-embedded tissue specimens were dewaxed, and the optimal dewaxing duration was determined. According to a recent study, paraffin wax does not affect ATR-FTIR spectroscopy. However, in this study, paraffin wax seriously interfered with the signals of the intestinal tissues. As shown in Figure 4B, the characteristic absorption bands of paraffin wax were centered at 2956 cm-1, 2916 cm-1, 2848 cm-1, 1461 cm-1, and 719 cm-1. The characteristic absorption of proteins, lipids, and carbohydrates in the mid-infrared region was mainly at 1800 cm-1-600 cm-1 and 3000 cm-1-2500 cm-1. Therefore, the characteristic spectral signals of paraffin wax had a large overlap with the characteristic signals of tissues, causing significant interference in the later spectral analysis. To reduce the spectral signal interference of paraffin wax-embedded tissues, the tissues were subjected to dewaxing treatment, and the dewaxing duration was optimized. These improvements ultimately minimized the influence of paraffin wax (Figures 5 and 6); and (3) The spectra were preprocessed. Converting the original spectra into derivative spectra improved the spectral resolution and reduced noise, thereby increasing the model accuracy from 81.63% to 91.84%.
A differential diagnosis model of CD and ITB based on ATR-FTIR spectral information in the mid-infrared region combined with a machine learning algorithm (XGBoost) was established in this study, aimed at exploring the feasibility of applying ATR-FTIR mid-infrared spectra to the differential diagnosis of CD and ITB. The results showed that the derivative spectra of the ATR-FTIR mid-infrared spectra could not only provide spectral features of CD and ITB but also reveal more differential information for the machine learning algorithm to learn, so that the algorithm could use the spectral features of CD and ITB to achieve classification. The XGBoost model based on ATR-FTIR spectral information showed significant improvements in accuracy, specificity, and sensitivity compared to previous models. The results suggest that owing to the advantages of non-destructiveness, high sensitivity, and the ability for real-time diagnosis, ATR-FTIR mid-infrared spectroscopy technology may serve as a new method for the differential diagnosis of CD and ITB.
Crohn’s disease (CD) is often misdiagnosed as intestinal tuberculosis (ITB). However, the treatment and prognosis of these two diseases are dramatically different. Therefore, it is important to develop a method to identify CD and ITB with high accuracy, specificity, and speed.
Here we present the application of ATR-FTIR Spectroscopy as an easy-to-use method without chemical reagents and label-free diagnostic tool for the identification of CD and ITB.
To develop a method to identify CD and ITB with high accuracy, specificity, and speed.
For the first time the paraffin wax-embedded tissue sections were attached to a metal coating and measured using attenuated total reflectance (ATR) fourier transform infrared (FTIR) spectroscopy at mid-infrared wavelengths combined with XGBoost for differential diagnosis of CD and ITB.
ATR-FTIR spectroscopy combined with XGBoost methods led to a sensitivity of 90.90% (20/22), specificity of 92.59% (25/27), and accuracy of 91.84% (45/49) for differential diagnoses of CD and ITB.
ATR-FTIR spectroscopy combined with XGBoost methods can effectively increase the accuracy of differential diagnosis of CD and ITB.
ATR-FTIR spectroscopy combined with XGBoost methods is expected to become a new method for the differential diagnosis of CD and ITB.
Provenance and peer review: Unsolicited article; Externally peer reviewed.
Peer-review model: Single blind
Specialty type: Gastroenterology and hepatology
Country/Territory of origin: China
Peer-review report’s scientific quality classification
Grade A (Excellent): 0
Grade B (Very good): B
Grade C (Good): C
Grade D (Fair): 0
Grade E (Poor): 0
P-Reviewer: Iizuka M, Japan S-Editor: Chen YL L-Editor: A P-Editor: Yuan YY
| 1. | Baumgart DC, Sandborn WJ. Crohn’s disease. Lancet. 2012;380:1590-1605. [RCA] [PubMed] [DOI] [Full Text] [Cited by in Crossref: 1347] [Cited by in RCA: 1520] [Article Influence: 116.9] [Reference Citation Analysis (0)] |
| 2. | Makharia GK. Rising incidence and prevalence of Crohn’s disease in Asia: is it apparent or real? J Gastroenterol Hepatol. 2006;21:929-931. [RCA] [PubMed] [DOI] [Full Text] [Cited by in Crossref: 23] [Cited by in RCA: 22] [Article Influence: 1.2] [Reference Citation Analysis (0)] |
| 3. | Baumgart DC, Sandborn WJ. Inflammatory bowel disease: clinical aspects and established and evolving therapies. Lancet. 2007;369:1641-1657. [RCA] [PubMed] [DOI] [Full Text] [Cited by in Crossref: 1247] [Cited by in RCA: 1353] [Article Influence: 75.2] [Reference Citation Analysis (0)] |
| 4. | Torres J, Mehandru S, Colombel JF, Peyrin-Biroulet L. Crohn’s disease. Lancet. 2017;389:1741-1755. [RCA] [PubMed] [DOI] [Full Text] [Cited by in Crossref: 1121] [Cited by in RCA: 1784] [Article Influence: 223.0] [Reference Citation Analysis (111)] |
| 5. | Donoghue HD, Holton J. Intestinal tuberculosis. Curr Opin Infect Dis. 2009;22:490-496. [RCA] [PubMed] [DOI] [Full Text] [Cited by in Crossref: 68] [Cited by in RCA: 68] [Article Influence: 4.3] [Reference Citation Analysis (0)] |
| 6. | Almadi MA, Ghosh S, Aljebreen AM. Differentiating intestinal tuberculosis from Crohn’s disease: a diagnostic challenge. Am J Gastroenterol. 2009;104:1003-1012. [RCA] [PubMed] [DOI] [Full Text] [Cited by in Crossref: 140] [Cited by in RCA: 138] [Article Influence: 8.6] [Reference Citation Analysis (0)] |
| 7. | Ma JY, Tong JL, Ran ZH. Intestinal tuberculosis and Crohn’s disease: challenging differential diagnosis. J Dig Dis. 2016;17:155-161. [RCA] [PubMed] [DOI] [Full Text] [Cited by in Crossref: 30] [Cited by in RCA: 44] [Article Influence: 4.9] [Reference Citation Analysis (0)] |
| 8. | Huang X, Liao WD, Yu C, Tu Y, Pan XL, Chen YX, Lv NH, Zhu X. Differences in clinical features of Crohn’s disease and intestinal tuberculosis. World J Gastroenterol. 2015;21:3650-3656. [RCA] [PubMed] [DOI] [Full Text] [Full Text (PDF)] [Cited by in CrossRef: 34] [Cited by in RCA: 32] [Article Influence: 3.2] [Reference Citation Analysis (0)] |
| 9. | Lee YJ, Yang SK, Byeon JS, Myung SJ, Chang HS, Hong SS, Kim KJ, Lee GH, Jung HY, Hong WS, Kim JH, Min YI, Chang SJ, Yu CS. Analysis of colonoscopic findings in the differential diagnosis between intestinal tuberculosis and Crohn’s disease. Endoscopy. 2006;38:592-597. [RCA] [PubMed] [DOI] [Full Text] [Cited by in Crossref: 141] [Cited by in RCA: 139] [Article Influence: 7.3] [Reference Citation Analysis (0)] |
| 10. | Makharia GK, Srivastava S, Das P, Goswami P, Singh U, Tripathi M, Deo V, Aggarwal A, Tiwari RP, Sreenivas V, Gupta SD. Clinical, endoscopic, and histological differentiations between Crohn’s disease and intestinal tuberculosis. Am J Gastroenterol. 2010;105:642-651. [RCA] [PubMed] [DOI] [Full Text] [Cited by in Crossref: 158] [Cited by in RCA: 145] [Article Influence: 9.7] [Reference Citation Analysis (0)] |
| 11. | Lee JM, Lee KM. Endoscopic Diagnosis and Differentiation of Inflammatory Bowel Disease. Clin Endosc. 2016;49:370-375. [RCA] [PubMed] [DOI] [Full Text] [Full Text (PDF)] [Cited by in Crossref: 25] [Cited by in RCA: 32] [Article Influence: 3.6] [Reference Citation Analysis (0)] |
| 12. | Moka P, Ahuja V, Makharia GK. Endoscopic features of gastrointestinal tuberculosis and crohn’s disease. J Dig Endosc. 2017;8:1-11. [RCA] [DOI] [Full Text] [Cited by in Crossref: 13] [Cited by in RCA: 10] [Article Influence: 1.3] [Reference Citation Analysis (0)] |
| 13. | Pratap Mouli V, Munot K, Ananthakrishnan A, Kedia S, Addagalla S, Garg SK, Benjamin J, Singla V, Dhingra R, Tiwari V, Bopanna S, Hutfless S, Makharia G, Ahuja V. Endoscopic and clinical responses to anti-tubercular therapy can differentiate intestinal tuberculosis from Crohn’s disease. Aliment Pharmacol Ther. 2017;45:27-36. [RCA] [PubMed] [DOI] [Full Text] [Cited by in Crossref: 84] [Cited by in RCA: 71] [Article Influence: 8.9] [Reference Citation Analysis (1)] |
| 14. | Magro F, Langner C, Driessen A, Ensari A, Geboes K, Mantzaris GJ, Villanacci V, Becheanu G, Borralho Nunes P, Cathomas G, Fries W, Jouret-Mourin A, Mescoli C, de Petris G, Rubio CA, Shepherd NA, Vieth M, Eliakim R; European Society of Pathology (ESP); European Crohn’s and Colitis Organisation (ECCO). European consensus on the histopathology of inflammatory bowel disease. J Crohns Colitis. 2013;7:827-851. [RCA] [PubMed] [DOI] [Full Text] [Cited by in Crossref: 540] [Cited by in RCA: 466] [Article Influence: 38.8] [Reference Citation Analysis (0)] |
| 15. | Zhao XS, Wang ZT, Wu ZY, Yin QH, Zhong J, Miao F, Yan FH. Differentiation of Crohn’s disease from intestinal tuberculosis by clinical and CT enterographic models. Inflamm Bowel Dis. 2014;20:916-925. [RCA] [PubMed] [DOI] [Full Text] [Cited by in Crossref: 42] [Cited by in RCA: 54] [Article Influence: 4.9] [Reference Citation Analysis (0)] |
| 16. | Park MJ, Lim JS. Computed tomography enterography for evaluation of inflammatory bowel disease. Clin Endosc. 2013;46:327-366. [RCA] [PubMed] [DOI] [Full Text] [Full Text (PDF)] [Cited by in Crossref: 46] [Cited by in RCA: 50] [Article Influence: 4.2] [Reference Citation Analysis (0)] |
| 17. | Pulimood AB, Peter S, Rook GW, Donoghue HD. In situ PCR for Mycobacterium tuberculosis in endoscopic mucosal biopsy specimens of intestinal tuberculosis and Crohn disease. Am J Clin Pathol. 2008;129:846-851. [RCA] [PubMed] [DOI] [Full Text] [Cited by in Crossref: 53] [Cited by in RCA: 52] [Article Influence: 3.1] [Reference Citation Analysis (0)] |
| 18. | Zhang T, Fan R, Wang Z, Hu S, Zhang M, Lin Y, Tang Y, Zhong J. Differential diagnosis between Crohn’s disease and intestinal tuberculosis using integrated parameters including clinical manifestations, T-SPOT, endoscopy and CT enterography. Int J Clin Exp Med. 2015;8:17578-17589. [PubMed] |
| 19. | Abreu C, Afonso J, Camila Dias C, Ruas R, Sarmento A, Magro F. Serial Tuberculosis Screening in Inflammatory Bowel Disease Patients Receiving Anti-TNFα Therapy. J Crohns Colitis. 2017;11:1223-1229. [RCA] [PubMed] [DOI] [Full Text] [Cited by in Crossref: 10] [Cited by in RCA: 10] [Article Influence: 1.3] [Reference Citation Analysis (0)] |
| 20. | Rohman A. The use of infrared spectroscopy in combination with chemometrics for quality control and authentication of edible fats and oils: A review. Appl Spectrosc Rev. 2017;52:589-604. [DOI] [Full Text] |
| 21. | Ding C, Cao XY, Naess P. Applying gradient boosting decision trees to examine non-linear effects of the built environment on driving distance in Oslo. Transp Res Part A Policy Pract. 2018;110:107-17. [DOI] [Full Text] |
| 22. | Chen T. Introduction to boosted trees, University of Washington Computer Science. 2014. [cited 10 January 2024]. Available from: https://web.njit.edu/~usman/courses/cs675_fall16/BoostedTree.pdf. |
| 23. | Gionchetti P, Dignass A, Danese S, Magro Dias FJ, Rogler G, Lakatos PL, Adamina M, Ardizzone S, Buskens CJ, Sebastian S, Laureti S, Sampietro GM, Vucelic B, van der Woude CJ, Barreiro-de Acosta M, Maaser C, Portela F, Vavricka SR, Gomollón F; ECCO. 3rd European Evidence-based Consensus on the Diagnosis and Management of Crohn’s Disease 2016: Part 2: Surgical Management and Special Situations. J Crohns Colitis. 2017;11:135-149. [RCA] [PubMed] [DOI] [Full Text] [Cited by in Crossref: 594] [Cited by in RCA: 529] [Article Influence: 66.1] [Reference Citation Analysis (0)] |
| 24. | Hands JR, Dorling KM, Abel P, Ashton KM, Brodbelt A, Davis C, Dawson T, Jenkinson MD, Lea RW, Walker C, Baker MJ. Attenuated total reflection fourier transform infrared (ATR-FTIR) spectral discrimination of brain tumour severity from serum samples. J Biophotonics. 2014;7:189-199. [RCA] [PubMed] [DOI] [Full Text] [Cited by in Crossref: 100] [Cited by in RCA: 102] [Article Influence: 9.3] [Reference Citation Analysis (0)] |
| 25. | Daperno M, D’Haens G, Van Assche G, Baert F, Bulois P, Maunoury V, Sostegni R, Rocca R, Pera A, Gevers A, Mary JY, Colombel JF, Rutgeerts P. Development and validation of a new, simplified endoscopic activity score for Crohn’s disease: the SES-CD. Gastrointest Endosc. 2004;60:505-512. [RCA] [PubMed] [DOI] [Full Text] [Cited by in Crossref: 999] [Cited by in RCA: 1312] [Article Influence: 62.5] [Reference Citation Analysis (0)] |
| 26. | Ramadass B, Chittaranjan S, Subramanian V, Ramakrishna BS. Fecal polymerase chain reaction for Mycobacterium tuberculosis IS6110 to distinguish Crohn’s disease from intestinal tuberculosis. Indian J Gastroenterol. 2010;29:152-156. [RCA] [PubMed] [DOI] [Full Text] [Cited by in Crossref: 32] [Cited by in RCA: 23] [Article Influence: 1.5] [Reference Citation Analysis (0)] |
| 27. | Li Y, Zhang LF, Liu XQ, Wang L, Wang X, Wang J, Qian JM. The role of in vitro interferonγ-release assay in differentiating intestinal tuberculosis from Crohn’s disease in China. J Crohns Colitis. 2012;6:317-323. [RCA] [PubMed] [DOI] [Full Text] [Cited by in Crossref: 27] [Cited by in RCA: 30] [Article Influence: 2.3] [Reference Citation Analysis (0)] |
| 28. | Kedia S, Sharma R, Nagi B, Mouli VP, Aananthakrishnan A, Dhingra R, Srivastava S, Kurrey L, Ahuja V. Computerized tomography-based predictive model for differentiation of Crohn’s disease from intestinal tuberculosis. Indian J Gastroenterol. 2015;34:135-143. [RCA] [PubMed] [DOI] [Full Text] [Cited by in Crossref: 32] [Cited by in RCA: 36] [Article Influence: 3.6] [Reference Citation Analysis (0)] |
| 29. | Baker MJ, Hussain SR, Lovergne L, Untereiner V, Hughes C, Lukaszewski RA, Thiéfin G, Sockalingum GD. Developing and understanding biofluid vibrational spectroscopy: a critical review. Chem Soc Rev. 2016;45:1803-1818. [RCA] [PubMed] [DOI] [Full Text] [Cited by in Crossref: 190] [Cited by in RCA: 196] [Article Influence: 21.8] [Reference Citation Analysis (0)] |
| 30. | Butler HJ, Smith BR, Fritzsch R, Radhakrishnan P, Palmer DS, Baker MJ. Optimised spectral pre-processing for discrimination of biofluids via ATR-FTIR spectroscopy. Analyst. 2018;143:6121-6134. [RCA] [PubMed] [DOI] [Full Text] [Cited by in Crossref: 25] [Cited by in RCA: 40] [Article Influence: 6.7] [Reference Citation Analysis (0)] |
| 31. | Siqueira LFS, Lima KMG. A decade (2004-2014) of FTIR prostate cancer spectroscopy studies: An overview of recent advancements. Trac-Trend Anal Chem. 2016;82:208-21. [RCA] [DOI] [Full Text] [Cited by in Crossref: 14] [Cited by in RCA: 17] [Article Influence: 1.9] [Reference Citation Analysis (0)] |
| 32. | Paraskevaidi M, Morais CLM, Lima KMG, Snowden JS, Saxon JA, Richardson AMT, Jones M, Mann DMA, Allsop D, Martin-Hirsch PL, Martin FL. Differential diagnosis of Alzheimer’s disease using spectrochemical analysis of blood. Proc Natl Acad Sci U S A. 2017;114:E7929-E7938. [RCA] [PubMed] [DOI] [Full Text] [Cited by in Crossref: 91] [Cited by in RCA: 114] [Article Influence: 14.3] [Reference Citation Analysis (0)] |
| 33. | Paraskevaidi M, Morais CLM, Lima KMG, Ashton KM, Stringfellow HF, Martin-Hirsch PL, Martin FL. Potential of mid-infrared spectroscopy as a non-invasive diagnostic test in urine for endometrial or ovarian cancer. Analyst. 2018;143:3156-3163. [RCA] [PubMed] [DOI] [Full Text] [Cited by in Crossref: 38] [Cited by in RCA: 57] [Article Influence: 9.5] [Reference Citation Analysis (0)] |
| 34. | De Bruyne S, Speeckaert R, Boelens J, Hayette MP, Speeckaert M, Delanghe J. Infrared spectroscopy as a novel tool to diagnose onychomycosis. Br J Dermatol. 2019;180:637-646. [RCA] [PubMed] [DOI] [Full Text] [Cited by in Crossref: 12] [Cited by in RCA: 12] [Article Influence: 1.7] [Reference Citation Analysis (0)] |
| 35. | Chen TQ, Guestrin C. XGBoost: A Scalable Tree Boosting System. Data Min Knowl Disc. 2016;785-794. [RCA] [DOI] [Full Text] [Cited by in Crossref: 12755] [Cited by in RCA: 7893] [Article Influence: 877.0] [Reference Citation Analysis (1)] |
| 36. | Li YY, Bingham A, Li QJ, Zhuang Y, Umbach DM, Li LP. Using tumor sample gene expression data to infer tumor purity levels with stochastic gradient boosting machines. Cancer Res. 2018;78. [RCA] [DOI] [Full Text] [Reference Citation Analysis (0)] |
| 37. | Ogunleye A, Wang QG. Enhanced XGBoost-Based Automatic Diagnosis System for Chronic Kidney Disease. ICCA. 2018;805-810. [DOI] [Full Text] |
| 38. | Torlay L, Perrone-Bertolotti M, Thomas E, Baciu M. Machine learning-XGBoost analysis of language networks to classify patients with epilepsy. Brain Inform. 2017;4:159-169. [RCA] [PubMed] [DOI] [Full Text] [Full Text (PDF)] [Cited by in Crossref: 203] [Cited by in RCA: 189] [Article Influence: 23.6] [Reference Citation Analysis (0)] |