Copyright
©The Author(s) 2020.
World J Gastroenterol. Sep 21, 2020; 26(35): 5314-5327
Published online Sep 21, 2020. doi: 10.3748/wjg.v26.i35.5314
Published online Sep 21, 2020. doi: 10.3748/wjg.v26.i35.5314
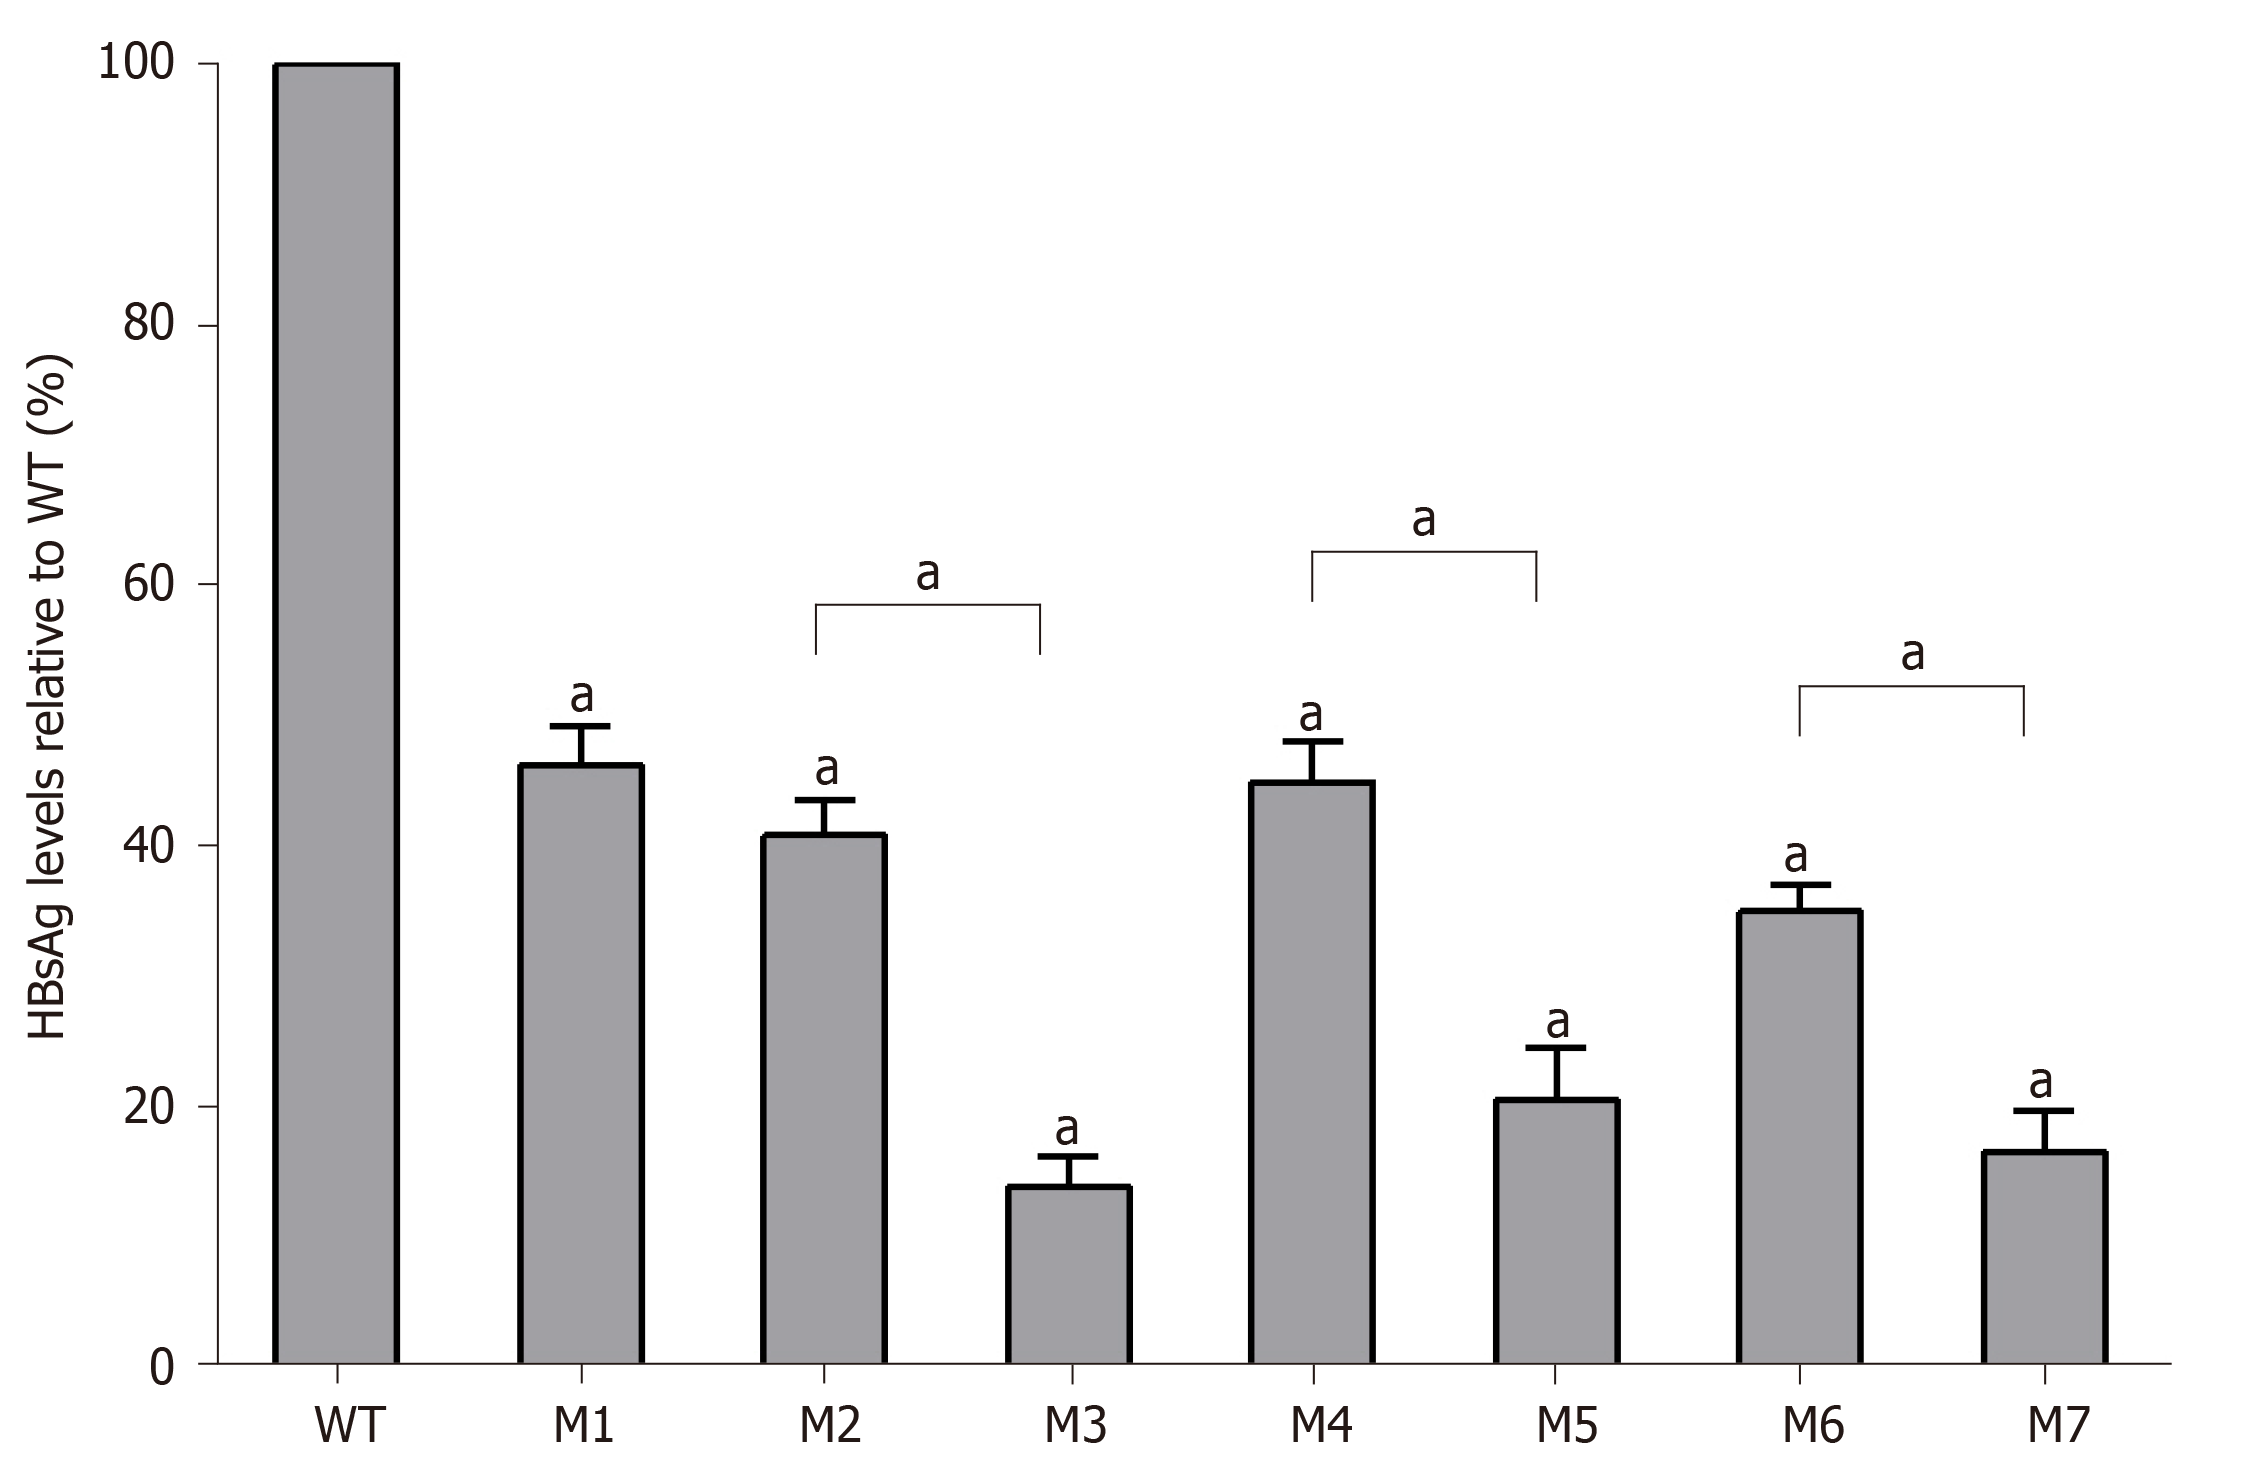
Figure 3 Quantitative analysis of hepatitis B surface antigen levels in individual viral vector-transfected human hepatocellular carcinoma cells.
Relative values (%) of mutant hepatitis B surface antigen levels vs wild-type levels are shown. Data are expressed as means ± standard deviations. M1, sA159V; M2, rtM204I; M3, sA159V+rtM204I; M4, rtL180M+rtM204V; M5, sA159V+rtL180M+rtM204V; M6, rtL180M+rtT184L+rtM204V; M7,sA159V+rtL180M+rtT184L+rtM204V. aP < 0.05 (mutant vs wild-type or other indicated mutant).
- Citation: Huang BX, Liu Y, Fan ZP, Si LL, Chen RJ, Wang J, Luo D, Wang FS, Xu DP, Liu XG. Investigation of immune escape-associated mutations of hepatitis B virus in patients harboring hepatitis B virus drug-resistance mutations. World J Gastroenterol 2020; 26(35): 5314-5327
- URL: https://www.wjgnet.com/1007-9327/full/v26/i35/5314.htm
- DOI: https://dx.doi.org/10.3748/wjg.v26.i35.5314


