Copyright
©The Author(s) 2020.
World J Gastroenterol. May 28, 2020; 26(20): 2584-2598
Published online May 28, 2020. doi: 10.3748/wjg.v26.i20.2584
Published online May 28, 2020. doi: 10.3748/wjg.v26.i20.2584
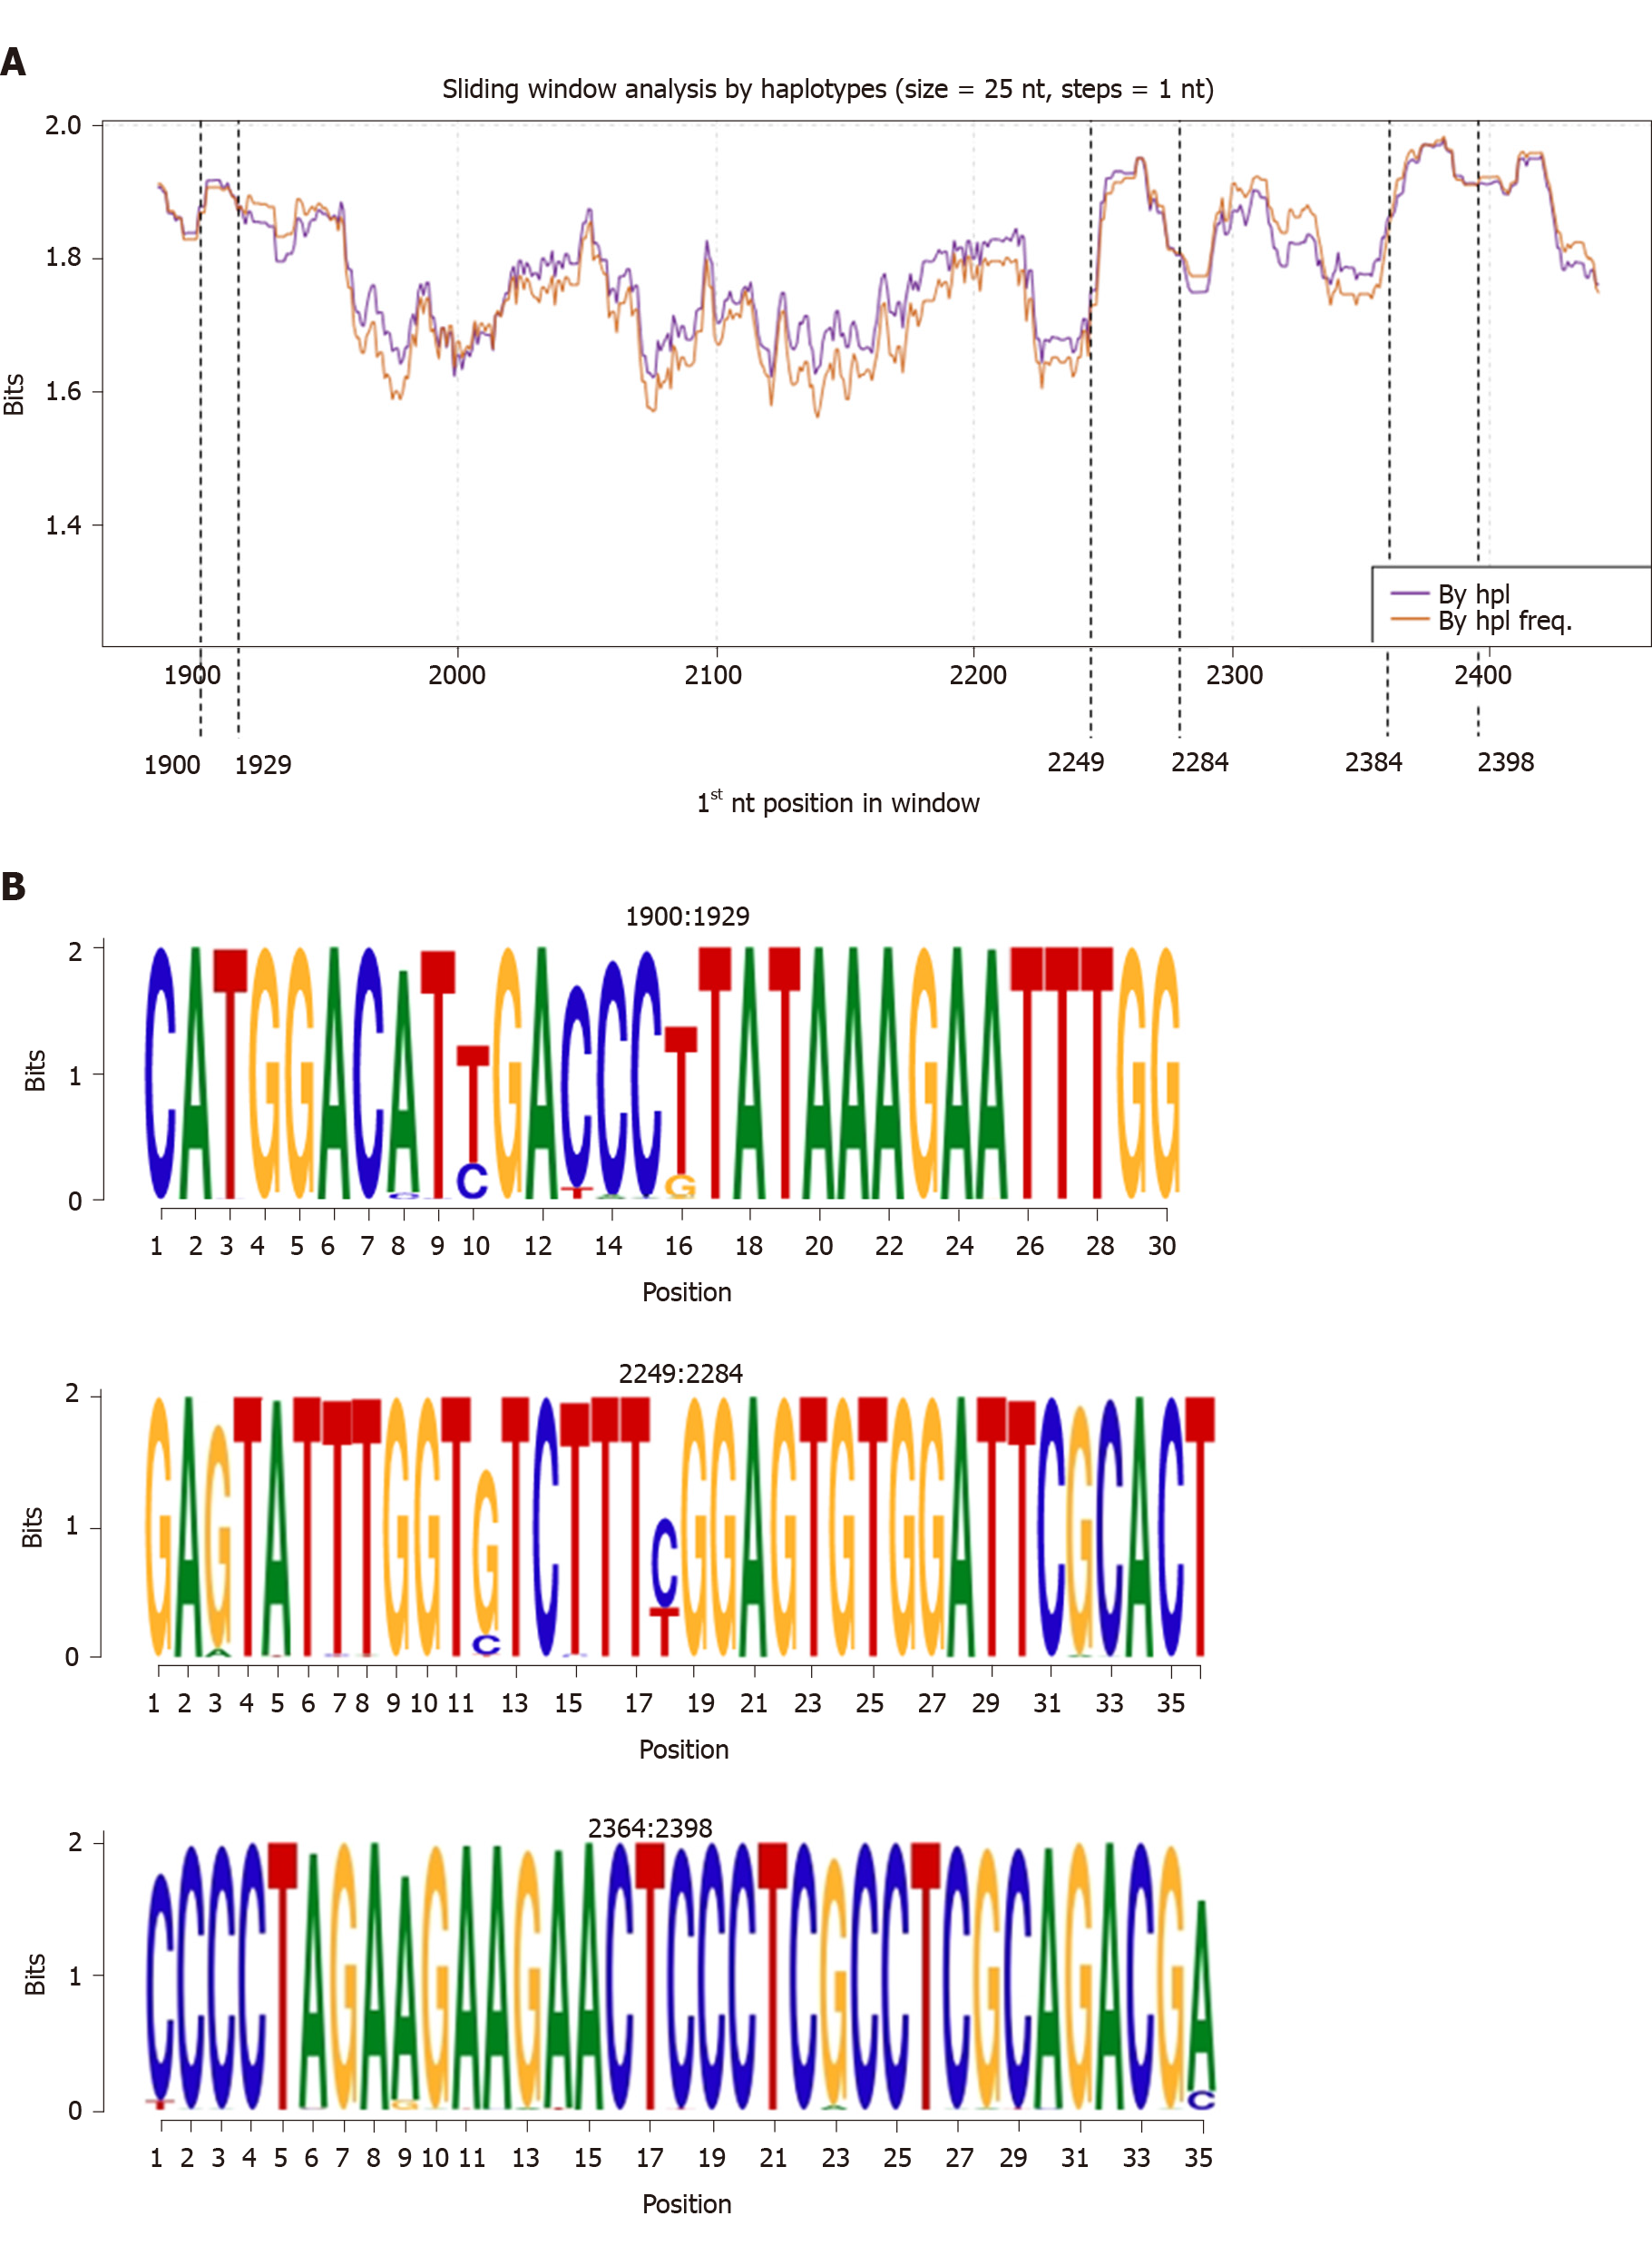
Figure 2 Information content analysis at nucleotide level.
A: Sliding window analysis of Hepatitis B core gene performed by aligning the quasispecies haplotypes for all 38 patients with and without considering their relative frequency. Each point on the graph represents the mean information content (in bits) of the 25-nucleotides windows, with forward displacement of 1 nucleotide step between windows. The purple line shows the analysis by haplotype (By hpl), which is the mean information content obtained from the multiple alignments of all quasispecies haplotypes. The orange line represents the analysis by haplotype frequency (By hpl freq), which is the mean information content from the multiple alignments of all the patients’ quasispecies haplotypes considering their relative frequency. The dashed lines indicate the 3 common hyper-conserved regions observed, with reporting of their positions. B: Representation of detected hyper-conserved regions as sequence logos (with reporting of nucleotide positions). The relative sizes of the letters in each stack indicate their relative frequencies at each position within the multiple alignments of nucleotide haplotypes. The total height of each stack of letters depicts the information content of each nucleotide position, measured in bits (Y-axis): from minimum (0) to maximum conservation (2). By hpl: Analysis by haplotype; By hpl freq: Analysis by haplotype frequency; nt: Nucleotide.
- Citation: Yll M, Cortese MF, Guerrero-Murillo M, Orriols G, Gregori J, Casillas R, González C, Sopena S, Godoy C, Vila M, Tabernero D, Quer J, Rando A, Lopez-Martinez R, Esteban R, Riveiro-Barciela M, Buti M, Rodríguez-Frías F. Conservation and variability of hepatitis B core at different chronic hepatitis stages. World J Gastroenterol 2020; 26(20): 2584-2598
- URL: https://www.wjgnet.com/1007-9327/full/v26/i20/2584.htm
- DOI: https://dx.doi.org/10.3748/wjg.v26.i20.2584


