Copyright
©The Author(s) 2017.
World J Gastroenterol. Jul 21, 2017; 23(27): 4897-4909
Published online Jul 21, 2017. doi: 10.3748/wjg.v23.i27.4897
Published online Jul 21, 2017. doi: 10.3748/wjg.v23.i27.4897
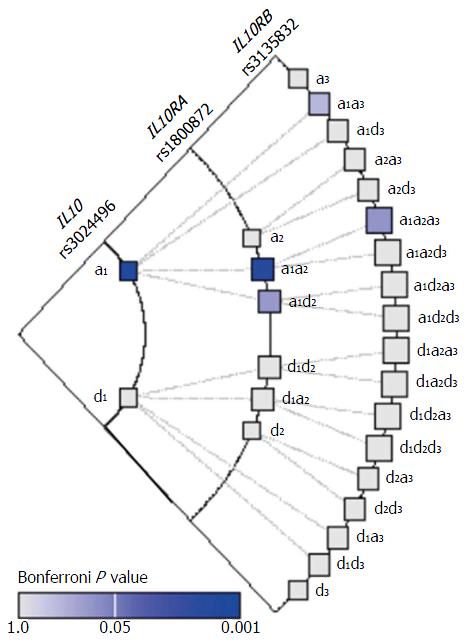
Figure 3 Epistatic interaction of two IL-10 single nucleotide polymorphisms, rs1800872 and rs3024496, with IL10RA, IL10RB, STAT3 and HO1 in pediatric inflammatory bowel disease.
Graphic depiction of epistatic interaction of the IL-10 SNPs rs3024496 and rs1800872 with the IL10RA rs3135932. All the interaction models analyzed for the IL-10 SNPs rs3024496 and rs1800872 with the IL10RA rs3135932 are shown. However, only one significant interaction model additive-additive-additive (a1a2a3) was observed (P = 0.003, Bp = 0.099). Levels of Bp values are shown in the bar as shades of blue color from none (Bp = 1) to high (Bp = 0.001). a1, d1, a2, d2, a3, d3: Letters, a and d, are for interaction model additive and dominant respectively; Numbers 1, 2, and 3 depict the IL-10 rs3024496, IL-10 rs1800872, and IL10RA rs3135932 respectively. The contribution of a single SNP in an interaction model could be either a or d (a1 and d1 for SNP #1, a2 and d2 for SNP #2, and a3 and d3 for SNP #3). The interaction models for two and three SNPs are the combination of the two and three SNPs; such as, a1a2 for SNPs 1 and 2, and a1a2a3 for SNPs 1, 2, and 3. Bp: Bonferroni P value; SNPs: Single nucleotide polymorphisms.
- Citation: Lin Z, Wang Z, Hegarty JP, Lin TR, Wang Y, Deiling S, Wu R, Thomas NJ, Floros J. Genetic association and epistatic interaction of the interleukin-10 signaling pathway in pediatric inflammatory bowel disease. World J Gastroenterol 2017; 23(27): 4897-4909
- URL: https://www.wjgnet.com/1007-9327/full/v23/i27/4897.htm
- DOI: https://dx.doi.org/10.3748/wjg.v23.i27.4897


