Copyright
©The Author(s) 2016.
World J Gastroenterol. Apr 21, 2016; 22(15): 3978-3991
Published online Apr 21, 2016. doi: 10.3748/wjg.v22.i15.3978
Published online Apr 21, 2016. doi: 10.3748/wjg.v22.i15.3978
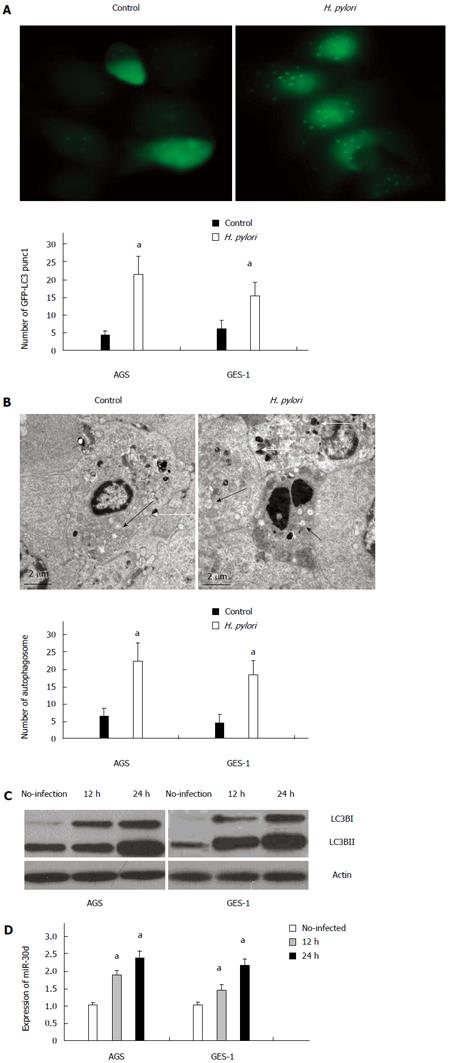
Figure 1 Autophagy and mir-30d are upregulated in AGS and GES-1 cell lines in response to Helicobacter pylori infection.
A: GFP-LC3 puncta were observed in AGS cells with or without 24 h Helicobacter pylori (H. pylori) infection. Quantification of the number of GFP-LC3 puncta in AGS and GES-1 cells presented as mean ± SD, aP < 0.05 control vs H. pylori infection; B: The autophagosomes and autophagolysosomes at 24 h after H. pylori infection assayed by transmission emission microscopy (TEM), shown are a typical autophagosome (black arrowheads) and autophagolysosome (white arrowheads). Quantification of GFP-LC3 puncta in AGS and GES-1 cells shown as mean ± SD, aP < 0.05 vs control; C: The protein levels of light chain (LC)3B-I and LC3B-II at 12 h and 24 h after infection with H. pylori analyzed by western blot; D: Analysis of the expression of mir-30d at 12 h and 24 h after infection with H. pylori in both cell lines by quantitative polymerase chain reaction (q-PCR). Results shown as mean ± SD, aP < 0.05 vs control.
- Citation: Yang XJ, Si RH, Liang YH, Ma BQ, Jiang ZB, Wang B, Gao P. Mir-30d increases intracellular survival of Helicobacter pylori through inhibition of autophagy pathway. World J Gastroenterol 2016; 22(15): 3978-3991
- URL: https://www.wjgnet.com/1007-9327/full/v22/i15/3978.htm
- DOI: https://dx.doi.org/10.3748/wjg.v22.i15.3978


