Copyright
©The Author(s) 2015.
World J Gastroenterol. Jun 7, 2015; 21(21): 6604-6612
Published online Jun 7, 2015. doi: 10.3748/wjg.v21.i21.6604
Published online Jun 7, 2015. doi: 10.3748/wjg.v21.i21.6604
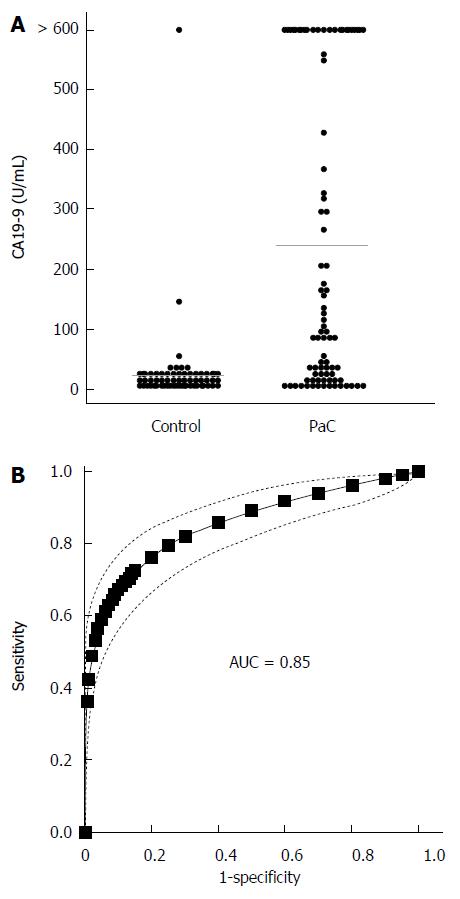
Figure 5 CA19-9 levels.
A: Beeswarm scatter plot of CA19-9 levels in controls and PaC patients. Grey lines indicate median levels; B: ROC curve based on CA19-9 levels; Dotted lines indicate the 95%CI.
- Citation: Ritchie SA, Chitou B, Zheng Q, Jayasinghe D, Jin W, Mochizuki A, Goodenowe DB. Pancreatic cancer serum biomarker PC-594: Diagnostic performance and comparison to CA19-9. World J Gastroenterol 2015; 21(21): 6604-6612
- URL: https://www.wjgnet.com/1007-9327/full/v21/i21/6604.htm
- DOI: https://dx.doi.org/10.3748/wjg.v21.i21.6604


