Copyright
©2014 Baishideng Publishing Group Inc.
World J Gastroenterol. Oct 28, 2014; 20(40): 14904-14912
Published online Oct 28, 2014. doi: 10.3748/wjg.v20.i40.14904
Published online Oct 28, 2014. doi: 10.3748/wjg.v20.i40.14904
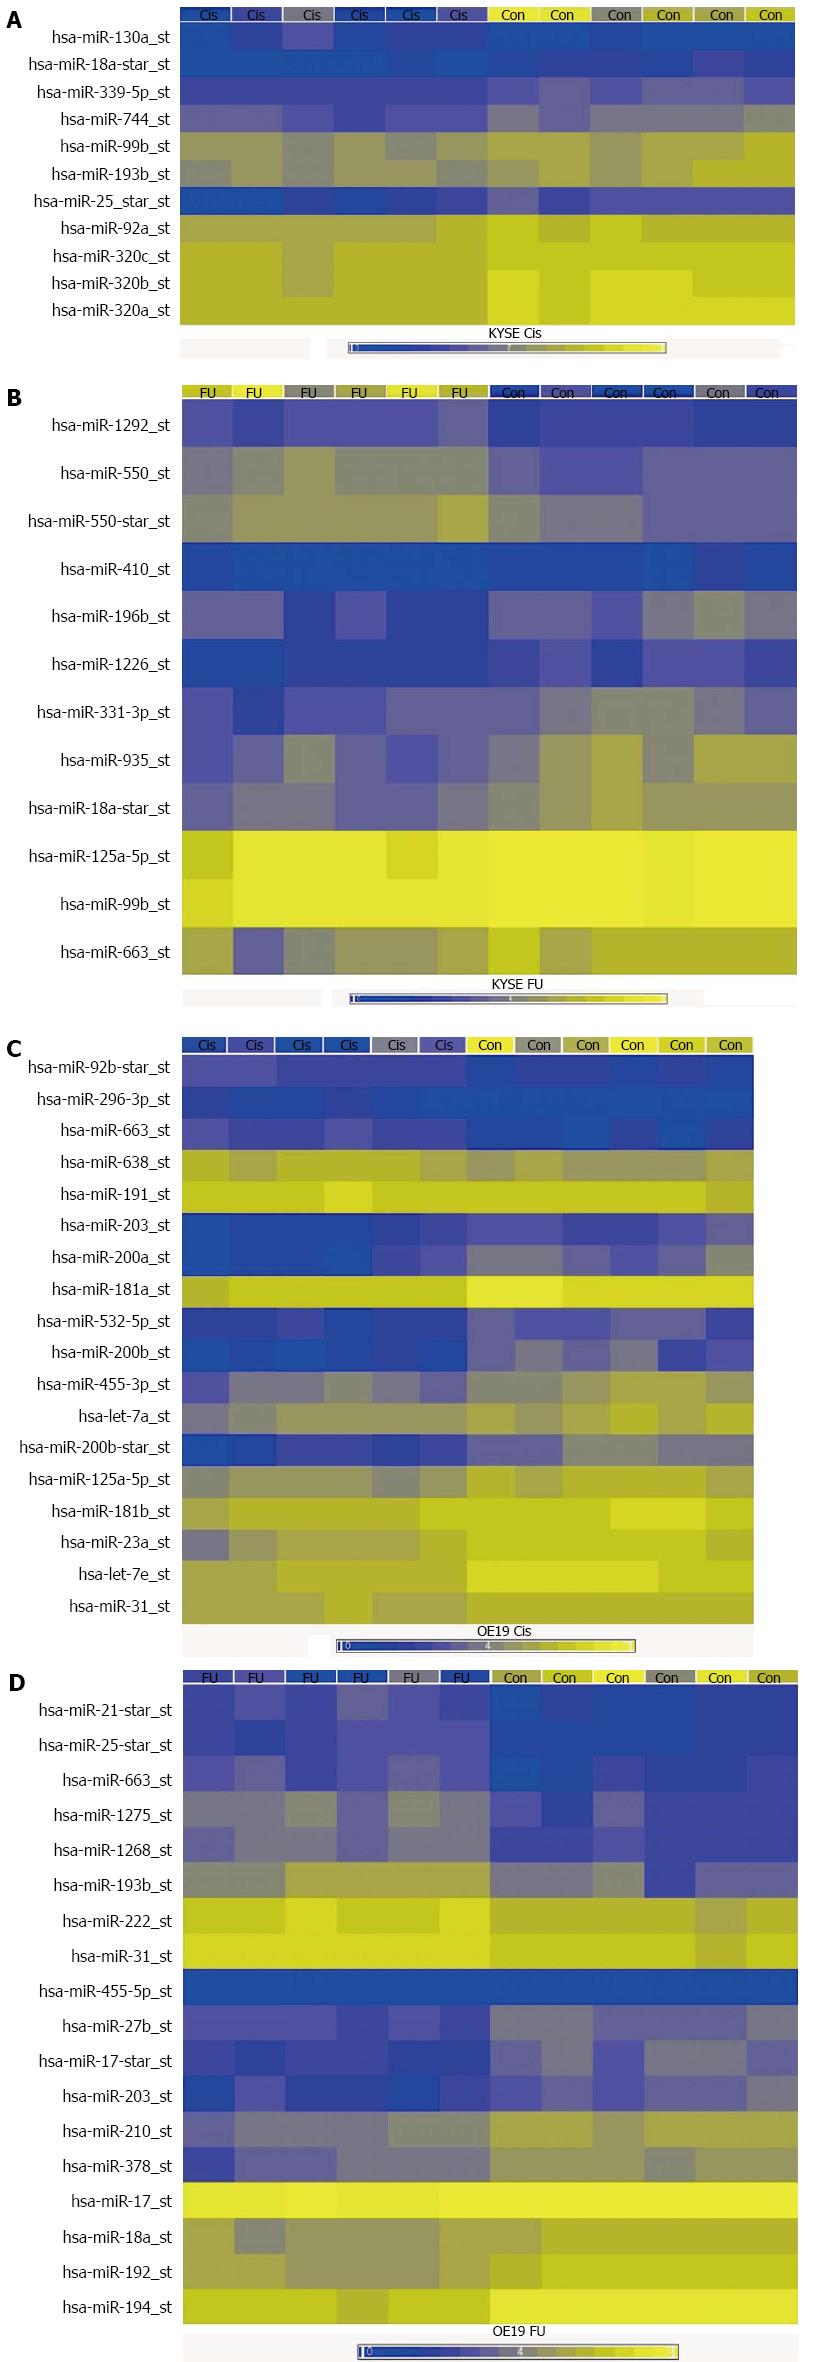
Figure 1 Microarray results.
The figure summarises the miRNA microarray results in the different resistant cell lines, showing the comparison of miRNA expression between 6 replicate experiments and controls for each resistant cell line. A: Cisplatin resistant esophageal adeno- (EAC) and squamous cell carcinoma (ESCC) cells vs chemotherapy sensitive controls; B: 5-FU resistant ESCC cells vs chemotherapy sensitive controls; C: Cisplatin resistant EAC cells vs chemotherapy sensitive controls; D: 5-FU resistant EAC cells vs chemotherapy sensitive controls. Cis: Cisplatin resistant cells; FU: 5-FU resistant cells; Con: Sensitive control cells.
- Citation: Hummel R, Sie C, Watson DI, Wang T, Ansar A, Michael MZ, Hoek MVD, Haier J, Hussey DJ. MicroRNA signatures in chemotherapy resistant esophageal cancer cell lines. World J Gastroenterol 2014; 20(40): 14904-14912
- URL: https://www.wjgnet.com/1007-9327/full/v20/i40/14904.htm
- DOI: https://dx.doi.org/10.3748/wjg.v20.i40.14904


