Copyright
©2012 Baishideng Publishing Group Co.
World J Gastroenterol. Jan 14, 2012; 18(2): 168-174
Published online Jan 14, 2012. doi: 10.3748/wjg.v18.i2.168
Published online Jan 14, 2012. doi: 10.3748/wjg.v18.i2.168
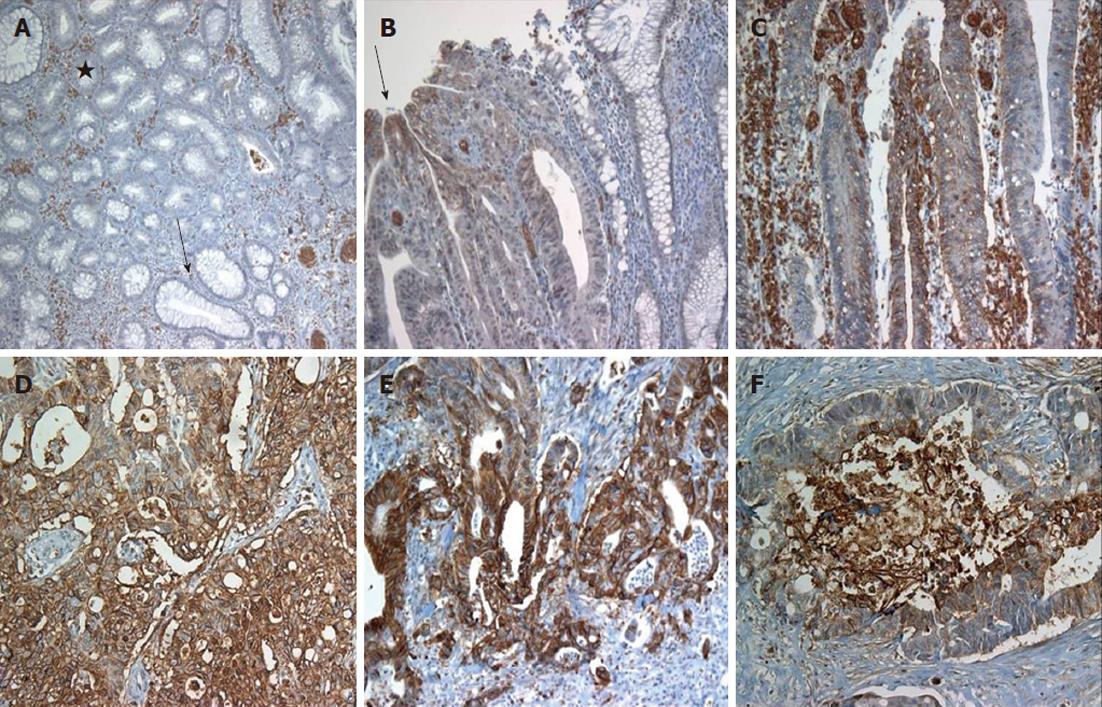
Figure 1 Glucose transporter 1 expression in normal colonic epithelium, adenomas and adenocarcinomas.
A: No glucose transporter 1 (GLUT1) expression in tubular adenoma (star) and normal epithelium (arrow), while immunostaining in erythrocytes; B and C: GLUT1 immunostaining in the villous adenoma (B, arrow: Expression at the tip of villous frond); D: Colorectal adenocarcinoma with strong GLUT1 expression; E and F: More strong expression at the infiltrative border (E) and necrotic center (F).
- Citation: Hong R, Lim SC. 18F-fluoro-2-deoxyglucose uptake on PET CT and glucose transporter 1 expression in colorectal adenocarcinoma. World J Gastroenterol 2012; 18(2): 168-174
- URL: https://www.wjgnet.com/1007-9327/full/v18/i2/168.htm
- DOI: https://dx.doi.org/10.3748/wjg.v18.i2.168


