Published online May 14, 2010. doi: 10.3748/wjg.v16.i18.2291
Revised: January 14, 2010
Accepted: January 21, 2010
Published online: May 14, 2010
AIM: To establish a multidrug-resistant hepatoma cell line (SK-Hep-1), and to investigate its biological characteristics.
METHODS: A highly invasive SK-Hep-1 cell line of human hepatocellular carcinoma, also known as malignant hepatoma was incubated with a high concentration of cisplatin (CDDP) to establish a CDDP-resistant cell subline (SK-Hep-1/CDDP). The 50% inhibitory dose (IC50) values and the resistance indexes [(IC50 SK-Hep-1/CDDP)/(IC50 SK-Hep-1)] for other chemotherapeutic agents and the growth curve of cells were all evaluated using cell counting kit-8 assays. The distribution of the cell cycles were detected by flow cytometry. Expression of acquired multidrug resistance P-glycoprotein (MDR1, ABCB1) and multidrug resistance-associated protein 1 (MRP1, ABCC1) was compared with that in parent cells by Western blotting and immunofluorescence combined with laser scanning confocal microscopy.
RESULTS: The SK-Hep-1/CDDP cells (IC50 = 70.61 ± 1.06 μg/mL) was 13.76 times more resistant to CDDP than the SK-Hep-1 cells (IC50 = 5.13 ± 0.09 μg/mL), and CDDP-resistant cells also demonstrated cross-resistance to many anti-tumor agents such as doxorubicin, 5-fluorouracil and vincristine. Similar morphologies were determined in both SK-Hep-1 and SK-Hep-1/CDDP groups. The cell cycle distribution of the SK-Hep-1/CDDP cell line exhibited a significantly increased percentage of cells in S (42.2% ± 2.65% vs 27.91% ± 2.16%, P < 0.01) and G2/M (20.67% ± 5.69% vs 12.14% ± 3.36%, P < 0.01) phases in comparison with SK-Hep-1 cells, while the percentage of cells in the G0/G1 phase decreased (37.5% ± 5.05% vs 59.83% ± 3.28%, P < 0.01). The levels of MDR1 and MRP1 were overexpressed in the SK-Hep-1/CDDP cells exhibiting the MDR phenotype.
CONCLUSION: Multiple drug resistance of multiple drugs in the human hepatoma cell line SK-Hep-1/CDDP was closely related to the overexpression of MDR1 and MRP1.
-
Citation: Zhou Y, Ling XL, Li SW, Li XQ, Yan B. Establishment of a human hepatoma multidrug resistant cell line
in vitro . World J Gastroenterol 2010; 16(18): 2291-2297 - URL: https://www.wjgnet.com/1007-9327/full/v16/i18/2291.htm
- DOI: https://dx.doi.org/10.3748/wjg.v16.i18.2291
Multidrug resistance (MDR)[1] is a major obstacle in the chemotherapy of cancer patients and is also one of the reasons for tumor relapse and metastasis. Hepatocellular carcinoma (HCC) is one of the most common gastrointestinal tumors worldwide, accounting for 70%-90% of primary liver cancers[2], with a high degree of malignancy and poor prognosis. A majority of patients are surgically unresectable at the time of diagnosis, and even for those where surgery is possible, the risk of recurrence is extremely high. Consequently, chemotherapy is an important treatment for most HCC patients. However, HCC responds poorly to chemotherapy owing to acquired MDR[3,4]. The ability to overcome this MDR is a major concern in clinical oncology in successfully treating HCC[5].
Cisplatin (CDDP) is a key drug that is widely used for cancer chemotherapy, but the effectiveness of CDDP for HCC is unsatisfactory because of MDR. To elucidate the CDDP-resistant mechanism in HCC in vitro, we established a CDDP-resistant SK-Hep-1 cell line and analyzed its biological behavior.
CDDP, doxorubicin (DOX), penicillin, streptomycin, propidium iodide (PI) and RNase A were obtained from the Sigma-Aldrich Chemical Co (St.Louis, MO, USA). Vincristine (VCR) was obtained from Shenzhen Main Luck Pharmaceuticals Inc. (Shenzhen, China). 5-fluorouracil (5-FU) was obtained from Shanghai Xudong Haipu Pharmaceutical Co. Ltd (Shanghai, China). Dulbecco’s modified Eagle’s medium/high glucose (DMEM/H), fetal bovine serum (FBS) and Trypsin were purchased from Invitrogen (Carlsbad, CA, USA). The phospho-glycoprotein (P-gp, MDR1) mouse monoclonal antibody, multidrug resistance-associated protein 1 (MRP1)-specific mouse anti-human antibody and FITC-conjugated goat anti-mouse IgG were obtained from Santa Cruz Biotechnology (Santa Cruz, CA, USA). MitoTracker Red CMXRos dye purchased from Invitrogen (Molecular Probes, Invitrogen Corp.). Cell Counting Kit-8 (CCK-8) was obtained from Dojindo Molecular Technologies (Dojindo, Japan). The cell culture supplies were purchased from Corning Life Sciences (Lowell, MA, USA). Anti-tumor agents were prepared extemporaneously in complete culture medium immediately prior to use in vitro.
The human hepatoma cell line, SK-Hep-1, was obtained from the Cell Culture Center, Institute of Basic Medical Sciences within the Chinese Academy of Medical Sciences. SK-Hep-1 cells were cultured in DMEM/H containing 10% (v/v) FBS, penicillin (200 U/mL), streptomycin (100 μg/mL), and were incubated at 37°C in a humidified incubator with an atmosphere of 50 mL/L CO2.
SK-Hep-1/CDDP was produced by exposing SK-Hep-1 cells to CDDP repeatedly at a single high concentration over a period of 24 h. Briefly, SK-Hep-1/CDDP was selected by a procedure consisting of 6 pulse drug treatments with 5 μg/mL CDDP, with SK-Hep-1 cells (1 × 10⁶) plated onto a 25 cm2 culture flask in each pulse treatment. When cells were growing exponentially, they were exposed to CDDP for 24 h. The majority of the cells were dead following 24 h exposure to CDDP. The treated cells were then washed with 0.01 mol/L phosphate-buffered saline (PBS) and cultured in CDDP-free growth medium. After 1-2 d, the dead cells were washed out with PBS and fresh medium again added. The resistant subclones were isolated by limiting dilution. After 4 weeks’ incubation at 37°C in a humidified incubator containing 50 mL/L CO2, the cells recovered at an exponential rate and were then subcultured at a density of 1 × 10⁶ cells/25 cm2 flasks. Once cells reached 60%-70% confluence, the cells were preserved for further study as described above. The CDDP-resistant subclone was established 6 mo after the treatment was initiated, then the resistant phenotype developed. For maintenance of CDDP-resistant cells, the SK-Hep-1/CDDP cells were grown in the presence of 0.01 μg/mL CDDP. Before experimentation, SK-Hep-1/CDDP cells were maintained in a CDDP-free culture medium and subcultured at least 3 times. The MDR characteristics of these SK-Hep-1/CDDP cells were tested using various concentrations of anticancer drugs including CDDP, DOX, VCR and 5-FU.
Cell proliferation assays were performed with CCK-8 according to the manufacturer’s instructions. Cells (2 × 10³) were seeded into each well of a 96-well plate and cultured in 100 μL of DMEM/H supplemented with 10% FBS. At the indicated time points, medium was exchanged for 110 μL of DMEM/H with CCK-8 reagent (10 μL CCK-8 and 100 μL DMEM/H), and the cells were incubated for 2 h. Absorbance was measured for each well at a wavelength of 450 nm, with the reference wavelength set at 600 nm. An increase or decrease in absorbance values at 450 nm in the experimental wells relative to the initial value indicated cell growth or death, respectively. Cell growth was monitored every 24 h over 5 d, and was repeated in 6 wells. All assays were carried out independently in triplicate.
The effects of chemotherapeutic agents on the growth of SK-Hep-1 and SK-Hep-1/CDDP cells were also evaluated with CCK-8. Cells (2 × 10³/well) were seeded into 96-well plates in 100 μL of DMEM/H with 10% FBS incubated at 37°C in a humidified atmosphere containing 50 mL/L CO2. After 24 h the medium was aspirated, and exchanged with media containing a test chemotherapeutic agent at various concentrations. After incubation for 24 h at 37°C, the drug-containing growth medium was replaced with 110 μL medium containing CCK-8 reagent. After 2 h, the absorbance was read at 450 nm with a reference wavelength at 600 nm. Six wells were used for each drug concentration and the experiment was replicated 3 times. The IC50 was calculated by SPSS13.0 (SPSS Inc., Chicago, IL, USA). The lower the IC50 value, the higher the potency against cell proliferation.
Control and CDDP-resistant cells were harvested, washed twice with ice-cold PBS (pH 7.2) and fixed in ethanol:PBS (9:1) at -20°C for at least 30 min. The fixed cells were then washed twice with ice-cold PBS and stained with 50 mg/mL PI in the presence of 25 mg/mL RNase A. Cell cycle phase distribution was analyzed in 3 different experiments using a COULTER® EPICS™ XL™ flow cytometer (Beckman Coulter Inc., Brea, CA, USA). Data from 50 000 events/sample were collected and analyzed using CellQuest software (BD Biosciences, San Jose, CA, USA).
For immunofluorescence, cells were grown on glass slides in 6-well culture plates. Two days later, MitoTracker Red in DMEM/H (200 nmol/L) was added to live cells for 30 min at 37°C, and washed twice with ice-cold PBS (0.01 mol/L, pH 7.2). The cells were fixed for 30 min in 4% ice-cold paraformaldehyde followed by permeabilization with 0.3 mg/mL Triton X-100 for 30 min at room temperature. Fixed, permeabilized cells were washed twice with 0.01 mol/L PBS and incubated with blocking buffer containing goat serum for 30 min at room temperature. Cells were washed twice with 0.01 mol/L PBS again and the expression of MDR1 was determined using the mouse monoclonal anti-P-gp antibody (1:100), Expression of MRP1 was determined using the mouse monoclonal anti-MRP1 antibody (1:100). Negative controls for immunofluorescence involved replacing the primary antibodies with an IgG isotype control. The primary antibody incubations were carried out in blocking buffer overnight at 4°C. After incubation with primary antibodies, cells were washed 3 times with 0.01 mol/L PBS, and incubated with secondary FITC-conjugated goat anti-mouse antibody (1:50) in the dark for 1.5 h at 37°C. Cell nuclei were counterstained with DAPI (4,6-diamidino-2-phenylindole; Sigma-Aldrich, St. Louis, MO, USA) solution (1 μg/mL in PBS) for 5 min at room temperature. After washing with 0.01 mol/L PBS, cells were mounted on glass slides using Antifade Mounting Medium (Beyotime Institute of Biotechnology, Jiangsu, China). Confocal laser scanning microscopic analysis of immunolabeling was performed on a Leica TCS SP2 confocal laser imaging system (Leica Microsystems, Wetzlar, Germany). To ascertain localization of the mitochondria, cells were stained with MitoTracker Red CMXRos dye. A merged double image of green MDR1 or MRP1 and MitoTracker Red was obtained. To allow quantitative comparisons of the relative fluorescence intensity of cells between groups, cells were chosen on a random basis and scanned at more than 3 points for analysis. Software Image-Pro Plus Version 6.0 (MediaCybernetics, Bethesda, MD, USA) was used to count the mean value of the fluorescence intensity. Average green fluorescence intensity per cell was determined as the quantity of P-gp or MRP1 protein expression.
Total protein was collected from cultured SK-Hep-1 and SK-Hep-1/CDDP cells and the concentration was measured using a BCA Protein Assay Kit (Beyotime Institute of Biotechnology, Jiangsu, China). The protein was denatured in lithium dodecyl sulfate (LDS) sample buffer (106 mmol/L Tris-HCl, 141 mmol/L Tris base pH 8.5, 0.51 mmol/L EDTA, 10% glycerol, 2% LDS, 0.22 mmol/L SERVA blue G250, 0.175 mmol/L phenol red, 0.1 mmol/L 2-mercaptoethanol) for 5 min at 95°C, electrophoresed on a 7.5% SDS-PAGE and blotted onto 0.2 μm PVDF membranes (Roche, Indianapolis, IN, USA). Membranes were blocked with 5% (w/v) dry milk in TBS-T (Tris-buffered saline containing 0.05% Tween 20) for 1 h at room temperature and incubated overnight at 4°C with antibodies against P-gp (1:500) or MRP1 (1:100). After incubation with the respective primary antibodies, the membranes were washed 3 times for 5 min in TBS containing 0.05% Tween-20, and then the membranes were exposed to species-specific horseradish peroxidase-labeled secondary antibodies (ZhongShan Goldenbridge Biotechnology, Beijing, China) at 37°C for 1 h, and developed using the ECL plus Western blotting reagent with visualization on X-ray films. The expression of β-actin was detected as an internal control. The band intensity on X-ray films was quantified using Gel-Pro Analyzer software. The ratio of the band intensity for P-gp/β-actin and MRP1/β-actin was used as the relative expression level for P-gp and MRP1 protein, respectively.
All experiments were run in triplicate, and the results are given as mean ± SD. Statistical analyses were performed using either an analysis of variance (ANOVA) or Student t test. The difference was considered statistically significant when the P value was less than 0.05. All statistical analyses were carried out with SPSS 13.0 software.
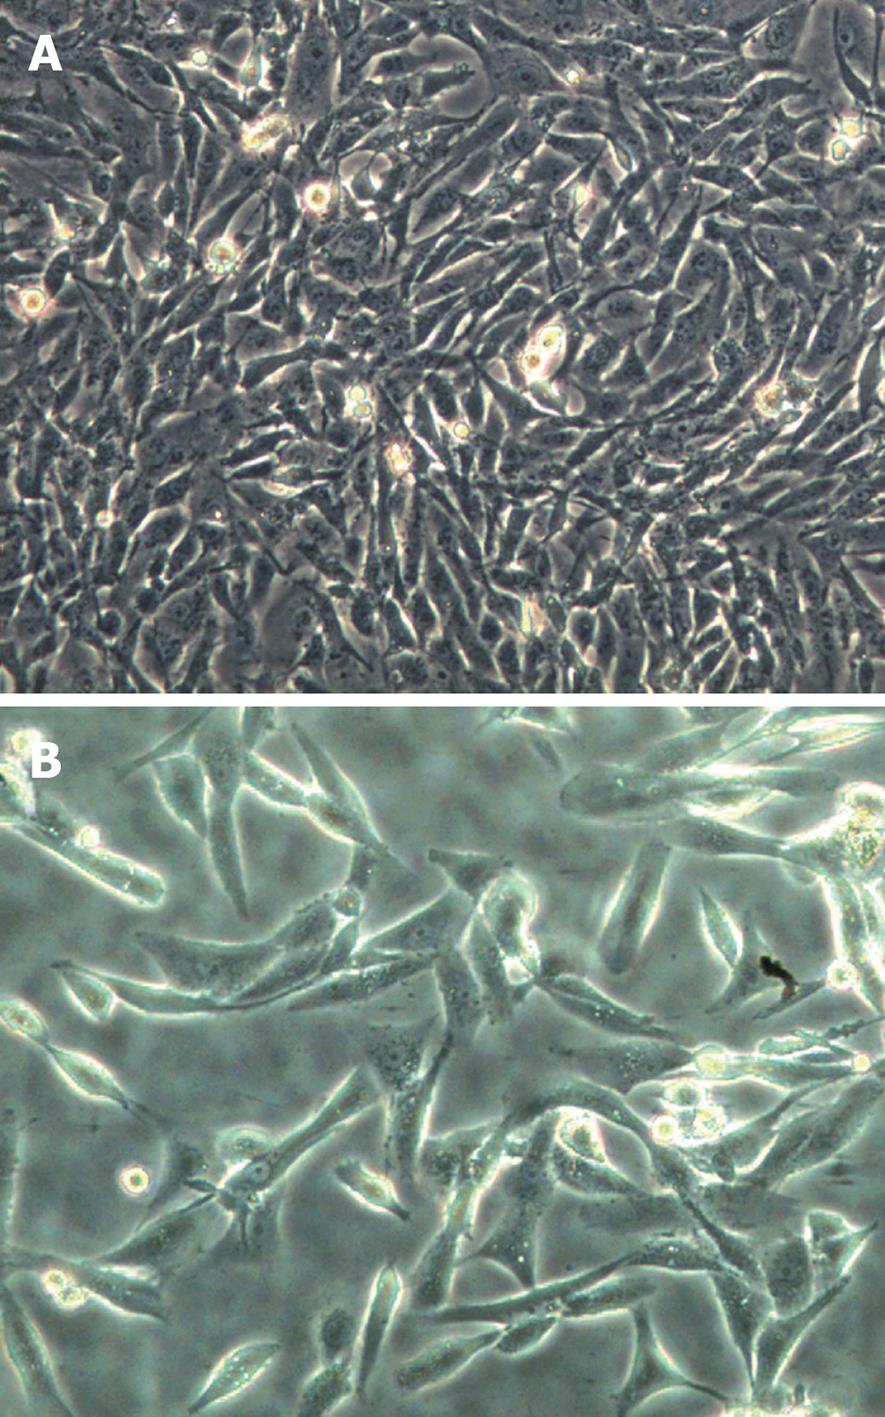
We established CDDP-resistant SK-Hep-1 (SK-Hep-1/CDDP) cells by pulse exposure of SK-Hep-1 cells to high concentrations of CDDP for short periods over 24 h. This caused a marked change in cellular morphology with many elongated cell dendrites and deposits of intracytoplasmic vacuoles observed, and cells membrane became less clear, or cells died. These effects were clearly observed after 24 h treatment with CDDP at 5 μg/mL. The surviving cells recovered exponentially and then were further selected by a procedure consisting of 6 pulse drug treatments with 5 μg/mL CDDP. The SK-Hep-1-resistant subclone was established 6 mo after the treatment was initiated. Microscopic observation revealed that the SK-Hep-1/CDDP cells (Figure 1B) adopted a spindle shape, similar to that of the parent cells (Figure 1A). The sensitivity of SK-Hep-1 and SK-Hep-1/CDDP cells to various concentrations of CDDP was determined by CCK-8 assay. As shown in Table 1, IC50 values for CDDP on SK-Hep-1 and SK-Hep-1/CDDP cells were 5.13 ± 0.09 μg/mL and 70.61 ± 1.06 μg/mL, respectively. SK-Hep-1/CDDP cells were 13.76-fold more resistant to CDDP than the parent cells. We also compared the cross-resistance to other anticancer drugs (DOX, VCR, 5-FU) between the parent and CDDP-resistant cells, with our results indicating that the SK-Hep-1/CDDP cells also had cross-resistance to DOX, VCR and 5-FU.
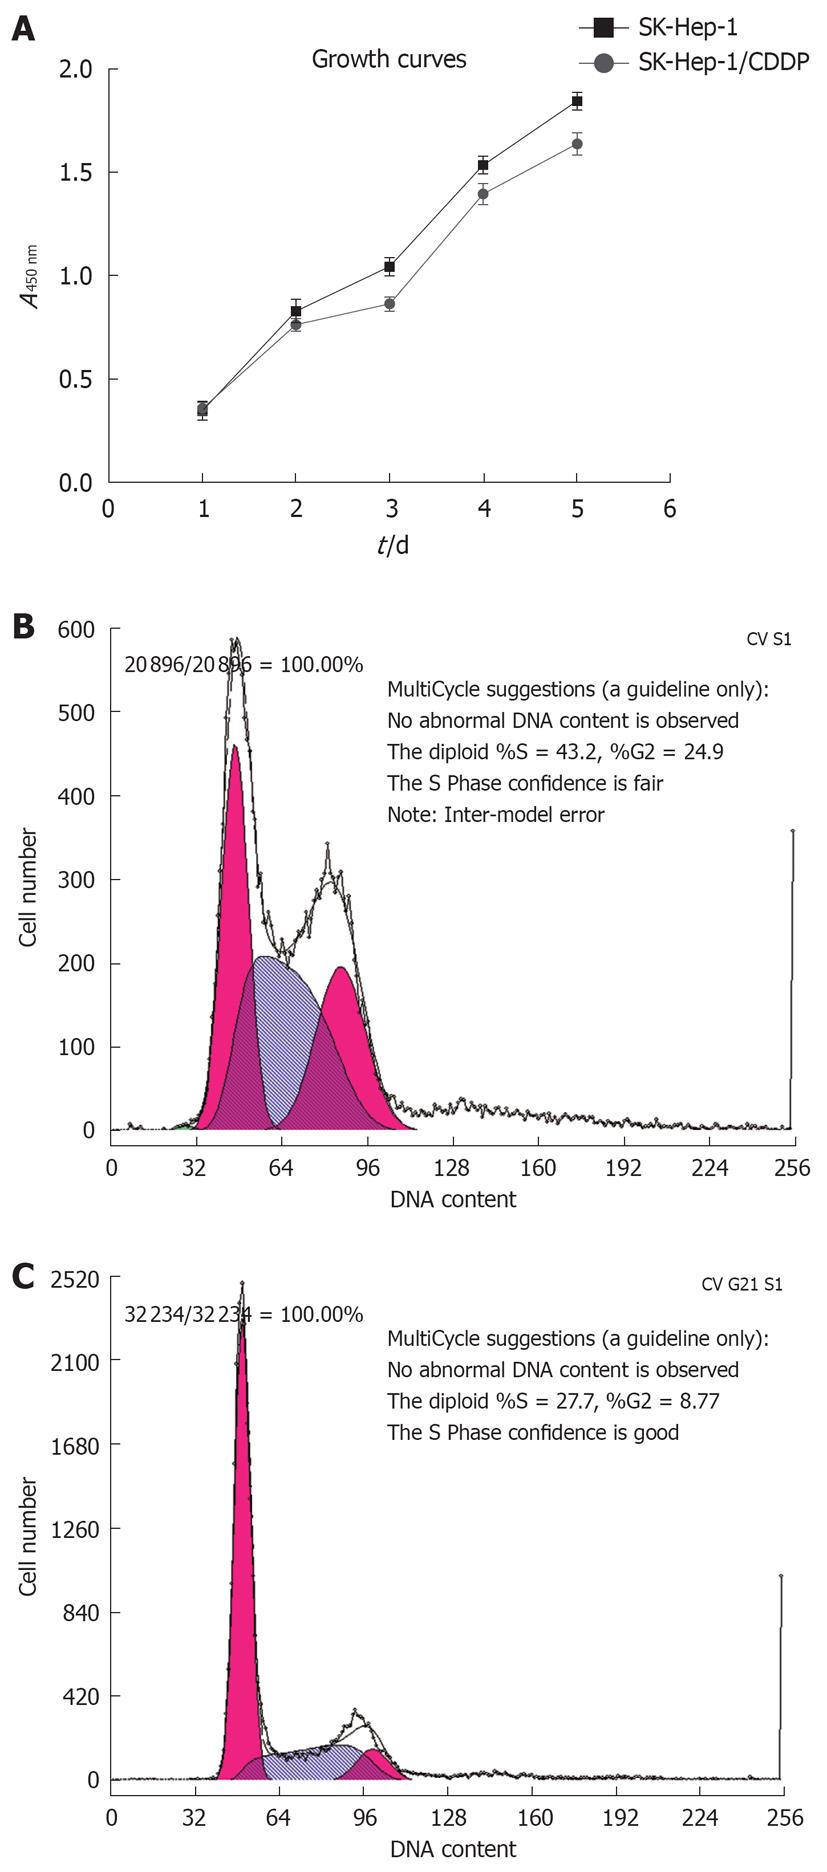
The growth curves for SK-Hep-1 cells and the CDDP-resistant SK-Hep-1 subline are shown in Figure 2A, and the cell cycle distribution of each cell line is shown in Figure 2B and C, and Table 2. The resistant cells grew more slowly than the the parent cells (P < 0.05). Cell cycle analysis revealed that the number of SK-Hep-1/CDDP cells in the G0/G1 phase decreased, accompanied by an increased proportion of cells in the S phase and G2/M phases (P < 0.05, Table 2).
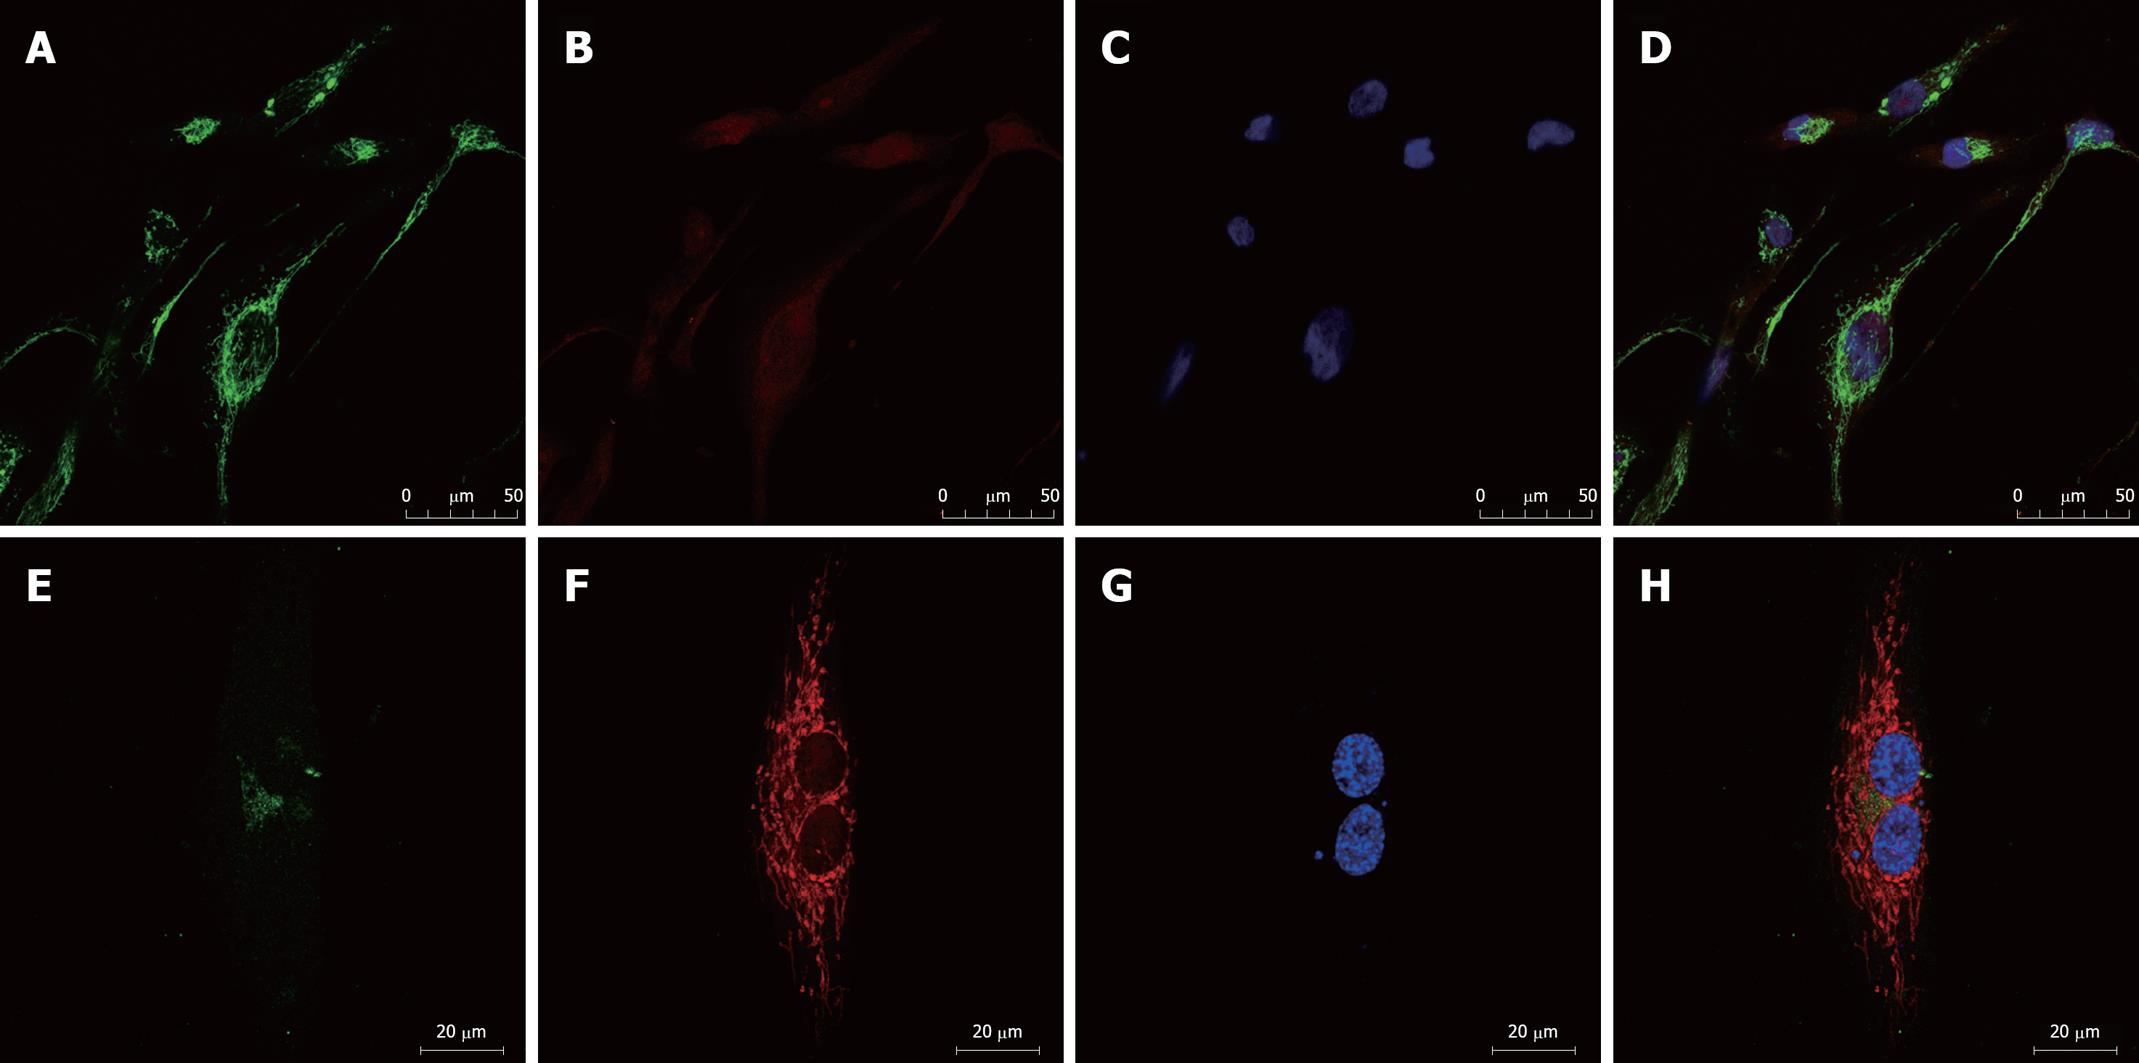
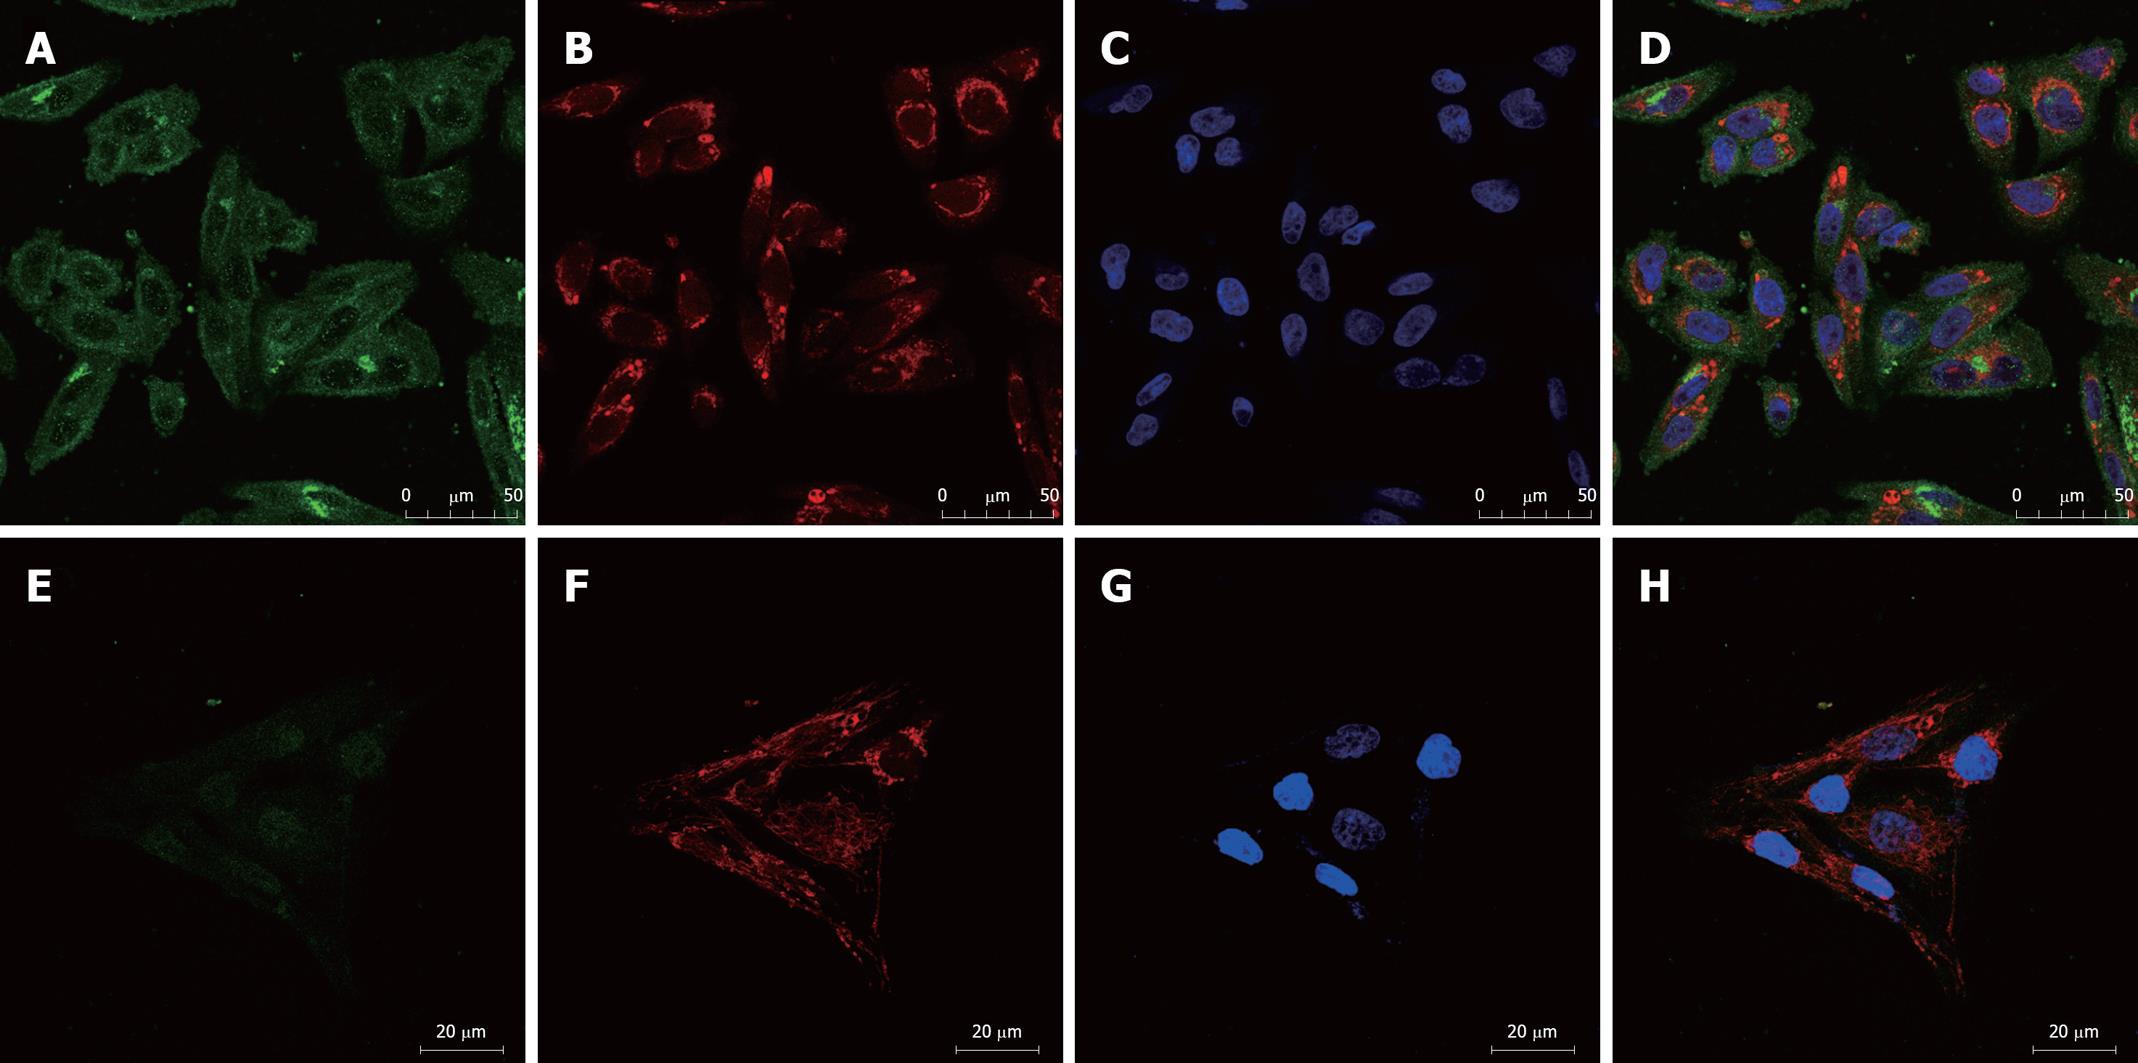
We examined the expression of the ATP-binding cassette (ABC) transporters[6], MDR1 and MRP1, by immunofluorescence. Confocal microscopic analysis confirmed that expression of both MDR1 and MRP1 was elevated in SK-Hep-1/CDDP and SK-Hep-1 cells (Figures 3 and 4), MDR1 or MRP1 appeared to localize around the nuclear membranes. To further assess the localization of MDR1 and MRP1, we performed a double stain with MitoTracker Red and DAPI. The green fluorescein fluorescence image was ubiquitous (MDR1 or MRP1). Figure 3 shows the relative level of MDR1/P-gp (green fluorescence) in SK-Hep-1/CDDP (Figure 3A-D) and parent SK-Hep-1 cell (Figure 3E-H) as viewed by confocal microscopy. Figure 4 shows the relative level of MRP1 (green fluorescence) in SK-Hep-1/CDDP (Figure 4A-D) and parent SK-Hep-1 cell (Figure 4E-H).
The results of the quantitative assessment are shown in Table 3. CDDP-resistant cells demonstrate pronounced high levels of green fluorescence and high mean gray density when compared with SK-Hep-1 cells (P < 0.05).
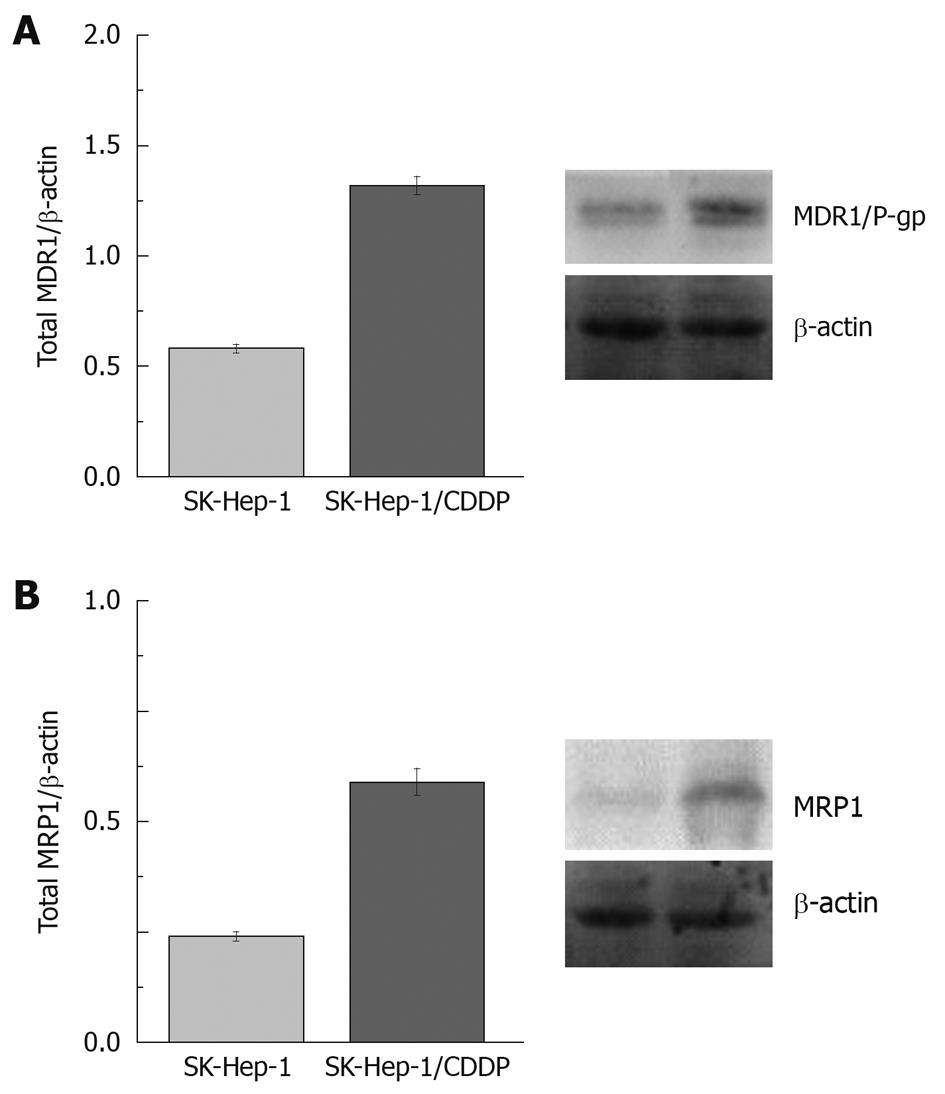
The expression of P-gp/MDR1 and MRP1 in SK-Hep-1/CDDP cells was evaluated by Western blotting analyses. These proteins were detected in the parental SK-Hep-1 and SK-Hep-1/CDDP cells. The levels of P-gp and, MRP1 were significantly higher in the SK-Hep-1/CDDP resistant cells than in the SK-Hep-1 cells (P < 0.01, Figure 5). We considered it important to confirm the maintenance of MDR1 and MRP1 expression and its functionality for our culture conditions. The gray intensity of P-gp/β-actin was 0.58 ± 0.02 for SK-Hep-1 and 1.32 ± 0.04 for SK-Hep-1/CDDP (P < 0.01, n = 3). The gray intensities of MRP1/β-actin were 0.24 ± 0.01 and 0.59 ± 0.03 for SK-Hep-1 and SK-Hep-1/CDDP cells, respectively (P < 0.01, n = 3).
Intrinsic and acquired resistance to multiple chemotherapeutic drugs is a major obstacle in the clinical treatment of cancer, and the mechanisms responsible for MDR remain unclear. Tumor-derived cell lines in which MDR is induced by the intermittent exposure to drugs[7,8] are frequently used models to study these mechanisms. In order to elucidate the molecular mechanisms of multiple chemotherapeutic drugs resistance in HCC, we established a CDDP-resistant hepatoma cell line as model for investigating chemotherapy resistance.
In this study, the CDDP-resistant subline SK-Hep-1/CDDP was induced by high-concentration, short-duration drug treatment[9]. SK-Hep-1/CDDP cells exhibited strong resistance to CDDP, 13.76 times greater than in SK-Hep-1 cells. The SK-Hep-1/CDDP cells showed significant changes in cell growth compared with SK-Hep-1, growing at a slower rate and exhibiting changes in the cell cycle following the development of drug resistance. The proportion of SK-Hep-1/CDDP cells in the G2/M and S phases increased significantly. Meanwhile SK-Hep-1/CDDP cells also demonstrated cross-resistance to multiple, structurally diverse chemotherapeutic agents, such as DOX, VCR and 5-FU. These resistant phenotypes were stable and the IC50 values and resistance index demonstrated no significant change over a 3-mo period in drug-free medium.
HCC resistance to chemotherapeutic treatment is possibly related to the overexpression of MDR proteins belonging to the ABC family. Recent studies showed that HCC expressed MRP1, MDR1, MRP3 and breast cancer resistance protein (BCRP/ABCG2), and these might confer tumor cells with a MDR phenotype[10,11]. Some reports stated that MRPs were more likely to be candidates to mediate chemo-resistance in HCC than MDR1[12,13]. MDR1, MRP1 and MRP2 genes are well known as ABC transporters associated with CDDP-resistance, as these proteins cause the efflux of many anticancer agents that have different mechanisms. Our study revealed that both a CDDP-resistant subline and its parental cells expressed MDR1, but the subline cells overexpressed MDR1 and MRP1.
In summary, although chemotherapy-resistant tumor cell lines have some disadvantages, they do provide model systems where all biological parameters can be controlled and assessed. We established a CDDP-resistant human hepatoma cell line, which provided the basis for further study of resistant mechanisms and reversal of clinical HCC drug resistance.
Drug resistance, in particular multidrug-resistance (MDR), is still the major cause of anticancer chemotherapy failure. The most important factor of medicating a MDR phenotype is the increased activity of the membrane-embedded drug extrusion pump, MDR1/P-glycoprotein (MDR1/P-gp or ABCB1). The mechanism of the reverse MDR phenotype is thought to involve direct binding to P-gp and displacement of the anticancer drugs, which enhances intracellular toxic efficacy of these agents. Analysis of novel chemotherapy-resistant cell lines may duplicate as far as possible the treatment conditions used in vivo.
Hepatocellular carcinoma (HCC) responds poorly to chemotherapy owing to MDR. Recent studies have shown the tumors derived from the colon, kidney, or adrenal cortex, and HCC exhibited overexpression of MDR1/P-gp. This overexpression results in a primary MDR phenotype of these cancers. Tumor-derived cell lines are one of the most important tools for investigation of the biological mechanisms directly leading to drug resistance in patients. Today, the experimental search for drug resistant mechanisms that are clinically relevant targets whose circumvention can improve cancer therapy is still ongoing.
The model SK-Hep-1/CDDP cell line can be used as an in vivo model to investigate the molecular mechanisms involved in MDR-related genes of hepatocarcinoma and to explore the targeted approaches for overcoming MDR in tumor cells.
The SK-Hep-1/CDDP cells can be employed as a model system as its biological parameters can be controlled and assessed, and novel biomarkers of chemotherapy resistance can be identified. The methods described in this study and the results presented might provide the basis for advanced studies in this field.
The manuscript is interesting and could be useful. The establishment of a human hepatoma multidrug-resistance cell line in vitro presents interesting results. The data show that a cisplatin-resistant hepatoma cell line increased MDR1 comparing with control cells, and expressed MRP1. They concluded that this fact conferred cross-resistance to the cell line.
Peer reviewers: Mariana D Dabeva, MD, PhD, BS, Associate Professor, Department of Medicine, Albert Einstein College of Medicine, Bronx, NY 10461, United States; Maria Concepción Gutiérrez-Ruiz, PhD, Department of Health Sciences, Universidad Autonoma Metropolitana-Iztapalapa, DCBS, Av San Rafael Atlixco 186, Colonia Vicentina, México, DF 09340, México
S- Editor Wang JL L- Editor Cant MR E- Editor Lin YP
| 1. | Pérez-Tomás R. Multidrug resistance: retrospect and prospects in anti-cancer drug treatment. Curr Med Chem. 2006;13:1859-1876. |
| 2. | Parkin DM, Bray F, Ferlay J, Pisani P. Estimating the world cancer burden: Globocan 2000. Int J Cancer. 2001;94:153-156. |
| 3. | Vander Borght S, Komuta M, Libbrecht L, Katoonizadeh A, Aerts R, Dymarkowski S, Verslype C, Nevens F, Roskams T. Expression of multidrug resistance-associated protein 1 in hepatocellular carcinoma is associated with a more aggressive tumour phenotype and may reflect a progenitor cell origin. Liver Int. 2008;28:1370-1380. |
| 4. | Schwartz JD, Schwartz M, Mandeli J, Sung M. Neoadjuvant and adjuvant therapy for resectable hepatocellular carcinoma: review of the randomised clinical trials. Lancet Oncol. 2002;3:593-603. |
| 5. | Lasagna N, Fantappiè O, Solazzo M, Morbidelli L, Marchetti S, Cipriani G, Ziche M, Mazzanti R. Hepatocyte growth factor and inducible nitric oxide synthase are involved in multidrug resistance-induced angiogenesis in hepatocellular carcinoma cell lines. Cancer Res. 2006;66:2673-2682. |
| 6. | Marchetti S, Mazzanti R, Beijnen JH, Schellens JH. Concise review: Clinical relevance of drug drug and herb drug interactions mediated by the ABC transporter ABCB1 (MDR1, P-glycoprotein). Oncologist. 2007;12:927-941. |
| 7. | Twentyman PR, Fox NE, Wright KA, Bleehen NM. Derivation and preliminary characterisation of adriamycin resistant lines of human lung cancer cells. Br J Cancer. 1986;53:529-537. |
| 8. | Iwasaki I, Sugiyama H, Kanazawa S, Hemmi H. Establishment of cisplatin-resistant variants of human neuroblastoma cell lines, TGW and GOTO, and their drug cross-resistance profiles. Cancer Chemother Pharmacol. 2002;49:438-444. |
| 9. | Watson MB, Lind MJ, Cawkwell L. Establishment of in-vitro models of chemotherapy resistance. Anticancer Drugs. 2007;18:749-754. |
| 10. | Kim H, Park C, Han KH, Choi J, Kim YB, Kim JK, Park YN. Primary liver carcinoma of intermediate (hepatocyte-cholangiocyte) phenotype. J Hepatol. 2004;40:298-304. |
| 11. | Lee JS, Heo J, Libbrecht L, Chu IS, Kaposi-Novak P, Calvisi DF, Mikaelyan A, Roberts LR, Demetris AJ, Sun Z. A novel prognostic subtype of human hepatocellular carcinoma derived from hepatic progenitor cells. Nat Med. 2006;12:410-416. |
| 12. | Zollner G, Wagner M, Fickert P, Silbert D, Fuchsbichler A, Zatloukal K, Denk H, Trauner M. Hepatobiliary transporter expression in human hepatocellular carcinoma. Liver Int. 2005;25:367-379. |
| 13. | Nies AT, König J, Pfannschmidt M, Klar E, Hofmann WJ, Keppler D. Expression of the multidrug resistance proteins MRP2 and MRP3 in human hepatocellular carcinoma. Int J Cancer. 2001;94:492-499. |


