Published online Oct 21, 2008. doi: 10.3748/wjg.14.6036
Revised: September 16, 2008
Accepted: September 23, 2008
Published online: October 21, 2008
AIM: To investigate Kupffer cell dynamics and phagocytic activity, using a rat nonalcoholic steatohepatitis (NASH) model.
METHODS: Male F344 rats were fed either a control diet or a choline-deficient L-amino acid-defined (CDAA) diet, followed by contrast enhanced ultrasonography (CEUS) using Levovist®. The uptake of latex beads by the Kupffer cells was determined by fluorescent microscopy. The status of the Kupffer cells was compared between the two groups, using the immunohistochemical staining technique.
RESULTS: After 4 or more wk of the CDAA diet, CEUS examination revealed a decrease in the signal intensity, 20 min after intravenous Levovist®. Fluorescent microscopic examination showed that the uptake of latex beads by the Kupffer cells was reduced at week 1 and 2 in the study group, compared with the controls, with no further reduction after 3 wk. Immunohistochemical staining revealed no significant difference in the Kupffer cell counts between the control group and the CDAA group.
CONCLUSION: CEUS examination using Levovist® demonstrated reduced contrast effect and phagocytic activity in the liver parenchymal phase, although the Kupffer cell numbers were unchanged, indicating reduced phagocytic function of the Kupffer cells in the rat NASH model. We believe that CEUS examination using Levovist® is a useful screening modality, which can detect NASH in fatty liver patients.
- Citation: Tsujimoto T, Kawaratani H, Kitazawa T, Hirai T, Ohishi H, Kitade M, Yoshiji H, Uemura M, Fukui H. Decreased phagocytic activity of Kupffer cells in a rat nonalcoholic steatohepatitis model. World J Gastroenterol 2008; 14(39): 6036-6043
- URL: https://www.wjgnet.com/1007-9327/full/v14/i39/6036.htm
- DOI: https://dx.doi.org/10.3748/wjg.14.6036
Nonalcoholic steatohepatitis (NASH) is characterized by hepatic steatosis, inflammation and fibrosis, with increased risk of developing cirrhosis and hepatocellular carcinoma (HCC)[1-3]. The progression from simple steatosis to cirrhosis has been attributed to inflammatory cytokines such as tumor necrosis factor alpha (TNF-α), oxidative stress and endotoxins, in combination with fatty degeneration due to insulin resistance[4]. At present, histopathological examination of liver biopsy tissue is the only way to definitively diagnose NASH[5-8].
The diagnosis of NASH is important in clinical practice, since this condition can progress to cirrhosis and HCC. When patients with NASH undergo contrast enhanced ultrasonography (CEUS) using Levovist® (galactose-palmitic acid ultrasound contrast agent), a reduced contrast effect is seen in the liver parenchymal phase[9]. The activity of Kupffer cells and hepatic sinusoids can be evaluated using the contrast effect in the liver parenchymal phase during CEUS examination with Levovist®. The findings strongly implicate Kupffer cells in the pathogenesis of NASH. Reduced function or uneven distribution of Kupffer cells in the liver may play a part in the development of NASH, although this hypothesis remains conjectural at the present time.
In this study, we investigated the contrast effect in the liver parenchymal phase of CEUS using Levovist®, and assessed the Kupffer cell dynamics and phagocytic activity.
Six-week-old male F344 rats weighing 180-200 g were purchased from Japan SLC Inc. (Hamamatsu, Shizuoka, Japan). The animals were housed in stainless steel mesh cages under controlled conditions of temperature (23 ± 3°C) and relative humidity (50% ± 20%), with 10 to 15 air changes per hour, and light illumination for 12 h a day. The animals were allowed access to tap water ad libitum throughout the duration of the study. A choline-deficient L-amino acid-defined (CDAA), and a choline-supplemented L-amino acid-defined (CSAA) diet were purchased from CLEA Japan Inc. (Tokyo, Japan). The details of both diets are described elsewhere[10]. The study group was fed a CDAA diet for 8 wk in order to produce NASH. All procedures were approved by the institutional animal care committee and conducted in accordance with Nara Medical University Guidelines for the Care and Use of Laboratory Animals.
Serum samples from CSAA-fed rats and CDAA-fed rats, killed at 1, 4 and 8 wk were used to measure the serum ALT levels. The levels of serum ALT were determined using a 7170 Clinical Analyzer (Hitachi High-Technologies, Tokyo, Japan).
The liver tissues were fixed in 10% formalin, and the first section was stained with hematoxylin and eosin for histological examination. Another section was stained with Azan and Sirius red to detect fibrosis. Histological grading and staging were performed using a modified scoring system based on the classification of either Matteoni et al[5] or Brunt et al[6]. Matteoni et al[5] proposed NAFLD types 1-4 based on long-term outcome studies; Brunt et al[6] proposed a system of grading and staging for NASH that follows methods of separate assessment of necroinflammatory lesions (grading) and fibrosis (staging), accepted in other forms of non-biliary chronic liver diseases.
We compared the contrast effects in the CEUS liver parenchymal phase before administering the CDAA diet (control group, n = 5), and after 1, 4, and 8 wk of the CDAA diet (1-, 4-, and 8-wk groups, n = 5 for each group). The studies were performed with the Logiq 7 ultrasonographic system (GE Healthcare, Tokyo, Japan), using a 7L probe (3-7 MHz), and employing the Coded Harmonic Angio mode. Levovist® (Schering AG, Berlin, Germany) was diluted to 300 mg/mL, and injected into the animal’s tail vein at a dose of 0.1 mL/100 g body weight. Following confirmation that the contrast had entered the right kidney, we scanned the liver, using 1-s intermittent transmission scans at 5, 10, 15, and 20 min, with a different section for each scan. The fluorescent intensity in the region of interest (ROI) in each image was calculated by the equipment software using the time intensity curve (TIC).
An injection of 2 × 10¹⁰/kg 1 μm fluorescent latex beads (Polyscience, Warrington, PA, USA) was given into the animal’s tail vein before CDAA (control group, n = 5), and after 1, 2, 3, 4, and 8 wk of CDAA (1-, 2-, 3-, 4- and 8-wk groups, n = 5 for each group). Two hours after the injection, the animals were killed and 4% paraformaldehyde and 0.5% glutaraldehyde in phosphate buffer saline (PBS) was perfused into the portal vein. After fixation with the same fixative for 60 min, the liver specimens were sliced into 5-μm-thick sections with a cryostat microtome CM 1510 (Leica Microsystems, Wetzlar, Germany). The uptake of latex beads by the Kupffer cells was determined using fluorescent microscopy Leica DM IRB (Leica Microsystems), and the fluorescent intensities were analyzed and compared using IP LabTM software (BD Biosciences, Rockville, MD, USA).
The Kupffer cells were harvested from the liver using the isolation buffers described by Seglen[11]. The liver was perfused in situ with Ca2+-free minimum essential medium (Sigma, St. Louis, MI, USA) followed by 0.3% pronase (Roche Diagnostics Corp., Indianapolis, IN, USA), and 0.05% type IV collagenase (Sigma) in Dulbecco’s modified eagle’s medium/F-12 (Sigma) at a rate of 10 mL/min through the portal vein. The liver was carefully removed and minced with scissors. The minced liver was incubated in a shaker water bath with 0.035% pronase and 62.5 U/mL DNase (Sigma) in Dulbecco’s modified eagle’s medium/F-12 at 37°C for 20 min, and was then filtered through gauze; the parenchymal cells were removed by low-speed centrifugation. The resultant supernatant was laid on top of 4 separate densities (1.035, 1.045, 1.058, and 1.085) of arabinogalactan solution (Sigma) in one test tube and centrifuged at 400 r/min for 45 min at 37°C using a Beckman SW41-Ti rotor (Beckman Instruments, Fullerton, CA, USA). The third and fourth layers from the top were recovered and washed twice with Ca2+-free Hanks balanced salt solution (Sigma). The final cell pallet was subsequently suspended in RPMI 1640 medium, and cultured in a culture flask at 37°C in humidified atmosphere containing 50 mL/L CO2 and air for 2 h.
The purity of the isolated Kupffer cells was over 98%, as determined by the uptake of 1 μm latex beads[12], and the viability was over 95% in the trypan-blue-dye exclusion test.
The Kupffer cells were seeded in 12-well plastic plates and incubated in RPMI 1640 medium at a concentration of 5 × 10⁵ cells/mL. The dishes were washed with Hanks balanced salt solution to remove the unattached cells. The Kupffer cells were cultured in RPMI 1640 supplemented with 50 μg/mL streptomycin and 50 μg/mL ampicillin (Nakalai tesque, Kyoto, Japan).
Fluorescent latex beads (1 × 10⁷ 1 μm) were placed in each well, and culture was performed at 37°C for 2 h under 50 mL/L CO2 on plastic dishes that were washed three times with Hanks balanced salt solution to remove un-phagocytosed latex beads. The uptake of latex beads by the Kupffer cells was determined using fluorescent microscopy, and the fluorescent intensities were analyzed and compared using IP LabTM software.
The Kupffer cell dynamics were analyzed by comparing the cell counts of each group, using immuno-histochemical staining with anti-rat macrophage/dendritic cell monoclonal antibody (RM-4: Trans Genic Inc., Kobe, Japan), a Vectastain ABC Elite Kit (Vector Laboratories, Burlingame, CA, USA), and DAB peroxidase substrate solution (Vector Laboratories), with counterstaining by Hematoxylin Mayer. The stained areas were analyzed and compared using NIH-image software (Version 1.61; U. S. National Institute of Health, Bethesda, MD, USA).
P-values were calculated, assuming equal sample variance, using the paired t-test, and Statview software (version 5.0; SAS Institute, Cary, NC, USA), considering P < 0.05 as statistically significant. The values are mentioned as mean ± SD.
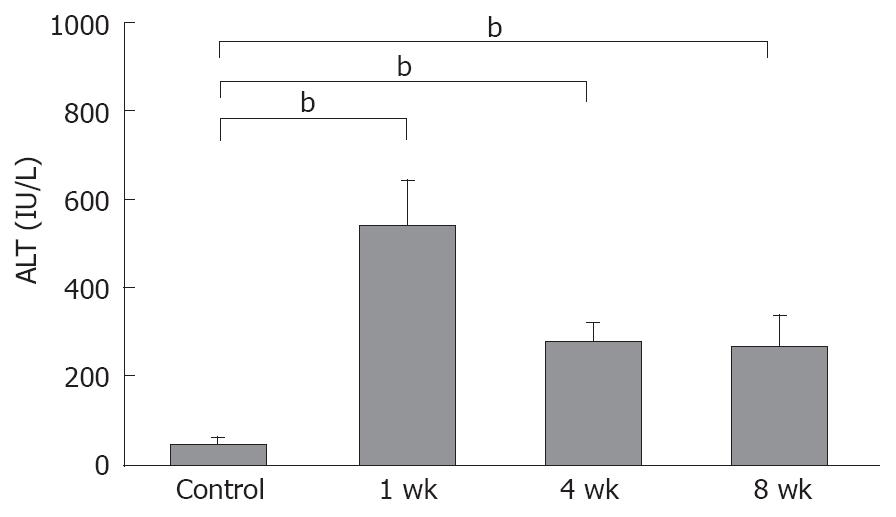
The mean serum ALT level in the control rats was 41.7 ± 7.4 IU/L, compared to 524.6 ± 101.7 IU/L, 267.9 ± 47.5 IU/L and 251.4 ± 81.6 IU/L in the 1-, 4-, and 8-wk, respectively in the CDAA-fed rats. All NASH groups showed statistically significant elevations, compared with the control animals (P < 0.01) (Figure 1).
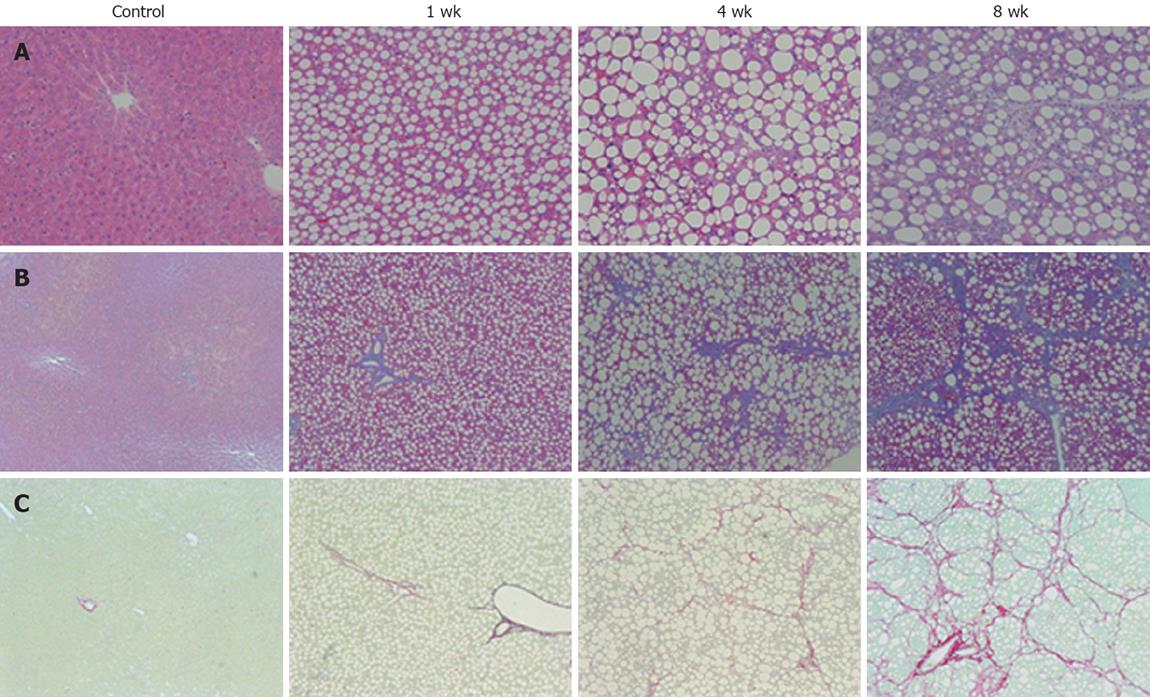
Histological examination of the liver of 1-wk CDAA-fed rats revealed inflammation and fat deposits, but no fibrosis, and was considered as Matteoni’s type 2. The 4-wk CDAA-fed rats had more inflammation, fat deposits, and fibrosis, which was equivalent to Matteoni’s type 3 and Brunt’s NASH classification of grade 2/stage 2. The histological findings in the 8-wk CDAA-fed rats were equivalent to Matteoni’s type 4 and Brunt’s grade 2/stage 3. In the 4- and 8-wk groups, Sirius red staining revealed abundant collagen (Figure 2).
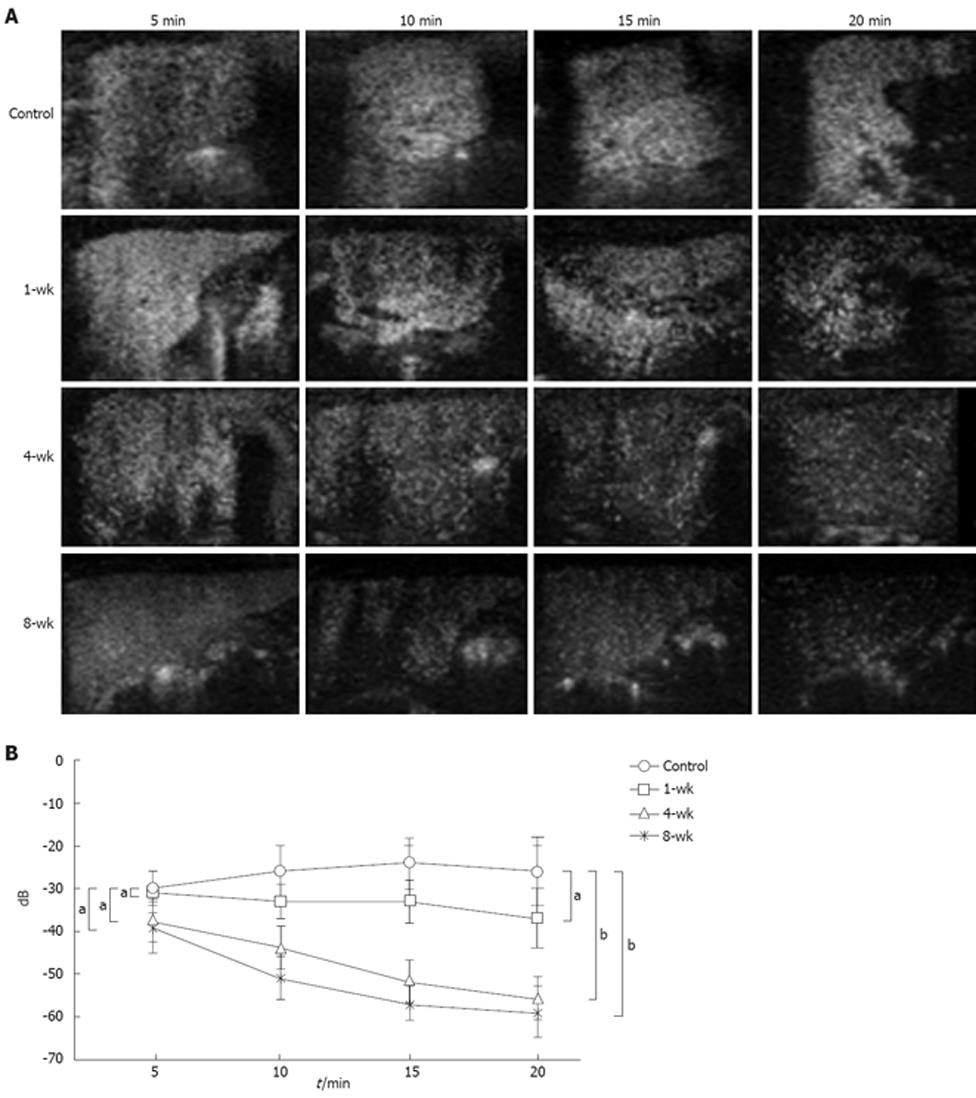
Assessment of changes in fluorescent intensity up to 20 min (-25.5 ± 6.4 dB, -37.5 ± 7.5 dB, -55.2 ± 3.9 dB, -59.3 ± 5.6 dB in the control, 1-, 4-, and 8-wk CDAA-fed rats) after administration of Levovist®, with the values at 5 min (-30.2 ± 4.4 dB, -31.8 ± 1.8 dB, -38.8 ± 4.1 dB, -39.7 ± 6.2 dB in the control, 1-, 4-, and 8-wk CDAA-fed rats, respectively) considered as the standard, showed that the fluorescent intensity in the control group tended to rise from 10 min onwards, and remained elevated. In the 1-wk group, the contrast effect remained fairly constant from 5 min to 20 min. In the 4- and 8-wk groups, the contrast effect was decreased significantly at 20 min (Figure 3A). When the fluorescent intensity was quantified using TIC, the fluorescent intensity at 20 min tended to be lower in the 1-wk group and significantly lower in the 4- and 8-wk groups compared with the control group (Figure 3B).
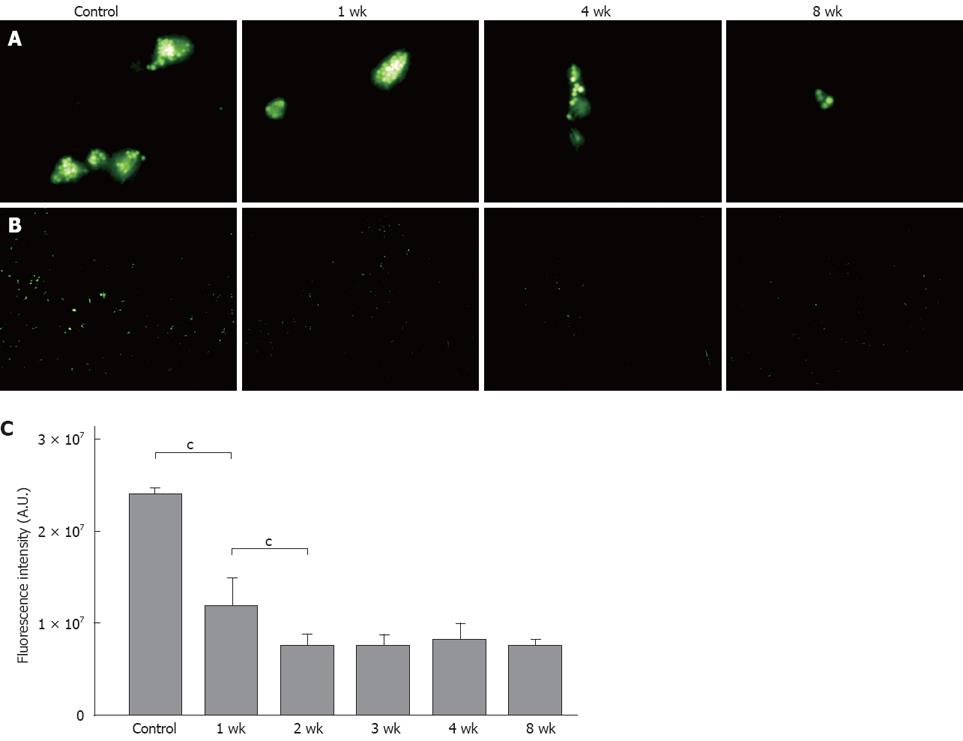
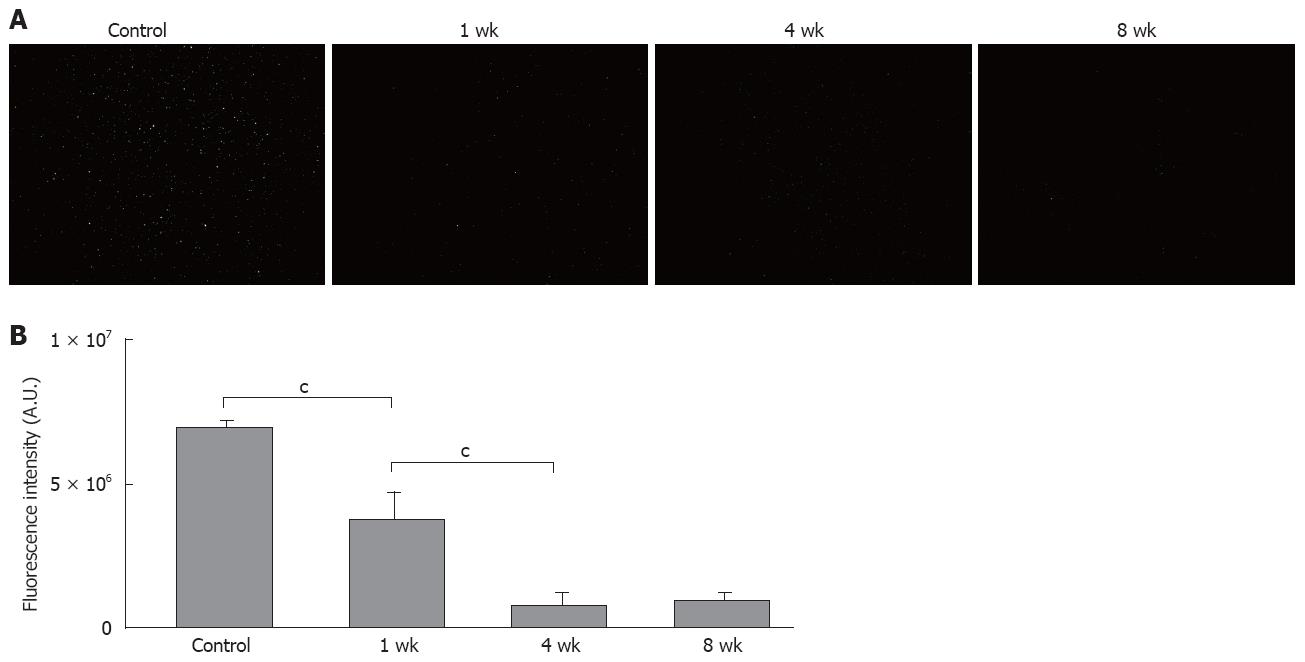
Fluorescent microscopic examination showed that the latex bead uptake per Kupffer cell in vivo was lower in the 1-wk group compared to the controls, with no further reduction after 4 and 8 wk (Figure 4A and B). To avoid the influence of Kupffer cell cross-sections, and to count the Kupffer cells more accurately, we observed the images again at lower magnification. In comparison with the control group, the uptake was reduced to approximately 50% in the 1-wk group, and to 30% in the 2-wk group, with no further decrease after 3 wk (Figure 4C).
Similar to the in vivo findings, the fluorescent microscopic examination showed that the in vitro latex bead uptake per Kupffer cell was lower in the 1-wk group than in the controls, with no further reduction after 4 and 8 wk. To avoid the influence of Kupffer cell cross-sections, and to count the Kupffer cells more accurately, we observed the images again at lower magnification. In comparison with the control group, the uptakes were reduced to approximately 60% in the 1-wk group, and to 30% in the 2-wk group, with no further decrease after 3 wk (Figure 5).
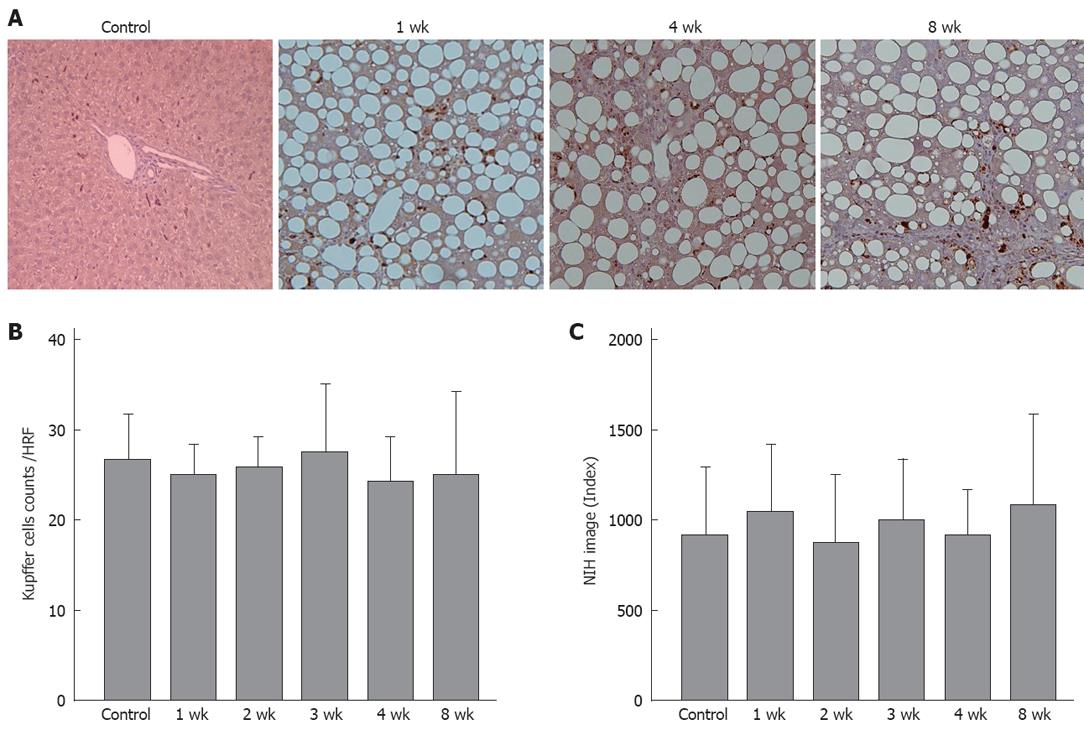
Immunohistochemical staining showed no significant difference in the number of stained cells per field between the control group and any of the CDAA groups. Quantitative analysis using NIH Image™ also showed no significant difference between the groups (Figure 6).
There was no correlation between the changes in the contrast effect, and the Kupffer cell count or the degree of fat deposition.
Ultrasonographic examinations have been performed to assist in the diagnosis of abdominal diseases since the 1970s, and continue to be widely used in clinical practice because of the ease of use and low level of invasiveness[13]. Until recently, ultrasonography enhanced by CO2 microbubbles, delivered through an intra-arterial catheter (developed in the 1980s), was the only CEUS technique available[14,15]. The intravenous ultrasonographic contrast agent Levovist®, available for clinical use in Japan since September 1999, facilitates the hepatic blood flow imaging with an inherently low level of invasiveness[16-19]. Levovist® CEUS provides information on both the blood flow and the parenchyma through the characteristics of the contrast agent[20,21]. Microbubbles injected via the intravenous route travel through the blood vessels, producing vascular images, and the gas is finally eliminated through the lungs[22]. However, some kinds of microbubbles accumulate in the organs such as the liver[23] and the spleen[24], which allows delayed phase imaging[25]. Recently, Levovist® CEUS has been reported to be a useful screening modality for NASH[9]. The reduced contrast effect in the liver parenchyma has been attributed to sinusoidal or Kupffer cell dysfunction, although this finding remains to be established[26].
In the present study, we performed Levovist® CEUS examination using a rat NASH model induced by the CDAA diet. We also assessed Kupffer cell dynamics and phagocytic activity, and confirmed that the contrast effect is reduced in the hepatic parenchymal phase. The liver histology progressed from steatosis and inflammation to marked fibrosis during 8 wk of CDAA feeding. The changes in fluorescent intensity up to 20 min after the administration of Levovist® revealed distinct differences depending on the duration of the CDAA diet. In the early phase, the effect of Levovist® in the hepatic sinusoids and the blood stream was strong, whereas at 20 min the effect of the contrast taken up by the Kupffer cells was apparent. When the values obtained at 5 min were taken as the standard, the contrast effect at 20 min was low even in the 1-wk CDAA-fed group. The contrast effect at 20 min was significantly lower in the 4-wk and 8-wk CDAA-fed groups compared with the findings in the control group. The decrease in the phagocytic activity of Kupffer cells in the early phase of rat steatohepatitis was further confirmed by the latex bead uptake test. In the present in vitro study, we demonstrated that isolated Kupffer cells from CDAA-fed rats had reduced phagocytic activity. The marked decrease in the phagocytic activity in the presence of normal Kupffer cell counts suggests the presence of Kupffer cell functional abnormalities in our NASH model. We propose that persistent inflammation leads to reduced phagocytic activity of the Kupffer cells. Although the cause of the marked decrease in the phagocytic activity is unclear[27], it may be attributable to intestinal bacterial endotoxins, which are believed to play a key role in the choline deficiency model of liver injury[28]. Further studies are necessary to exclude the possibility of hypoperfusion of the sinusoids, and to confirm Kupffer cell abnormality in steatohepatitis.
In the present study, we used the CDAA model, because the changes induced in the liver are reproducible and similar to those observed in NASH. The development of NASH in patients receiving total parenteral nutrition has been attributed to choline deficiency[29]. Furthermore, alcoholic liver disease may be associated with hepatic choline deficiency and hepatic steatosis, abnormalities that are also observed in rats fed a CDAA diet[27]. Although, our steatohepatitis model lacks obesity and insulin resistance, two major characteristics of human NASH, a possible association between Kupffer cells, with inflammation and fibrosis may resemble the findings in humans. Further studies on cytokine production by the Kupffer cells in the present NASH model may reveal Kupffer cell dysfunction and add new insight to the hepatic consequences of human NASH.
In conclusion, ultrasound examination by Levovist® confirmed the presence of a reduced contrast effect in the liver parenchymal phase in the rat NASH model. We believe that CEUS examination using Levovist® is a useful screening modality which can detect NASH in patients with fatty liver.
The diagnosis of nonalcoholic steatohepatitis (NASH) is important in clinical practice since this condition can progress to hepatic cirrhosis and hepatocellular carcinoma (HCC). At present, histopathological examination of liver biopsy tissue is the only way to definitively diagnose NASH. When NASH patients undergo contrast enhanced ultrasonography (CEUS) using Levovist®, reduced contrast effect is seen in the liver parenchymal phase.
Levovist® CEUS provides useful information on both the blood flow and the liver parenchyma, based on the characteristics of the contrast agent. Recently, Levovist® CEUS is being increasingly used as a screening modality for NASH. The reduced contrast effect in the liver parenchyma has been attributed to sinusoidal or Kupffer cell dysfunction, but this finding remains to be established. Therefore, the present workers performed Levovist® CEUS in a rat NASH model, induced by a choline-deficient L-amino acid-defined (CDAA) diet, and examined the Kupffer cell dynamics and phagocytic activity. The results obtained confirmed that the contrast effect is reduced in the liver parenchymal phase in the rat NASH model.
The present study demonstrated the contrast effect in the liver parenchymal phase of CEUS using Levovist®. In addition, Kupffer cell dynamics and phagocytic activity were assessed in the rat NASH model. The results confirmed the effectiveness of CEUS in diagnosing NASH.
The authors believe that the CEUS with Levovist® is a useful screening modality, which can detect NASH in patients with fatty liver.
Levovist (Schering AG, Berlin, Germany) is a galactose-palmitic acid ultrasound contrast agent, currently in use in European and Asian countries.
The manuscript includes well designed figures, and the results clearly show a reduction in KC function, which was not attributed to changes in KC number, during the course of CDAA feeding. The hypothesis is simple and clear.
Peer reviewers: Natalia A Osna, Liver Study Unit, Research Service (151), VA Medical Center, 4101 Woolworth Avenue, Omaha NE 68105, United States; Ursula M Gehling, PhD, Department of Hepatobiliary Surgery and Visc, University Hospital Hamburg-Eppendorf, Martinistrasse 52, Hamburg 20246, Germany
S- Editor Li DL L- Editor Anand BS E- Editor Lin YP
| 1. | Zen Y, Katayanagi K, Tsuneyama K, Harada K, Araki I, Nakanuma Y. Hepatocellular carcinoma arising in non-alcoholic steatohepatitis. Pathol Int. 2001;51:127-131. |
| 2. | Shimada M, Hashimoto E, Taniai M, Hasegawa K, Okuda H, Hayashi N, Takasaki K, Ludwig J. Hepatocellular carcinoma in patients with non-alcoholic steatohepatitis. J Hepatol. 2002;37:154-160. |
| 3. | Bugianesi E, Leone N, Vanni E, Marchesini G, Brunello F, Carucci P, Musso A, De Paolis P, Capussotti L, Salizzoni M. Expanding the natural history of nonalcoholic steatohepatitis: from cryptogenic cirrhosis to hepatocellular carcinoma. Gastroenterology. 2002;123:134-140. |
| 4. | Day CP, James OF. Steatohepatitis: a tale of two "hits"? Gastroenterology. 1998;114:842-845. |
| 5. | Matteoni CA, Younossi ZM, Gramlich T, Boparai N, Liu YC, McCullough AJ. Nonalcoholic fatty liver disease: a spectrum of clinical and pathological severity. Gastroenterology. 1999;116:1413-1419. |
| 6. | Brunt EM, Janney CG, Di Bisceglie AM, Neuschwander-Tetri BA, Bacon BR. Nonalcoholic steatohepatitis: a proposal for grading and staging the histological lesions. Am J Gastroenterol. 1999;94:2467-2474. |
| 7. | Brunt EM. Nonalcoholic steatohepatitis: definition and pathology. Semin Liver Dis. 2001;21:3-16. |
| 8. | Brunt EM. Nonalcoholic steatohepatitis. Semin Liver Dis. 2004;24:3-20. |
| 9. | Moriyasu F, Iijima H, Tsuchiya K, Miyata Y, Furusaka A, Miyahara T. Diagnosis of NASH using delayed parenchymal imaging of contrast ultrasound. Hepatol Res. 2005;33:97-99. |
| 10. | Nakae D, Mizumoto Y, Yoshiji H, Andoh N, Horiguchi K, Shiraiwa K, Kobayashi E, Endoh T, Shimoji N, Tamura K. Different roles of 8-hydroxyguanine formation and 2-thiobarbituric acid-reacting substance generation in the early phase of liver carcinogenesis induced by a choline-deficient, L-amino acid-defined diet in rats. Jpn J Cancer Res. 1994;85:499-505. |
| 11. | Seglen PO. Preparation of rat liver cells. 3. Enzymatic requirements for tissue dispersion. Exp Cell Res. 1973;82:391-398. |
| 12. | Kubo S, Rodriguez T Jr, Roh MS, Oyedeji C, Romsdahl MM, Nishioka K. Stimulation of phagocytic activity of murine Kupffer cells by tuftsin. Hepatology. 1994;19:1044-1049. |
| 13. | Tsujimoto T, Kuriyama S, Yoshiji H, Fujimoto M, Kojima H, Yoshikawa M, Fukui H. Ultrasonographic findings of amebic colitis. J Gastroenterol. 2003;38:82-86. |
| 14. | Matsuda Y, Yabuuchi I. Hepatic tumors: US contrast enhancement with CO2 microbubbles. Radiology. 1986;161:701-705. |
| 15. | Kudo M, Tomita S, Tochio H, Kashida H, Hirasa M, Todo A. Hepatic focal nodular hyperplasia: specific findings at dynamic contrast-enhanced US with carbon dioxide microbubbles. Radiology. 1991;179:377-382. |
| 16. | Harvey CJ, Blomley MJ, Eckersley RJ, Heckemann RA, Butler-Barnes J, Cosgrove DO. Pulse-inversion mode imaging of liver specific microbubbles: improved detection of subcentimetre metastases. Lancet. 2000;355:807-808. |
| 17. | Vallone P, Gallipoli A, Izzo F, Fiore F, Delrio P. Local ablation procedures in primary liver tumors: Levovist US versus spiral CTto evaluate therapeutic results. Anticancer Res. 2003;23:5075-5079. |
| 18. | Kim CK, Choi D, Lim HK, Kim SH, Lee WJ, Kim MJ, Lee JY, Jeon YH, Lee J, Lee SJ. Therapeutic response assessment of percutaneous radiofrequency ablation for hepatocellular carcinoma: utility of contrast-enhanced agent detection imaging. Eur J Radiol. 2005;56:66-73. |
| 19. | Maruyama H, Matsutani S, Kondo F, Yoshizumi H, Kobayashi S, Okugawa H, Ebara M, Saisho H. Ring-shaped appearance in liver-specific image with Levovist: a characteristic enhancement pattern for hypervascular benign nodule in the liver of heavy drinkers. Liver Int. 2006;26:688-694. |
| 20. | Iijima H, Moriyasu F, Miyahara T, Yanagisawa K. Ultrasound contrast agent, Levovist microbubbles are phagocytosed by Kupffer cells-In vitro and in vivo studies. Hepatol Res. 2006;35:235-237. |
| 21. | Yanagisawa K, Moriyasu F, Miyahara T, Yuki M, Iijima H. Phagocytosis of ultrasound contrast agent microbubbles by Kupffer cells. Ultrasound Med Biol. 2007;33:318-325. |
| 22. | Toft KG, Hustvedt SO, Hals PA, Oulie I, Uran S, Landmark K, Normann PT, Skotland T. Disposition of perfluorobutane in rats after intravenous injection of Sonazoid. Ultrasound Med Biol. 2006;32:107-114. |
| 23. | Quaia E, Blomley MJ, Patel S, Harvey CJ, Padhani A, Price P, Cosgrove DO. Initial observations on the effect of irradiation on the liver-specific uptake of Levovist. Eur J Radiol. 2002;41:192-199. |
| 24. | Lim AK, Patel N, Eckersley RJ, Goldin RD, Thomas HC, Cosgrove DO, Taylor-Robinson SD, Blomley MJ. Hepatic vein transit time of SonoVue: a comparative study with Levovist. Radiology. 2006;240:130-135. |
| 25. | Blomley MJ, Albrecht T, Cosgrove DO, Eckersley RJ, Butler-Barnes J, Jayaram V, Patel N, Heckemann RA, Bauer A, Schlief R. Stimulated acoustic emission to image a late liver and spleen-specific phase of Levovist in normal volunteers and patients with and without liver disease. Ultrasound Med Biol. 1999;25:1341-1352. |
| 26. | Iijima H, Moriyasu F, Tsuchiya K, Suzuki S, Yoshida M, Shimizu M, Sasaki S, Nishiguchi S, Maeyama S. Decrease in accumulation of ultrasound contrast microbubbles in non-alcoholic steatohepatitis. Hepatol Res. 2007;37:722-730. |
| 27. | Tsujimoto T, Kuriyama S, Yamazaki M, Nakatani Y, Okuda H, Yoshiji H, Fukui H. Augmented hepatocellular carcinoma progression and depressed Kupffer cell activity in rat cirrhotic livers. Int J Oncol. 2001;18:41-47. |
| 28. | Eastin CE, McClain CJ, Lee EY, Bagby GJ, Chawla RK. Choline deficiency augments and antibody to tumor necrosis factor-alpha attenuates endotoxin-induced hepatic injury. Alcohol Clin Exp Res. 1997;21:1037-1041. |
| 29. | Fong DG, Nehra V, Lindor KD, Buchman AL. Metabolic and nutritional considerations in nonalcoholic fatty liver. Hepatology. 2000;32:3-10. |


