INTRODUCTION
In humans, adipose tissue is an important “energy bank” in which excess energy is stored and then released to meet the energy needs of the body. In the fed state and during periods of excess calorie intake, the excess energy is stored within adipose tissue as triglycerides. In the fasting state and during starvation, triglycerides within adipose tissue can be rapidly broken down by hormone-sensitive lipase to generate fatty acids. Oxidation of fatty acids releases more energy than that of carbohydrate, protein or triglycerides. Fatty acids are thus the most efficient “fuel” to meet the body’s energy needs[1].
In addition to playing an important role in energy homeostasis, adipose tissue is now well recognised as an endocrine organ[23]. It is known to produce and secrete a wide variety of bioactive peptides, known as adipokines. These include proteins, such as leptin, adiponectin, resistin, as well as the recently described visfatin and retinol binding protein 4[4–8]. In addition, proinflammatory cytokines, such as tumour necrosis factor alpha and interleukin-6, and acute phase reactants, such as C-reactive protein are also secreted by the adipocyte. All of these adipokines may act at both a local (paracrine) and systemic (endocrine) level and contribute to the development of obesity-related disorders, such as insulin resistance, Type 2 diabetes and cardiovascular disease[23].
Adipose tissue stores may become saturated, either due to failure to develop adequate adipose tissue mass (lipodystrophy), or to expand these stores sufficiently to accommodate increased energy intake. When this occurs, lipid starts to accumulate in non-adipose cells. Ectopic storage of lipids in organs, such as the liver, skeletal muscle and pancreas (the “lean body mass”) is thought to play a critical role in the development of insulin resistance and Type 2 diabetes[9]. The accumulation of ectopic fat has been shown to affect both renal and cardiovascular function and may contribute to the development of cardiovascular disease[10].
Evidence to support the hypothesis that ectopic fat accumulation plays a crucial role in insulin resistance comes from the study of subjects with lipodystrophies. These subjects have insufficient adipose tissue mass and hence store excess energy as triglycerides within organs, such as liver and skeletal muscle. As a result, individuals may develop insulin resistance and are at increased risk of developing Type 2 diabetes[11–14].
RELEVANCE OF HEPATIC FAT ACCUMULATION
Fatty infiltration of the liver is not a new phenomenon. However, until the last few decades, fatty liver, particularly that associated with insulin resistance rather than alcohol excess-“non-alcoholic fatty liver disease”, was considered to be a relatively benign condition. This notion was challenged when several reports documented the development of liver failure in some patients following jejunal bypass operations for morbid obesity[15–17]. The liver histology in such patients was indistinguishable from that seen in alcoholic steatohepatitis[18]. Similar hepatic lesions were subsequently described in obese patients who had neither abused alcohol nor undergone bariatric surgery[19–21] and in patients with diabetes mellitus[22–24]. In 1980, Ludwig and colleagues introduced the term “non-alcoholic steatohepatitis” (NASH) to describe these histological findings in patients who did not consume alcohol[25]. A variety of other terms have been used to describe this entity with non-alcoholic fatty liver disease now being the preferred term.
Accumulation of fat within the liver is of particular importance in that, over time, it may lead to the development of steatohepatitis and ultimately cirrhosis, end-stage liver failure and hepatocellular carcinoma[26–29].
MECHANISMS OF HEPATIC FAT ACCUMULATION
The mechanisms leading to hepatic fat accumulation remain poorly understood. The liver synthesizes triglycerides from free fatty acids. Free fatty acids are derived from lipolysis of triglycerides within adipose tissue, diet or de novo lipogenesis[1]. Once taken up by the liver, free fatty acids can either be oxidised in the mitochondria to form adenosine triphosphate (ATP), or esterified to produce triglycerides for storage, or incorporated into very low density lipoprotein (VLDL) particles. Triglycerides accumulate in the liver when their synthesis exceeds their export via VLDL[13031].
The development of non-invasive techniques for assessing hepatic fat content in vivo in humans has renewed interest in studying the mechanisms leading to hepatic fat accumulation. Ultrasound, computerized tomography (CT), magnetic resonance imaging (MRI) and proton magnetic resonance spectroscopy (1H MRS) have all played a prominent role in this.
METHODS TO STUDY HEPATIC FAT
Currently, the gold standard for determining hepatic fat severity and morphology is a liver biopsy[3132]. However, this procedure has several drawbacks, including discomfort, owing to its invasive nature, risk of infection, haematoma formation, or more significant internal bleeding, and biliary leakage. Furthermore, biopsies are subject to sampling error, because less than 1/50 000th of the liver is available for histological analysis.
Non-invasive imaging techniques, such as ultrasound, Computerized tomography (CT), magnetic resonance imaging (MRI) and proton magnetic resonance spectroscopy can detect fatty infiltration of the liver, but unlike liver biopsy, they are limited in their ability to detect coexisting inflammation or fibrosis.
NON-INVASIVE TECHNIQUES FOR ASSESSING HEPATIC FAT CONTENT
Ultrasound
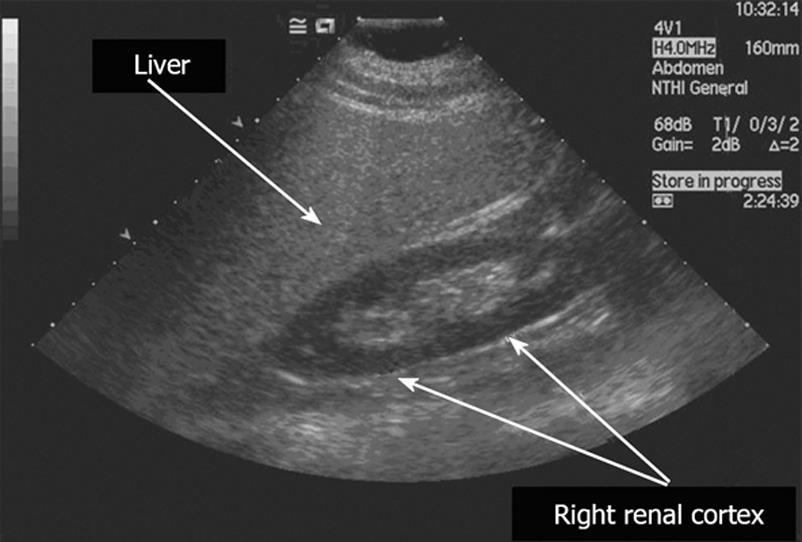
Hepatic ultrasound is a simple, non-invasive technique, which is widely used in clinical practice to detect fatty infiltration of the liver. As shown in Figure 1, hepatic steatosis causes increased echogenicity on ultrasound, so that liver appears brighter than the cortex of the ipsilateral kidney[3334].
Figure 1 Ultrasound findings in hepatic steatosis.
The steatotic liver is hyper-echoic, compared to the cortex of the right kidney. In addition, there is posterior attenuation of the ultrasound beam and reduced definition of the portal vein walls.
Diffuse hepatic steatosis and diffuse fibrosis can have similar sonographic appearances and therefore it can sometimes be difficult to distinguish between them. Some groups have used the term “fatty fibrotic pattern” to describe this pattern of increased echogenicity, although the echo shadows tend to be coarser in the presence of pure fibrosis[3536].
In some cases, fatty infiltration of the liver may be patchy, rather than diffuse, in distribution. The non-uniformity may be so marked that the fat is deposited in one well-circumscribed region (focal fatty infiltration) or, alternatively, discrete areas of liver parenchyma remain uninvolved when the remainder of the liver is diffusely infiltrated with fat (focal fatty sparing). Both conditions may create diagnostic problems for the radiologist. For example, with focal fatty sparing, if the increased echogenicity of the majority of the liver is not appreciated, then the area of normal hepatic parenchyma may be misinterpreted as a pathological hypoechoic lesion[37]. If, however, the increased echogenicity of the remainder of the liver is appreciated, then the area of normal hepatic parenchyma may be helpful in making the diagnosis of fatty change[38].
Several studies have assessed the sensitivity and specificity of ultrasound for detecting hepatic steatosis. In these, the sensitivity ranged from 60% to 94% and the specificity from 84% to 95%, respectively[3539–41]. Another study combined fatty change with fibrosis and obtained a sensitivity of 98.7% and specificity of 94% for the “fatty fibrotic pattern”[42]. The sensitivity of ultrasound increases with increasing degrees of fatty infiltration. For example, in the presence of hepatic fat content of 10% to 19%, it has a sensitivity of 55%, which rises to 80% in the presence of > 30% fatty infiltration[43]. However, in the presence of morbid obesity (defined by a body mass index > 40 kg/m2), the sensitivity and specificity of ultrasound fall to 49% and 75%, respectively, possibly due to technical problems in performing ultrasound in such patients[44].
Whereas ultrasound is a useful technique for detecting hepatic steatosis, particularly in severe cases, it is unable to provide a precise determination of hepatic fat content. Grading of hepatic fat content into broad categories (mild, moderate and severe steatosis) has been reported, using diagnostic criteria, based upon the visual assessment of hepatic echogenicity[3541424546]. However, all of the above studies found the grading of hepatic fat content using ultrasound to be somewhat subjective. In addition, the most recent ones showed that ultrasound is very poor at discriminating small changes in hepatic fat content. For example, Fishbein and colleagues suggested from their study that an individual with hepatic steatosis undergoing a reduction of MRI hepatic fat fraction from 40% to 20% through successful intervention, would be unlikely to have a corresponding alteration in ultrasound appearance[45].
The operator dependency of ultrasound, its inability to precisely quantify hepatic fat content, and its inability to detect small changes in liver fat with time, all potentially limit its use in longitudinal clinical studies.
Computerized tomography
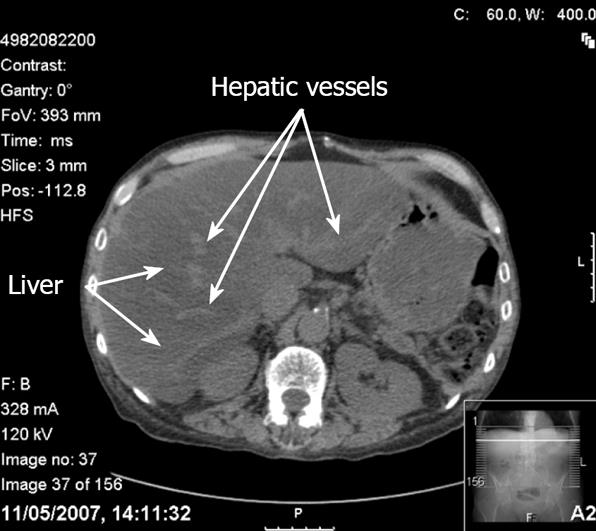
Contrast-unenhanced Computerized tomography (CT) is the most accurate CT technique used to detect and characterise hepatic steatosis[47]. The CT diagnosis of hepatic steatosis is made by measuring the difference in liver and spleen attenuation values in Hounsfield units[48]. In individuals without hepatic steatosis, the mean attenuation value for the liver is at least 4 Hounsfield units greater than for the spleen[48]. However, in subjects with hepatic steatosis, the mean attenuation value for the liver is lower than that for the spleen, so the liver appears darker than the spleen, rather than brighter. This lower attenuation of the liver in hepatic steatosis is thought to be secondary to the accumulation of lipids (triglycerides and cholesterol) within the hepatocytes[49]. With severe hepatic steatosis, there is more marked contrast between the liver and intrahepatic vessels. The increased brightness of the vessels relative to the liver parenchyma may erroneously suggest the use of contrast (Figure 2)[36].
Figure 2 CT findings in hepatic steatosis.
In this contrast unenhanced scan, the liver appears darker than the spleen and the hepatic vessels appear bright. The increased brightness of the vessels relative to the liver parenchyma may erroneously suggest the use of contrast.
Great care should be taken in diagnosing fatty infiltration of the liver on contrast-enhanced CT scans because contrast injection rate and timing of measurements can significantly influence the optimal liver-minus-spleen attenuation difference for diagnosing fatty liver[5051]. It has been suggested that muscle, rather than spleen, may be a better qualitative standard of reference for diagnosing fatty liver on contrast-enhanced CT, and that fatty liver can be diagnosed if the liver has a lower attenuation value than muscle[52]. However, such a comparison works only if the degree of fatty infiltration is severe.
Although non-contrast-enhanced CT is very good for the qualitative diagnosis of macrovesicular steatosis of 30% or greater, there is conflicting evidence to as to whether or not it can accurately quantify hepatic fat content. Some studies have demonstrated that both the CT numbers for the liver and the ratio of CT numbers for the liver and the spleen show a good inverse correlation with the degree of steatosis seen on liver biopsy[475354]. Nevertheless, it should be noted that a more recent study by Park and colleagues concluded that the diagnostic performance of unenhanced CT for quantitative assessment of macrovesicular steatosis is not clinically acceptable[55]. In addition, CT scanning has the drawback of exposing subjects to ionizing radiation. The above two factors limit its potential use in longitudinal studies and in children.
Magnetic resonance imaging and proton magnetic resonance spectroscopy
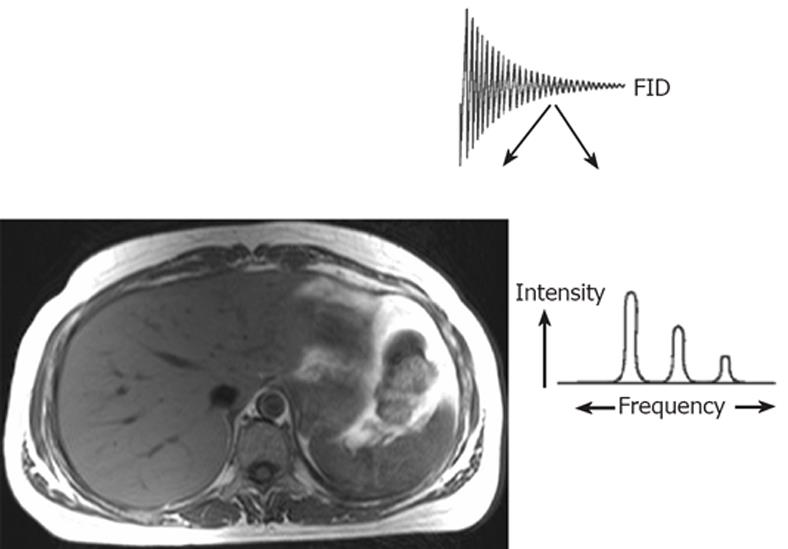
Principles of magnetic resonance imaging and spectroscopy: The nuclear magnetic resonance (NMR) phenomenon was first reported by Bloch et al in 1946[56]. NMR techniques exploit the behaviour of certain atomic nuclei in an externally applied magnetic field. Magnetic resonance sensitive nuclei, such as hydrogen-1 (1H), carbon-13 (13C), nitrogen-15 (15N) and phosphorous-31 (31P) possess the quantum mechanical property of “spin”, a source of angular momentum intrinsic to nuclei with an odd mass number. When placed in a magnetic field they behave like magnetic dipoles, aligning parallel to or against the axis of the applied static magnetic field. When excited by irradiation with non-ionizing radiofrequency (rf) energy, this alignment of the nuclei is disturbed. During relaxation following excitation, the nuclei return to their original orientation, giving off a radiofrequency signal, which may then be detected by a receiver coil. This signal, known as the free induction decay (FID), can be resolved by a computer-based mathematical process known as Fourier transformation into either an image, providing anatomical information (MRI) or a frequency spectrum, providing biochemical information (MRS)[5758], as shown in Figure 3.
Figure 3 Principles of magnetic resonance.
The magnetic resonance (MR) signal or free induction decay (FID) may be converted by the mathematical process of Fourier transformation to form anatomical information (MR imaging) or localised biochemical information (MR spectroscopy). Modified from Taylor-Robinson SD Applications of magnetic resonance spectroscopy to chronic liver disease. Clin Med 2001; 1: 54-60 Copyright © 2001 Royal College of Physicians. Adapted by permission.
MAGNETIC RESONANCE IMAGING
Nuclei from individual metabolites resonate at a given, but unique frequency, depending on the molecular structure of each compound. This is known as chemical shift and occurs because nuclei in different chemical environments experience slightly different magnetic field strengths. This variation in magnetic field strength results from the intrinsic “shielding” offered by the nearby electrons, which partially counteract the force of the main magnetic field. For example, the hydrogen nuclei in water (O-H bond) have less surrounding electrons than the hydrogen nuclei in lipid (C-H bond), so experience a slightly stronger magnetic field and, as a result, rotate at a slightly higher resonance frequency. The differences are extremely small and are typically measured using the dimensionless unit, parts per million (ppm)[59].
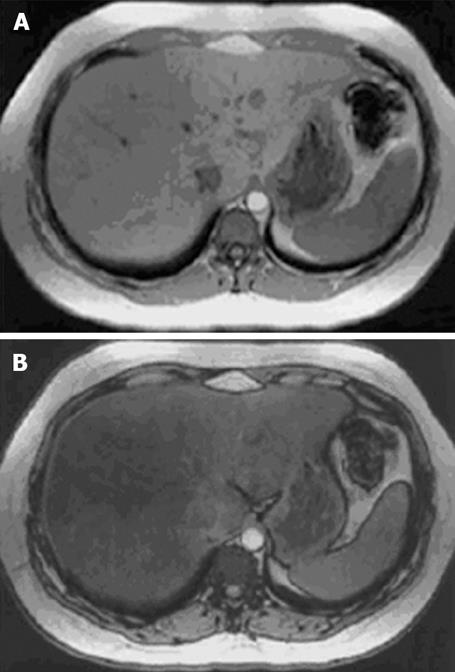
Chemical shift MR imaging utilises this difference in resonance frequency of water and lipid to differentiate tissues containing only water from those containing both water and lipid[60], as illustrated in Figure 4.
Figure 4 In and opposed phase MR images of a liver illustrating the signal drop-off from an in-phase (A) to an opposed-phase image (B) in a patient with marked steatosis.
Reproduced from Rinella et al. Liver Transplantation 2003; 9: 851-856. Copyright (2003) American Association for the Study of Liver Diseases. Reprinted with permission of Wiley-Liss, Inc., a subsidiary of John Wiley & Sons, Inc.
Applying this principle, Dixon developed a modified spin echo technique, now widely known as the Dixon method[61]. Using this technique, Lee and co-workers scanned the livers of five humans, two healthy volunteers with no evidence of liver disease and three patients with CT evidence of fatty infiltration of the liver[62]. In the subjects with CT evidence of hepatic fatty infiltration, there was a notable loss of signal intensity on the out-of-phase images (because opposing signals from water and lipid tended to cancel each other out), and a less appreciable increase in signal intensity on the in-phase images. In contrast, in the healthy volunteers without hepatic steatosis, the signal intensity of the liver parenchyma was not altered between in-phase and out-of-phase images. They concluded that the Dixon method was capable of distinguishing fatty liver from normal liver, and that it might also be useful for the quantification of liver fat. Using the same technique, Heiken and colleagues scanned the livers of 35 subjects (12 healthy volunteers and 23 patients with CT evidence of fatty infiltration of the liver)[63]. They demonstrated the Dixon method to be a clinically useful technique for detecting and quantifying fatty infiltration of the liver and for differentiating non-uniform fatty infiltration from liver metastases[63]. However, this methodology has its limitations. It was time-consuming, and the quality of the images obtained was affected by respiratory and other motion artefacts, as well as by magnetic field inhomogeneities[6164].
Since these early studies, many researchers have developed modifications of the Dixon method with the aim to reduce these limitations. Levenson and colleagues used the technique to quantify hepatic fat in 16 subjects with a variety of liver abnormalities, and compared the imaging results with those from liver biopsies[65]. The results were reproducible and there was reasonably good correlation between the imaging and biopsy findings[65]. In pursuit of a quick, accurate, non-invasive evaluation of hepatic steatosis, Fishbein and co-workers developed a fast gradient echo technique, which allowed them to obtain images of the liver in both adults and children, using breath holding manoeuvres[66]. This technique not only reduced the time taken for the scan, but had the advantage of reducing motion artefact due to respiration. Using the same scanning sequence, these authors compared hepatic MRI with ultrasound and liver biopsy in quantifying hepatic fat in 38 patients with a variety of liver diseases[45]. Both MRI and ultrasound assessment of steatosis severity correlated well with liver histology, but MRI was superior to ultrasound in detecting and quantifying minor degrees of hepatic steatosis. Several other groups have also demonstrated a good correlation between the severity of hepatic steatosis on MRI and liver biopsy[67–69]. Recently, Qayyum and colleagues studied 27 patients, 16 with cirrhosis, and compared two different MRI techniques in quantifying hepatic fat. Their preliminary results suggested that liver fat may be more accurately quantified with fat-saturated fast spin-echo MR imaging than with out-of-phase gradient echo MR imaging, especially in patients with cirrhosis[70].
Further modifications continue to be made to the Dixon method for water and fat separation, such as the recently reported fast spin-echo triple-echo Dixon (fTED) technique, which enables both uniform water/fat separation and fast scanning with uncompromised scan parameters[71]. Thus, in the future, chemical shift MRI is likely to provide an accurate, safe and fast method of detecting and quantifying hepatic steatosis in both adults and children.
PROTON MAGNETIC RESONANCE SPECTROSCOPY
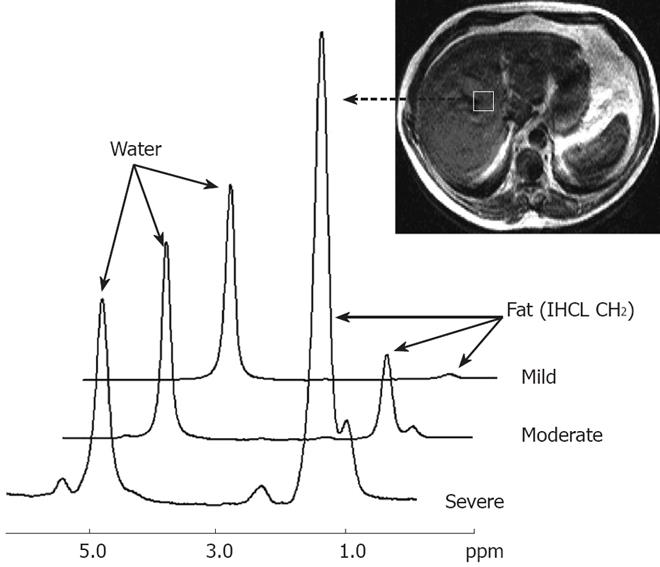
Chemical shift magnetic resonance imaging enables the identification of tissues that contain a significant proportion of intracellular lipid. In contrast, proton magnetic resonance spectroscopy (1H MRS) facilitates the examination of the resonance frequencies of all hydrogen nuclei (protons) within a region of interest. Although the absolute differences in resonance frequencies in MRS are quite small, they can be separated out to form a spectrum. Frequency separation, and hence spectral resolution, is determined by the strength of the main magnetic field. The MR spectra are plotted on an axis of chemical shift. With MR spectroscopy, the concentration of any given molecule in a sample is represented by the area under the specific resonance peak within the spectrum. Quantification of hepatic fat using proton MR spectroscopy requires evaluation of the two dominant peaks within the unsuppressed MR spectrum, water at 4.7 ppm and lipid at 1.0-1.5 ppm[59]. Livers with fatty infiltration demonstrate an increase in the intensity of the lipid resonance peak as shown in Figure 5.
Figure 5 Proton magnetic resonance spectra from three volunteers showing progressive degrees of hepatic fatty infiltration.
Resonances from water and lipid (IHCL CH2) can be clearly seen. For each individual hepatic fatty infiltration was quantified using the equation: -Percentage fat = IHCL CH2 peak area/Water peak area × 100. Shown are spectra from a liver with very mild fatty infiltration (1.0%), a liver with moderate fatty infiltration (10.2%), and a liver with severe fatty infiltration (74.9%). Adapted from Thomas et al. Gut 2005; 54: 122-127, with permission from the BMJ Publishing Group.
Since proton magnetic resonance spectroscopy allows direct measurement of the area under the lipid resonance, it can be used to provide a quantitative assessment of fatty infiltration of the liver. Allowance must be made for both T1 and T2 relaxation effects, which differ for lipid and water. A correction must also be made for unsaturated lipids, as a portion of the MR signal from these molecules overlaps with the water resonance at 4.7 ppm[59].
Allowing for these corrections, Longo and colleagues studied a population of subjects with non-alcoholic fatty liver disease and found the percentage hepatic lipid measurements using 1H MRS correlated well with those obtained by CT and liver biopsy[5472]. Thomsen and co-workers demonstrated similar results in patients with alcohol-induced fatty liver disease[73]. Since then, several other studies have shown 1H MRS to be a fast, safe, non-invasive method for the quantification of hepatic fat content[74–78]. Recently, 1H MRS has been used in a large United States population study to determine the prevalence of non-alcoholic fatty liver disease in the general adult population[79] and also in longitudinal clinical studies[80–84]. However, in most centres 1H MRS remains largely a research tool, despite the fact that all commercially available MR scanners have MRS capabilities.
CONCLUSION
Non-alcoholic fatty liver disease (NAFLD) is now recognized as the most common cause of chronic liver disease in the Western World[31]. Its prevalence will likely increase in the future in parallel with the predicted increase in obesity and Type 2 diabetes. Currently, the only proven treatments for this condition are lifestyle measures, such as dietary modification and exercise[8285–87].
Liver biopsy remains the gold standard investigation for determining hepatic fat deposition, but it is an invasive procedure and may be prone to sampling error.
Of the non-invasive imaging techniques used to detect fatty infiltration of the liver, ultrasound is the most widely used in clinical practice today. It will remain popular in the future due to its widespread availability and excellent tolerability. Magnetic resonance techniques using chemical shift imaging and in vivo1H MRS have an advantage over ultrasound in that they are able to detect small changes in liver fat content. They can be performed as an adjunct to whole body MRI, as part of the same examination, allowing a comparison to be made between hepatic fat content and whole body adipose tissue distribution in the same subject. Thus, in the future, as more technological advances are made and scanning times shorten further, it is anticipated that both techniques will be used much more widely, both in longitudinal clinical research studies, but also in clinical practice.
Supported by Grants from the Novo Nordisk UK Research Foundation (supporting S.R.M), Pfizer Global Research and Development (Sandwich, UK), the British Medical Research Council and the United Kingdom Department of Health Research and Development Initiative


