Copyright
©2008 The WJG Press and Baishideng.
World J Gastroenterol. Jan 14, 2008; 14(2): 236-242
Published online Jan 14, 2008. doi: 10.3748/wjg.14.236
Published online Jan 14, 2008. doi: 10.3748/wjg.14.236
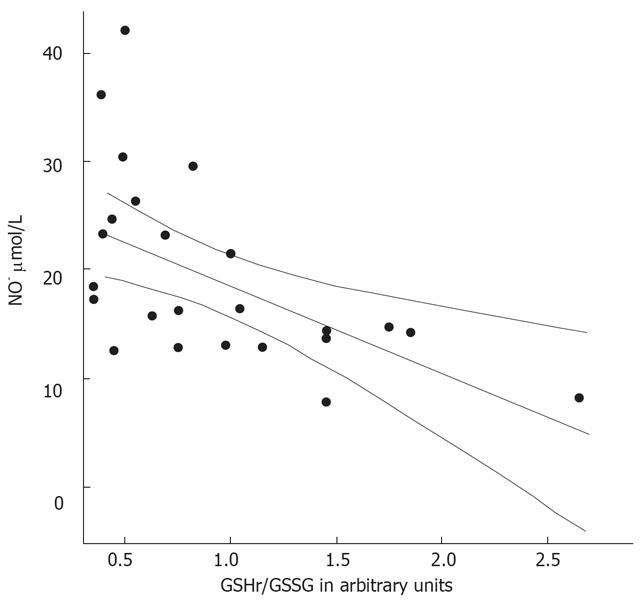
Figure 8 Correlation between NO• levels and GSHr/GSSG ratios.
Linear regression with 95.00% mean prediction interval, bP < 0.01; NO•&mgr;mol/L = 26.52 + -7.99; R-Square = 0.31.
- Citation: Siqueira C, Moura MC, Pedro AJ, Rocha P. Elevated nitric oxide and 3’,5’ cyclic guanosine monophosphate levels in patients with alcoholic cirrhosis. World J Gastroenterol 2008; 14(2): 236-242
- URL: https://www.wjgnet.com/1007-9327/full/v14/i2/236.htm
- DOI: https://dx.doi.org/10.3748/wjg.14.236


