Published online Jun 28, 2007. doi: 10.3748/wjg.v13.i24.3333
Revised: March 13, 2007
Accepted: March 21, 2007
Published online: June 28, 2007
AIM: To establish models of portal vein occlusion of hepatic VX2 tumor in rabbits and to evaluate the value of multi-slice CT.
METHODS: Forty New Zealand rabbits were divided into 4 groups according to digital table: Immediate group (group A; transplantation of tumor immediately after the portal vein occlusion), 3-wk group (group B; transplantation of tumor at 3 wk after the portal vein occlusion), negative control group (group C) and positive control group (group D), 10 rabbits in each group. Hepatic VX2 tumor was transplanted with abdominal-embedding innoculation immediately after the portal vein occlusion and at 3 wk after the portal vein occlusion. Meanwhile, they were divided into negative control group (Left external branch of portal vein was occluded by sham-operation, and left exite was embedded and inoculated pseudoly) and positive control group (Transplanted tumor did not suffer from the portal vein occlusion). All rabbits were scanned with multi-slice CT.
RESULTS: All 40 animals were employed in the final analysis without death. Tumor did not grow in both immediate group and 3-wk group. In 3-wk group, left endite was atrophied and growth of tumor was inhibited. The maximal diameter of tumor was significantly smaller than that in positive control group (2.55 ± 0.46 vs 3.59 ± 0.37 cm, t = 5.57, P < 0.001). Incidences of metastasis in the liver and lung were lower in 3-wk group than those in positive control group (10% vs 40%, and 90% vs 100%, respectively). The expression intensities of the vascular endothelium growth factor (VEGF) in groups A, B, C and D were 0.10 ± 0.06, 0.66 ± 0.21, 0.28 ± 0.09 and 1.48 ± 0.32, respectively. VEGF expression level in the test group A was significantly lower than that in the negative control group C (t = 5.07; P < 0.001). In addition, VEGF expression in the test group B was significantly lower than that in the positive control group D (t = 6.38; P < 0.001). Scanning with multi-slice CT showed that displaying rate of hepatic artery branches was obviously lower in grade III (40%) than that in gradeI(70%) and II (100%) (P < 0.05); but there was no significant difference in displaying rate of the portal vein at various grades. Values of blood flow (BF) of the liver, blood volume (BV), mean transit time (MTT) and permeability of vascular surface (PS) were lower in the immediate group and 3-wk group than those in control groups, but values of hepatic arterial fraction (HAF) were increased. Significant positive correlations were existed between BF and BV (r = 0.905, P < 0.01), and between BF and PS (r = 0.967, P < 0.01), between BV and PS (r = 0.889, P < 0.01). A significant negative correlation existed between PV and HAF (r = -0.768, P < 0.01), between PS and HAF (r = -0.557, P < 0.01). The values of BF, BV and PS had a positive correlation with VEGF (rBF = 0.842, rBV = 0.579, rPS = 0.811, P < 0.01) . However, there was no significant correlation between the values of MTT and HAF and the VEGF expression (rMTT = 0.066, rHAF = -0.027).
CONCLUSION: Ligating the left external branch of portal vein is an ideal way to establish models of portal vein occlusion in rabbits with hepatic VX2 tumor. Multi-slice CT plays a key role in evaluating effect of portal vein occlusion.
- Citation: Qi YY, Zou LG, Liang P, Zhang D. Establishing models of portal vein occlusion and evaluating value of multi-slice CT in hepatic VX2 tumor in rabbits. World J Gastroenterol 2007; 13(24): 3333-3341
- URL: https://www.wjgnet.com/1007-9327/full/v13/i24/3333.htm
- DOI: https://dx.doi.org/10.3748/wjg.v13.i24.3333
Clinical researches have found that portal vein occlusion is beneficial to inhibit growth of hepatocarcinoma, promote compensatory hyperplasia of un-blocking hepatic tissue and decrease metastasis of portal vein occlusion. However, it should be further proved by animal experiments[1,2]. This study was designed to investigate the models of portal vein occlusion of hepatic VX2 tumor in rabbits and to evaluate value of multi-slice CT.
The experiment was carried out in Department of Radiology of Xinqiao Hospital of the Third Military Medical University of Chinese PLA from July 2004 to July 2006. Forty New Zealand rabbits of both genders, weighing 2.0-3.0 kg, were provided by Experimental Animal Center of the Third Military Medical University of Chinese PLA [Certification: SYXK (army) 2004-031]. All animals were divided according to digital table into 4 groups: Immediate group (group A; transplantation of tumor immediately after the portal vein occlusion), 3-wk group (group B; transplantation of tumor at 3 wk after the portal vein occlusion), negative control group (group C) and positive control group (group D), each group consisting of 10 animals.
Establishment of experimental models: VX2 cancer was inoculated into the muscles in the inguinal region. Three or 4 wk later, the rabbits with VX2 epidermoid carcinoma developed in the legs were anesthetized with 30 mg/kg soluble pentobarbitone. Then, under sterile condition, tumor was stripped to obtain hoary fish-meat-like tissue near to envelope. The sample tissues were put into sterile saline to remove necrosis tissue and fiber tissue and cut into pieces of 1.0-2.0 mm3 with eye scissors.
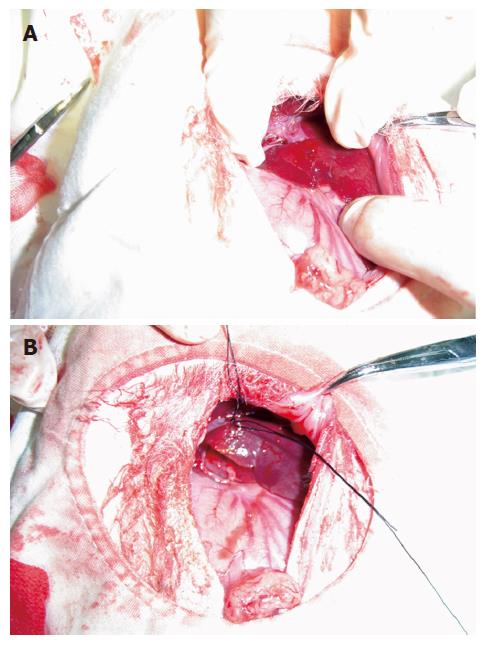
Experimental methods: Rabbits were divided into four groups as follows: (1) Immediate group (group A): After anesthesia, all limbs of rabbits were fixed on domestic operative table at supine position. Under all aseptic precautions, a 2-cm midline incision in the epigastric region was given, and the liver was exposed by opening the abdomen in layers. Left exite of the liver was exposed and origin of the left external branch of the portal vein was bluntly separated; and then, the proximal and distal tips were ligated and blocked. Color of the left liver was observed; when color of the left external liver was darkened, the left external branch of the portal vein was blocked completely (Figure 1A and B). Hepatic VX2 tumor was transplanted with abdominal-embedding innoculation. Eye forceps were used to cut hepatic tissue near the thick part of left exite. A tumor mass was transplanted into a flask-like incision with 3-5-mm mouth and 5-8-mm fundus, gelatin sponge was used for hemostasis, and aperture was purse-string sutured. Then the exposed liver was returned to the abdominal cavity and abdomen was closed in layers. Multi-slice CT was done 3 wk later. (2) 3-wk group (group B): Hepatic VX2 tumor was transplanted with abdominal-embedding innoculation as aforementioned. Three weeks later, the left external branch of portal vein of successfully transplanted samples was blocked completely with the same method mentioned above. Multi-slice CT was done 2 wk later. (3) Negative control group (group C): Left external branch of portal vein was done sham-operative block, and left exite was embedded and inoculated pseudoly. (4) Positive control group (group D): Left external branch of portal vein underwent sham-operation block and other processes were the same as in the 3-wk group.
Multi-slice CT examination: Rabbits were fasted for 12 h and detained needle (24 GA × 0.75 IN) was inserted into ear-border vein before scanning. GE lightspeed 16 CT scanning apparatus and MEDRAO Vistron CTTM hypertensive injection syringe were used for examination. After anesthesia, rabbits were fixed on board at supine position and pricked their abdominal bandage to reduce movement artifact. Plain scan of multi-slice CT was performed using the parameters as follows: 80 kV tube voltage, 80 kV tube current, 512 × 512 matrix, and 2.5-mm section thickness. For vascular imaging of multi-slice CT, 4-6 mL of Ioversol, a contrast medium [Optiray, Mallinckrodt Medicine Co. Ltd., USA, 320 g(I)/L], was administered with hypertensive injection syringe at 2.0 mL/s; meanwhile, samples were scanned from head to foot and from diaphragm to 2 cm below the liver. Scanning parameters included thickness of selective by 2.5 mm, thickness of rebuilding by 1.25 mm, rebuilding interval 0.65 mm, successively scanning with 16-row detector, bed shift 27.5 mm with one convolution of stock, ratio of snail space 1.325:1, non-tilt scan, tube voltage 80 kV, tube current 130 kV, matrix 512 × 512 and scanning sight 12-16 cm. Arterial phase scanning started 7 s after injection of contrast medium; 13 s during portal venous phase; 50 s during delayed phase. Plain scan of multi-slice CT perfusion: Four close layers of tumor were regarded as the perfused layers; 1 mg/kg anectine chloride was pushed with detained needle; and Toggling-table technique of multi-slice CT was used to scan the four layers during respiratory depression; 4 mL of contrast medium was injected with injection syringe at 2.0 mL/s and scanning started 1 s after the injection. Figures were collected as film pattern for 50 s. Scanning parameters were as follows: Thickness of selective by 2.5 mm/4i, thickness of rebuilding by 5 mm, successively scanning with 16-row detector, bed shift 27.5 mm with one convolution of stock, ratio of snail space 1.325:1, non-tilt scan, tube voltage 80 kV, tube current 130 kV, matrix 512 × 512 and scanning sight 12-16 cm.
Post-processing after multi-slice CT: Three scanning figures were transmitted to AW4.2 workstation by local network. Figures during periods of the hepatic artery and portal vein scanning were selected from each rabbit for recovery of volume, projection of maximal density and multi-planar reformation. On the basis of target vessels, volume rendering was convoluted and cut at 360° through regulating width of window, position of window, brightness and diaphaneity. Projection of maximal density was obtained on the basis of volume rendering. According to course of vessels, all sections were rebuilt planarly but coronal site was mainly reconstructed. Statistics of branch of the hepatic artery showed that the proper hepatic artery was regarded as branchI, left and right hepatic arteries as branch II, and other hepatic arteries as ≥ branch III. Similarly, trunk of portal vein was regarded as branchI, left and right portal veins as branch II, and other portal veins as ≥ branch III. Volume rendering, projection of maximal density and multi-planar reformation were combined with each other during multi-slice CT scanning, and samples with the best quality and the most branches were included. Data were dealt with perfusion 3.0 software package with deconvolution method, and blood flow (BF) of the liver, blood volume (BV), mean transit time (MTT), permeability of capillary vessel surface (PS) and fraction of hepatic arterial fraction (HAF) were calculated to obtain perfusing figures of each parameter.
Seldinger’s technique was adopted to puncture the femoral artery and superior mesenteric vein of the alive rabbits after MSCT perfusion scan, and 3F micro-catheter was used to catheterize rabbit’s hepatic artery to perform hepatic arteriography. Direct portography was performed via the superior mesenteric vein at the time and after hepatic arteriography. In all rabbits, hepatic artery and portal vein perfusions were performed by injecting a contrast medium suspension containing barium sulfate and saline (1:3). The displaying rates of theI, II and ≥ III branches of the hepatic artery and the portal vein with multi-slice CT angiography (MSCTA), digital subtraction angiography (DSA) and vascular perfusion techniques were calculated, respectively,especially the ligature of the branch of portal vein.
The body weight, metastasis and maximum diameter of the implanted tumor were observed and measured at autopsy of the all rabbits. To match with the lesion seen on the MSCT perfusion imaging, the partial tumors were taken out for pathological examination. All specimens were stained with hematoxylin and eosin (HE), and VEGF expression in the tumors was examined using immunohistochemistry. The correlation between the parameters of MSCT perfusion and the staining intensity of VEGF was analyzed using a computer-assisted image analyzer.
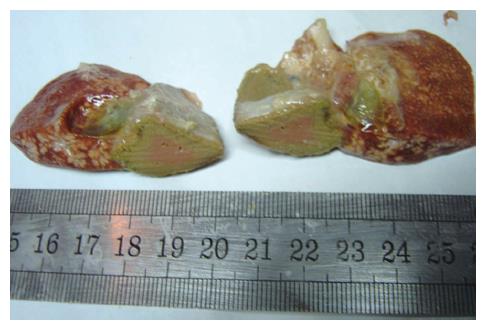
All 40 animals were utilized in the final analysis without any loss. Animals in the immediate group and negative control group had normal behaviors before death, including appearance, activity, diet, body mass and hair. Tumor did not grow in the immediate group after 3 wk. The left exite showed a decreased size with hard consistency (Figure 2). In addition, left exite was adherent to left endite or stomach wall; however, volumes of other hepatic lobes were bigger in group A than that in negative control group. In 3-wk group, left endite was atrophied and growth of tumor was inhibited; and the maximal diameter of tumor was smaller than that in positive control group.
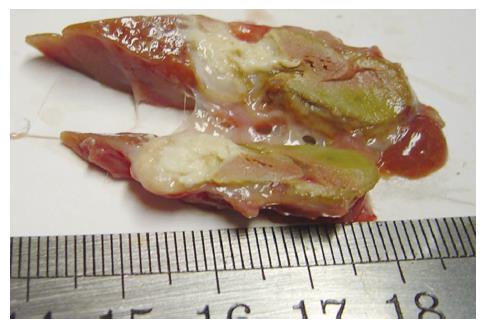
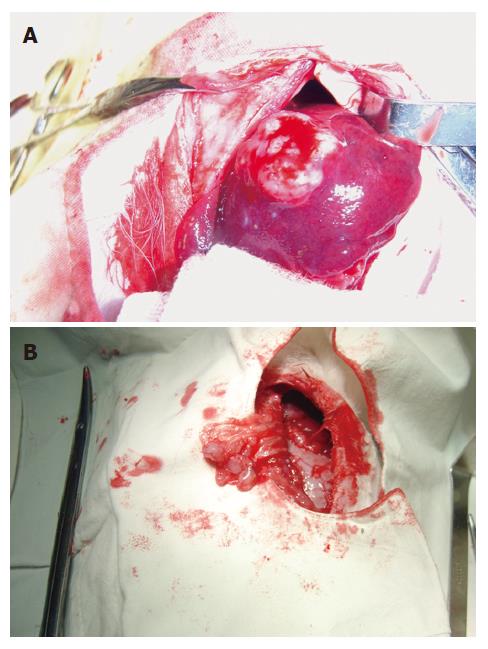
Tumor grew successfully with a rate of 100% (20/20) both in 3-wk group and positive control group after inoculation of hepatic VX2 tumor. Except 4 animals in 3-wk group and 10 in positive control group, who were found to have indifferent mood, bradykinesia, reductive diet, decreased body mass and disheveled hair before death, other 6 in 3-wk group showed normal behaviors. In 3-wk group, tumors were hoar, and 8 animals had necrosis of tumor tissue (Figure 3). In positive control group, tumors were hoar, hard with expansive growth, and 4 rabbits had necrosis of tumor tissue. Numerous tumor-induced vessels were observed and envelope was not obvious. Examination of corpses showed that volume of left endite was decreased, hepatic tissue was shrunk and growth of tumor was inhibited obviously in 3-wk group, and maximal diameter of tumor was markedly smaller than that in positive control group (t = 5.57, P < 0.001). Incidences of metastasis in the liver and lung were insignificantly lower in 3-wk group than those in positive control group (Table 1). Metastasis in the mesentery and omentum appeared as swollen lymph node; metastasis in the diaphragm muscles appeared as widespread nod-like guava seed, especially in the left diaphragm; metastasis in the bilateral lungs appeared as widespread hoar granulations (Figure 4A and B). Uprightness hydroperitonia of chest was observed in 5 animals of 3-wk group and 9 of positive control group.
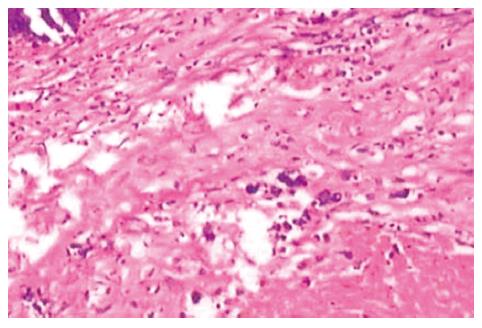
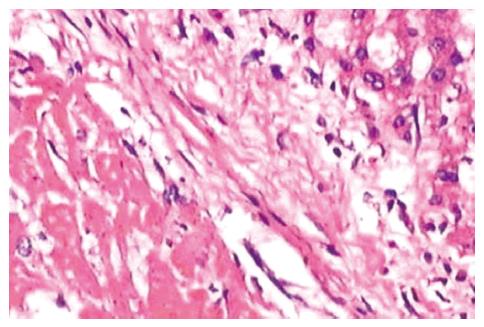
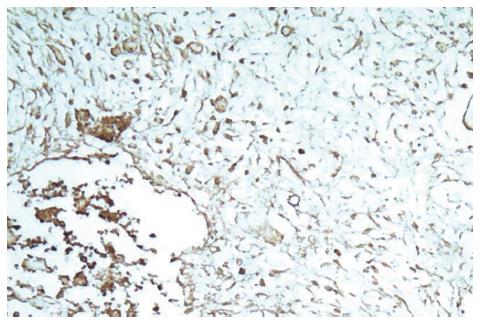
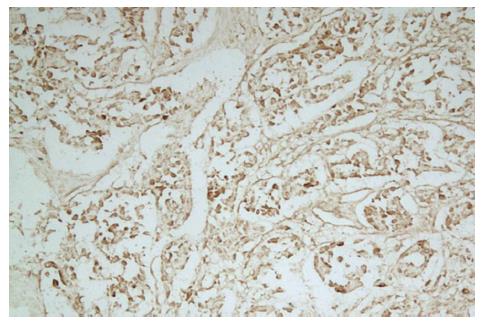
On microscopic examination 3 wk after the portal branch ligation, no tumor was found to grow in any rabbits of group A. The left external lobe shrank, became harder, appeared darker in color, and sealed by adhesions to the left internal lobe or to the stomach. In contrast, the other liver lobes of rabbits in group A were increased in size as compared with those in group C. The liver tissue of the left external lobe underwent coagulation necrosis, and was stained homogenously red using hematoxylin-eosin staining (Figure 5). The histologic appearance of these lesions of group B included marked proliferation of collagen fibers, among which only scattered tumor cells were noted in 6 cases. The tumors were completely necrotic, and no viable tumor cell was seen under microscope in 2 out of 10 rabbits of group B (Figure 6). The remaining 2 rabbits had more survival tumors with many small necrosis foci. The expression intensities of the VEGF in groups A, B, C and D were 0.10 ± 0.06, 0.66 ± 0.21, 0.28 ± 0.09 and 1.48 ± 0.32, respectively (Figures 7 and 8). VEGF expression level in the test group A was significantly lower than that in the negative control group C (t = 5.07; P < 0.001). Moreover, VEGF expression level in the test group B was significantly lower than that in the positive control group D (t = 6.38; P <0.001) (Table 2).
| Group | VEGF | t | P |
| Group A | 0.10 ± 0.06 | 5.07 | 0.00 |
| Group C | 0.28 ± 0.09 | ||
| Group B | 0.66 ± 0.21 | 6.38 | 0.00 |
| Group D | 1.48 ± 0.32 |
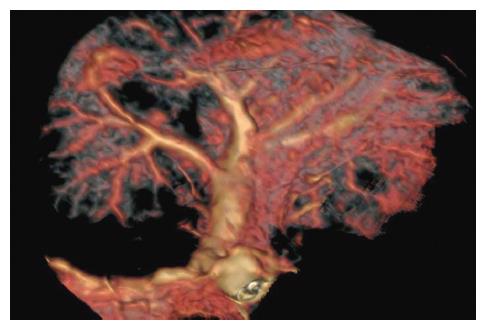
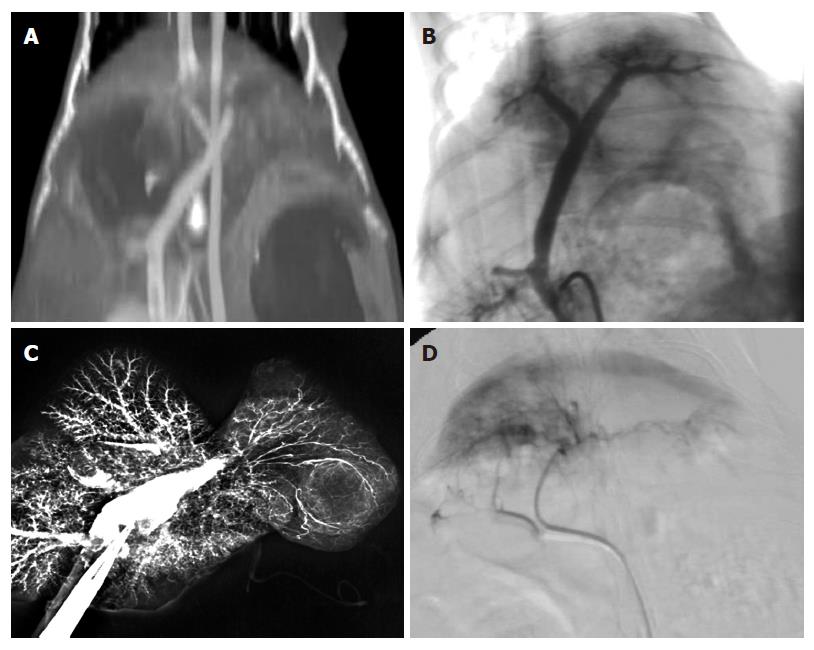
The success rates of MSCTA, DSA and vascular perfusion of the hepatic artery and portal vein are shown in Table 3 and Figure 9. The success rate of hepatic arterial examination by DSA was significantly lower than that by MSCTA (85% vs 100%, P < 0.05), but there was no significant difference in the other examinations of the hepatic artery and portal vein. As shown in Table 4, the total displaying rate of the branch ≥ III of the hepatic artery by MSCTA (40%) was significantly lower than that ofIand II branches of the hepatic artery (100% and 70%, respectively) (P < 0.05), and was significantly lower than that by DSA and the vascular perfusion (88.24% and 75.77%,respectively) (P < 0.01). However, there was no obvious difference in the displaying rate of the portal vein among examinations by MSCTA, DSA and the vascular perfusion (Table 5). Scanning with multi-slice CT showed that the displaying rate of the hepatic artery branches was markedly lower in grade III than that in gradeIand II (P < 0.05); but there was no significant difference in displaying rates of the portal vein among various grades. The imaging shows distortion and tenuity of the hepatic artery. The results proved that vessels were not formed at collateral portal vein (Figure 10A-D). Branches of the portal vein of normal rabbits were widely distributed and the border was clear.
| MSCTA | DSA | Vascular perfusion | |
| Hepatic artery | 100% (40/40) | 85% (17/20)1 | 97.3% (36/37) |
| Portal vein | 100% (40/40) | 95% (19/20) | 97.4% (38/39) |
| Grade | MSCTA(n = 40) | DSA(n = 17) | Vascular perfusion(n = 33) |
| GradeI | 100 (40/40) | 100 (17/17) | 97.0 (32/33) |
| GradeII | 70 (28/40) | 100 (17/17) | 90.9 (30/33) |
| ≥ GradeIII | 40 (16/40) | 88.24 (15/17) | 75.77 (25/33) |
| Grade | MSCTA(n = 40) | DSA(n = 19) | Vascular perfusion(n = 38) |
| GradeI | 100 (40/40) | 100 (19/19) | 100 (38/38) |
| GradeII | 100 (40/40) | 94.7 (18/19) | 100 (38/38) |
| ≥ GradeIII | 100 (40/40) | 89.5 (17/19) | 100 (38/38) |
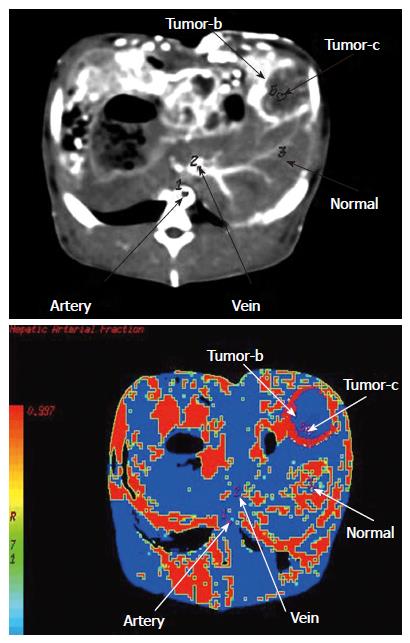
The time-density curve (TDC) of the abdominal aorta and portal vein showed rapid rise and drop, fast rise and drop, respectively. The TDCs of liver parenchyma in negative control group C showed slow up and down, while there was a slight enhancement of liver parenchyma of the left external lobe in the test group A, which was washed out quickly. In the positive control group D, the hepatic tumor enhanced intensely and washed out quickly, while the TDCs of the hepatic tumor in the test group B showed rapid rise and drop. Comparison of parameters of multi-slice CT is shown in Table 6. In the immediate group and 3-wk group, values of blood flow of the liver, blood volume, mean transit time and permeability of vascular surface were decreased but values of HAF were increased than those in the control groups (Figures 11 and 12).
| CT-perfused parameter | Group A | Group B | Group C | Group D |
| Blood flow in per 100 g hepatic tissue (mL/min) | 1.40 ± 0.70 | 48.76 ± 7.31 | 133.21 ± 14.42b | 296.53 ± 39.62d |
| Blood volume in per 100 g hepatic tissue (mL) | 0.33 ± 0.17 | 3.33 ± 0.53 | 28.77 ± 3.32b | 30.64 ± 3.32d |
| Mean transit time (s) | 4.33 ± 1.41 | 14.7 ± 1.66 | 11.67 ± 0.58b | 6.79 ± 0.85d |
| Permeability of vascular surface in per 100 g hepatic tissue (mL/min) | 0.15 ± 0.18 | 11.71 ± 2.33 | 22.10 ± 4.39b | 36.16 ± 5.91d |
| Hepatic arterial infusion | 0.99 ± 0.03 | 0.99 ± 0.02 | 0.25 ± 0.06b | 0.63 ± 0.01d |
Significant correlations between various MSCT per-fusion parameters were observed in this study (Table 7). A significant positive correlation existed between BF and BV (r = 0.905, P < 0.01), between BF and PS (r = 0.967, P < 0.01), and between BV and PS (r = 0.889, P < 0.01). A significant negative correlation existed between PV and HAF (r = -0.768, P < 0.01), and between PS and HAF (r = -0.557, P < 0.01). The values of BF, BV and PS had a positive correlation with VEGF (rBF = 0.842, rBV = 0.579, rPS = 0.811, P < 0.01). However, no significant correlation of MTT and HAF with VEGF was observed (rMTT = 0.066, rHAF = -0.027).
If trunk of the portal vein of rats or dogs was ligated once, animals would die within several hours due to congestion or hemorrhage. However, Gaub et al[3] suggested that 90% portal vein was ligated, 14% animals died, and other rats could survive by compensation of the rest 10% hepatic tissue. During our pre-experiment, posterior branches of the portal vein of two rabbits were maintained, and they died within 24 h. When left branches were ligated, behaviors such as mood, activity and diet of the experimental rabbits were poorer than those of sham-operation rabbits in the first 4 d after operation, and the symptoms recovered within the next 5 d. However, after ligation of left exite, the behaviors were not changed remarkably. In this study, we found that the portal vein consisted of thick superior mesenteric vein, inferior mesenteric vein and thin splenic vein. About 1.0-2.0 cm away from the right posterior branch, a thin caudate lobe was branched. Right anterior branch and left internal branch of the portal vein were circled by hepatic tissue; therefore, it was not an ideal site for ligation. However, left exite and left endite were separated naturally. Partial left exites were located below the xiphoid process and easy to inoculate.
In this study, left external branch of the portal vein of 24 rabbits was not circled by hepatic tissue, and that of remaining 16 rabbits was circled by a little hepatic tissue but it was easy to separate. Twenty rabbits underwent portal vein ligation, but no one died during the operation. So we thought that ligation of left external branch might be an ideal model to study on portal vein occlusion. Some researches showed that complete proximal occlusion by ligation of right branch of the portal vein was similar to distal occlusion by a mixture of lipiodol and ethanol to cause liver lobes atrophy, thereby suggesting that ligation of branch of the portal vein could simulate portal vein occlusion well, completely block the liver lobes dominated by target branches and avoid the experimental effects caused by hematological diffusion of contiguous portal vein. Ligation of left external branch was beneficial to investigate the effect of portal vein occlusion on blood supply of hepatic VX2 tumor. In our study, the portal vein occlusion at the time of tumor implantation could completely inhibit the growth of hepatic VX2 tumor in rabbits. Moreover, the portal vein occlusion after 3 wk of the tumor implantation could effectively inhibit the growth of hepatic VX2 tumor in rabbits.
Vascular-imaging displaying rate of multi-slice CT mainly included volume rendering (VR), maximum intensity projection (MIP) and multiplanar reformation (MPR)[4-7]. VR used nearly complete data to remain primitive relationship of spatial dissection; otherwise, quality of image was good, third dimension was strong, and artifact was few. However, vessels which needed to reconstruct were different from density of peripheral tissue. MIP was imaged with the maximal density of data, and the applied rate was less than 10%. Reconstructed time was short, and it could reflect difference of density, distinguish calcification and reinforcement of vessels; however, third dimension was poor and spatial relationship was not satisfied. MPR was processed with planar technique of spontaneous coronal and arrowed sections; horizontal axial surface could show complex anatomic structure. However, it did not have third dimension; therefore, it should be combined with VR and MIP to observe course of target vessels. The combinations of VR, MIP and MPR could well show branches and course of the hepatic artery and portal vein, direct reflect details of spatial dissection, and surely evaluate blocking effect of the portal vein.
TDCs can directly reflect the characteristics of blood flow of hepatic VX2 tumor after the portal vein occlusion in rabbits. The BF, BV and PS of the MSCT perfusion parameters are well correlated with the expression intensity of the VEGF[8,9]. MSCT perfusion imaging may reflect the features of blood perfusion to evaluate the hemodynamic change in hepatic VX2 tumor after the portal vein occlusion in rabbits. Re-perfused CT scanning could directly reflect blood supply of local tissue and changes of hemodynamics through blood flow of liver, blood volume, mean transit time, permeability of vascular surface and fraction of HAF[10-22]. Total re-perfused volume was the blood flow in local region within unit time and was derived from initial value of impulse residue function. Blood flow was expressed as IRF which was represented as summarization of the hepatic artery and portal vein. Results in this study suggested that blood flow was the highest in positive control group, which was related to thicker tumor vessels or more accepted contrast medium. However, the decreasing values in other three groups caused blocked blood stream of the portal vein.
Mean transit time is the time of blood stream from artery to vein and calculated by immediate rejection of sham contrast medium and the first moment of IRF. The first moment of curve was expressed as y = f (t) which was determined as average value of t. Each t value was added according to f (t) to consist of total value of t × f (t), and then, divided total value of f (t), which was represented as IRF. The calculation was complex; therefore, it was not analyzed in details. Mean transit time of portal vein occlusion was shorter in the immediate group than that in negative control group. The reasons were that hepatic tissue of left exite was shrunk, necrotized and fibrosed after ligation and produced a few interstitial microvessels so as to inhibit slow circulation of hepatic sinuses of normal hepatic tissue from artery to vein and accelerate blood stream through interstitial microvessels[23]. Otherwise, mean transit time of the portal vein occlusion was longer in the 3-wk group than that in the positive control group. Circulation in hepatic tumor under normal condition was from the hepatic artery, sham sinusoid, portal vein, hepatic vein (or artery to short circulation of portal vein) to inferior vena cava[24-26]. When branches of the portal vein were ligated, contrast medium was deposited in tumor; therefore, mean transit time would be prolonged, especially showing a significant difference between the hepatic artery and short circulation of portal vein in positive control group.
Blood volume meant distribution of contrast medium in unit hepatic tissue. It was mainly affected by vascular bed of tumor and status of internal blood. In this study, blood volume was the highest in the positive control group due to more vascular beds and slow blood stream in vascular pool or vascular lake which could accept more contrast medium. However, blood volume was lower in the immediate group and 3-wk group than that in the control groups due to the inhibition of contrast medium in the portal vein.
Permeability of vascular surface pointed to one-way transmission rate of contrast medium from blood capillary to intercellular space. The effective factors were permeability of local microvascular wall and pressure difference of lumen of microvessels. In this study, permeability of vascular surface was the highest in the positive control group due to dysplasia of vascular endothelium, uncompleted basement membrane and increased vascular permeability. There was large amount of blood supply in tumoral artery and the pressure in it was higher; however, due to portal vein occlusion, plenty of fiber tissue was produced in hepatic tissue or tumor so as to cause decrease of pressure difference in the immediate group and 3-wk group. In addition, atrophy of hepatic tissue and inhibition of tumor growth could also decrease blood flow in the liver; therefore, dosage of contrast medium was decreased in intercellular space per unit time.
HAF pointed to percentage of blood volume supplied by the hepatic artery and ranged from 0 to 1. In this study, HAF nearly reached 1 in the immediate group and 3-wk group after ligation, and this was related to blood volume supplied by other arteries except the hepatic artery.
In conclusion, ligating left external branch of the portal vein is an ideal way to establish models of portal vein occlusion in rabbits with hepatic VX2 tumor. Furthermore, multi-slice CT plays a key role in evaluating effect of portal vein occlusion.
S- Editor Liu Y L- Editor Kumar M E- Editor Ma WH
| 1. | Uenishi T, Kubo S, Hirohashi K, Tanaka H, Shuto T, Yamamoto T, Tanaka S, Ogawa M, Kinoshita H. A long-term survival case underwent repeated hepatic arterial infusion chemotherapy with portal branch ligation and wrapping of the liver using sheets for hepatocellular carcinoma. Hepatogastroenterology. 2002;49:1423-1424. [PubMed] |
| 2. | Nanashima A, Yamaguchi H, Shibasaki S, Morino S, Ide N, Takeshita H, Tsuji T, Sawai T, Nakagoe T, Nagayasu T. Relationship between CT volumetry and functional liver volume using technetium-99m galactosyl serum albumin scintigraphy in patients undergoing preoperative portal vein embolization before major hepatectomy: a preliminary study. Dig Dis Sci. 2006;51:1190-1195. [RCA] [PubMed] [DOI] [Full Text] [Cited by in Crossref: 35] [Cited by in RCA: 35] [Article Influence: 1.8] [Reference Citation Analysis (0)] |
| 3. | Gaub J, Iversen J. Rat liver regeneration after 90% partial hepatectomy. Hepatology. 1984;4:902-904. [RCA] [PubMed] [DOI] [Full Text] [Cited by in Crossref: 117] [Cited by in RCA: 120] [Article Influence: 2.9] [Reference Citation Analysis (0)] |
| 4. | Tanikake M, Shimizu T, Narabayashi I, Matsuki M, Masuda K, Yamamoto K, Uesugi Y, Yoshikawa S. Three-dimensional CT angiography of the hepatic artery: use of multi-detector row helical CT and a contrast agent. Radiology. 2003;227:883-889. [RCA] [PubMed] [DOI] [Full Text] [Cited by in Crossref: 36] [Cited by in RCA: 40] [Article Influence: 1.8] [Reference Citation Analysis (0)] |
| 5. | Takahashi S, Murakami T, Takamura M, Kim T, Hori M, Narumi Y, Nakamura H, Kudo M. Multi-detector row helical CT angiography of hepatic vessels: depiction with dual-arterial phase acquisition during single breath hold. Radiology. 2002;222:81-88. [RCA] [PubMed] [DOI] [Full Text] [Cited by in Crossref: 79] [Cited by in RCA: 71] [Article Influence: 3.1] [Reference Citation Analysis (0)] |
| 6. | Matsuki M, Tanikake M, Kani H, Tatsugami F, Kanazawa S, Kanamoto T, Inada Y, Yoshikawa S, Narabayashi I, Lee SW. Dual-phase 3D CT angiography during a single breath-hold using 16-MDCT: assessment of vascular anatomy before laparoscopic gastrectomy. AJR Am J Roentgenol. 2006;186:1079-1085. [RCA] [PubMed] [DOI] [Full Text] [Cited by in Crossref: 52] [Cited by in RCA: 53] [Article Influence: 2.8] [Reference Citation Analysis (0)] |
| 7. | Sakai H, Okuda K, Yasunaga M, Kinoshita H, Aoyagi S. Reliability of hepatic artery configuration in 3D CT angiography compared with conventional angiography--special reference to living-related liver transplant donors. Transpl Int. 2005;18:499-505. [RCA] [PubMed] [DOI] [Full Text] [Cited by in Crossref: 17] [Cited by in RCA: 18] [Article Influence: 0.9] [Reference Citation Analysis (0)] |
| 8. | Kanematsu M, Osada S, Amaoka N, Goshima S, Kondo H, Moriyama N. Expression of vascular endothelial growth factor in hepatocellular carcinoma and the surrounding liver: correlation with MR imaging and angiographically assisted CT. Abdom Imaging. 2006;31:78-89. [RCA] [PubMed] [DOI] [Full Text] [Cited by in Crossref: 2] [Cited by in RCA: 4] [Article Influence: 0.2] [Reference Citation Analysis (0)] |
| 9. | Kanematsu M, Osada S, Amaoka N, Goshima S, Kondo H, Nishibori H, Kato H, Matsuo M, Yokoyama R, Hoshi H. Expression of vascular endothelial growth factor in hepatocellular carcinoma and the surrounding liver: correlation with angiographically assisted CT. AJR Am J Roentgenol. 2004;183:1585-1593. [RCA] [PubMed] [DOI] [Full Text] [Cited by in Crossref: 18] [Cited by in RCA: 22] [Article Influence: 1.1] [Reference Citation Analysis (0)] |
| 10. | Fournier LS, Cuenod CA, de Bazelaire C, Siauve N, Rosty C, Tran PL, Frija G, Clement O. Early modifications of hepatic perfusion measured by functional CT in a rat model of hepatocellular carcinoma using a blood pool contrast agent. Eur Radiol. 2004;14:2125-2133. [RCA] [PubMed] [DOI] [Full Text] [Cited by in Crossref: 58] [Cited by in RCA: 61] [Article Influence: 2.9] [Reference Citation Analysis (0)] |
| 11. | Kojima H, Tanigawa N, Komemushi A, Kariya S, Sawada S. Computed tomography perfusion of the liver: assessment of pure portal blood flow studied with CT perfusion during superior mesenteric arterial portography. Acta Radiol. 2004;45:709-715. [RCA] [PubMed] [DOI] [Full Text] [Cited by in Crossref: 11] [Cited by in RCA: 10] [Article Influence: 0.5] [Reference Citation Analysis (0)] |
| 12. | Goh V, Halligan S, Hugill JA, Gartner L, Bartram CI. Quantitative colorectal cancer perfusion measurement using dynamic contrast-enhanced multidetector-row computed tomography: effect of acquisition time and implications for protocols. J Comput Assist Tomogr. 2005;29:59-63. [RCA] [PubMed] [DOI] [Full Text] [Cited by in Crossref: 57] [Cited by in RCA: 55] [Article Influence: 2.8] [Reference Citation Analysis (0)] |
| 13. | Kapanen MK, Halavaara JT, Häkkinen AM. Open four-compartment model in the measurement of liver perfusion. Acad Radiol. 2005;12:1542-1550. [RCA] [PubMed] [DOI] [Full Text] [Cited by in Crossref: 10] [Cited by in RCA: 10] [Article Influence: 0.5] [Reference Citation Analysis (0)] |
| 14. | Bézy-Wendling J, Kretowski M, Rolland Y. Hepatic tumor enhancement in computed tomography: combined models of liver perfusion and dynamic imaging. Comput Biol Med. 2003;33:77-89. [RCA] [PubMed] [DOI] [Full Text] [Cited by in Crossref: 11] [Cited by in RCA: 12] [Article Influence: 0.5] [Reference Citation Analysis (0)] |
| 15. | Funabasama S, Tsushima Y, Sanada S, Inoue K. Hepatic perfusion CT imaging analyzed by the dual-input one-compartment model. Nihon Hoshasen Gijutsu Gakkai Zasshi. 2003;59:1548-1554. [PubMed] |
| 16. | Nakashige A, Horiguchi J, Tamura A, Asahara T, Shimamoto F, Ito K. Quantitative measurement of hepatic portal perfusion by multidetector row CT with compensation for respiratory misregistration. Br J Radiol. 2004;77:728-734. [RCA] [PubMed] [DOI] [Full Text] [Cited by in Crossref: 24] [Cited by in RCA: 25] [Article Influence: 1.2] [Reference Citation Analysis (0)] |
| 17. | Burdette JH. Is CT perfusion ready for prime time? AJNR Am J Neuroradiol. 2004;25:3-4. [PubMed] |
| 18. | Miles KA. Functional CT imaging in oncology. Eur Radiol. 2003;13 Suppl 5:M134-M138. [RCA] [PubMed] [DOI] [Full Text] [Cited by in Crossref: 27] [Cited by in RCA: 28] [Article Influence: 1.3] [Reference Citation Analysis (0)] |
| 19. | Miles KA. Perfusion CT for the assessment of tumour vascularity: which protocol? Br J Radiol. 2003;76 Spec No 1:S36-S42. [RCA] [PubMed] [DOI] [Full Text] [Cited by in Crossref: 229] [Cited by in RCA: 231] [Article Influence: 11.0] [Reference Citation Analysis (0)] |
| 20. | Miles KA, Griffiths MR. Perfusion CT: a worthwhile enhancement? Br J Radiol. 2003;76:220-231. [RCA] [PubMed] [DOI] [Full Text] [Cited by in Crossref: 311] [Cited by in RCA: 303] [Article Influence: 13.8] [Reference Citation Analysis (0)] |
| 21. | Cuenod C, Leconte I, Siauve N, Resten A, Dromain C, Poulet B, Frouin F, Clément O, Frija G. Early changes in liver perfusion caused by occult metastases in rats: detection with quantitative CT. Radiology. 2001;218:556-561. [RCA] [PubMed] [DOI] [Full Text] [Cited by in Crossref: 115] [Cited by in RCA: 123] [Article Influence: 5.1] [Reference Citation Analysis (0)] |
| 22. | Pandharipande PV, Krinsky GA, Rusinek H, Lee VS. Perfusion imaging of the liver: current challenges and future goals. Radiology. 2005;234:661-673. [RCA] [PubMed] [DOI] [Full Text] [Cited by in Crossref: 228] [Cited by in RCA: 228] [Article Influence: 11.4] [Reference Citation Analysis (0)] |
| 23. | Ackerman NB, Lien WM, Silverman NA. The blood supply of experimental liver metastases. 3. The effects of acute ligation of the hepatic artery or portal vein. Surgery. 1972;71:636-641. [PubMed] |
| 24. | Honjo I, Matsumura H. Vascular distribution of hepatic tumors. Experimental study. Rev Int Hepatol. 1965;15:681-690. [PubMed] |
| 25. | Tajima T, Honda H, Taguchi K, Asayama Y, Kuroiwa T, Yoshimitsu K, Irie H, Aibe H, Shimada M, Masuda K. Sequential hemodynamic change in hepatocellular carcinoma and dysplastic nodules: CT angiography and pathologic correlation. AJR Am J Roentgenol. 2002;178:885-897. [RCA] [PubMed] [DOI] [Full Text] [Cited by in Crossref: 120] [Cited by in RCA: 132] [Article Influence: 5.7] [Reference Citation Analysis (0)] |
| 26. | Kudo M. Imaging blood flow characteristics of hepatocellular carcinoma. Oncology. 2002;62 Suppl 1:48-56. [RCA] [PubMed] [DOI] [Full Text] [Cited by in Crossref: 32] [Cited by in RCA: 34] [Article Influence: 1.5] [Reference Citation Analysis (0)] |


