Published online May 14, 2006. doi: 10.3748/wjg.v12.i18.2870
Revised: March 28, 2006
Accepted: April 10, 2006
Published online: May 14, 2006
The biomechanical changes during functional loading and unloading of the human gastrointestinal (GI) tract are not fully understood. GI function is usually studied by introducing probes in the GI lumen. Computer modeling offers a promising alternative approach in this regard, with the additional ability to predict regional stresses and strains in inaccessible locations. The tension and stress distributions in the GI tract are related to distensibility (tension-strain relationship) and smooth muscle tone. More knowledge on the tension and stress on the GI tract are needed to improve diagnosis of patients with gastrointestinal disorders. A modeling framework that can be used to integrate the physiological, anatomical and medical knowledge of the GI system has recently been developed. The 3-D anatomical model was constructed from digital images using ultrasonography, computer tomography (CT) or magnetic resonance imaging (MRI). Different mathematical algorithms were developed for surface analysis based on thin-walled structure and the finite element method was applied for the mucosa-folded three layered esophageal model analysis. The tools may be useful for studying the geometry and biomechanical properties of these organs in health and disease. These studies will serve to test the structure-function hypothesis of geometrically complex organs.
- Citation: Liao D, Frøkjær JB, Yang J, Zhao J, Drewes AM, Gilja OH, Gregersen H. Three-dimensional surface model analysis in the gastrointestinal tract. World J Gastroenterol 2006; 12(18): 2870-2875
- URL: https://www.wjgnet.com/1007-9327/full/v12/i18/2870.htm
- DOI: https://dx.doi.org/10.3748/wjg.v12.i18.2870
Biomechanical changes due to functional loading and unloading of the human gastrointestinal (GI) tract are not fully understood. The GI function is usually studied by introducing probes in the GI lumen, e.g. for pressure recordings. Computer modeling based on medical imaging offers a promising alternative approach in this regard, with the additional ability to predict regional stresses and strains in inaccessible locations. Thus, the three-dimensional (3-D) geometry of visceral organs is of considerable interesting since the morphology and geometry are changed in various diseases[1,2]. The tension and stress distributions in the GI tract are related to distensibility (tension-strain relationship) and smooth muscle tone. The most widely used method for biomechanical stimulation of the gastrointestinal tract is bag distension[3,4]. Distension data are traditionally based on pressure-volume measurements[5-9]. Several studies suggest that the mechanoreceptors located in the gastrointestinal wall are tension receptors[10,11]. Distension technology has been refined by the introduction of the impedance planimetry technique and the endoscopic ultrasound probe[12-23]. These are now well-established methods for assessing circumferential strain, tension, stress and stiffness (slope of stress-strain relation). Previous GI studies have provided data on wall tension and stress in visceral organs. These studies, however, were based on two-dimensional models; i.e., the circumferential tension and stress have been determined at one specified position along the long axis of the organ. However, the tension distribution is related to the geometry (radii of curvature) and the distension pressure according to Laplace’s law. Complex geometries will result in heterogeneous tension distributions. Therefore, three-dimensional geometry based on medical images is necessary for computing the tension and stress in the GI tract at various physiological and pathophysiological states.
Recently, 3-D surface model of the gall bladder, stomach, rectum and sigmoid colon have been developed by simultaneous cross-sectional imaging using ultrasonography, computer tomography (CT) or magnetic resonance imaging (MRI)) and pressure measurement during distension[24-27]. Using this method it is possible to model the 3-D geometry and mechanical properties of the gastrointestinal tract, including the spatial distribution of the 3-D principal curvatures, radii of curvature, wall thickness, tension and stress.
Examples of 3-D surface models of the GI organs, including stomach, rectum, sigmoid colon and gall bladder and the mucosal folded three layered esophageal finite element model are presented. Two different mathematic algorithms used for surface analysis were introduced. The human stomach[24] and gall bladder[25] models were generated based on the cross sectional images and the surfaces were analyzed theoretically by using a Fourier transform method. The human rectum[26], human sigmoid colon and rat stomach[27] were established from re-sliced images. The surfaces were analyzed locally by using a numerical method.
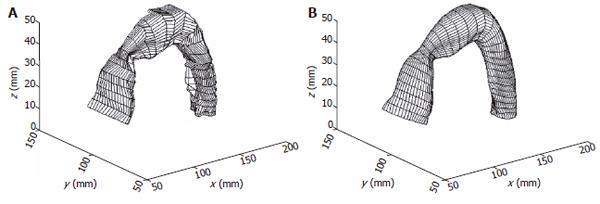
The anatomical data used for the construction of the initial GI 3D models were obtained from ultrasonography, computed tomography (CT) or magnetic resonance imaging (MRI). The image processing method was used to identify the inner and outer wall boundaries and then a data cloud of a 3-D model was obtained. A 3-D sigmoid colon model built from cross sectional images is illustrated in Figure 1.
For GI organs such as the stomach[24], rectum[26] or sigmoid colon (Figure 1), the centre axis are curved. The distended organs are deformed along the curved axis. Alignment of data points along this curved centre axis was necessary to describe the GI model deformation. Based on a 3-D solid model generated from the cross sectional images, it can be re-sliced along the curved centre axis and the surface model based on the re-sliced images can be obtained. Figure 1 show a sigmoid colon solid model and a surface model generated from the re-sliced images.
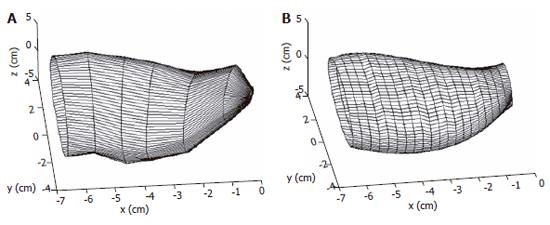
The reconstructed surfaces have some irregularities due to the discretization of the images. The irregularities were removed using two different smoothing methods in our studies, one method was based on the Fourier transform algorithm and another one is a modified non-shrinking Gaussian smoothing method[28]. The two smoothing algorithms used in the surface analysis are illustrated in Appendix A and B. By using the algorithm described in appendix A, a complex surface can thus be described and smoothed by the surface function of Eq. A3. A smoothed stomach antrum model is illustrated in Figure 2. Figure 3 shows a sigmoid colon model that was smoothed based on the Gaussian smoothing method. With the continuous and smoothed surface, thus the surface can be approximated locally by a biquadric surface patch. The parametric surface used in our studies is a tensor product B-spline surface which gives the necessary continuity properties and with good surface approximation[29].
With the surface function Eq. (A3) or Eq.(B1) at the local co-ordinate system, the principle curvatures of the surface were generated from the coefficient of the first fundamental form (E,F and G) and the second fundamental form (L, M and N) of the surface function.The principal curvatures κ1 and κ2 can be combined from the Gaussian curvature (KG) and the Mean curvature (KM):
KG = κ1κ2 =(LN-M2)/(G-F2) (1)
KM =1/(κ1+κ2) =(1/2)[(NE-2MF+LG)/(EG-F2)] (2)
KG is a particularly useful curvature parameter that indicates an elliptical surface (KG > 0), a parabolic surface (KG = 0) or a hyperbolic surface (KG < 0).
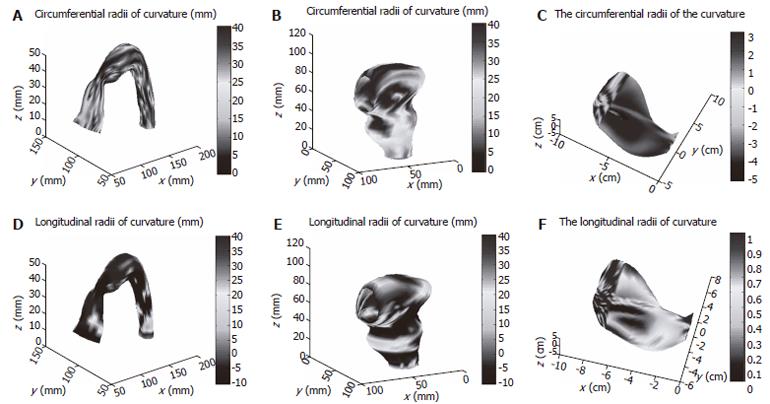
Circumferential and longitudinal curvatures distribution on human sigmoid colon, human rectum and human stomach models are illustrated in Figure 4.
If we assume that the GI organs are thin-walled and its material properties are isotropic, the surface tension at a surface point is related to the transmural pressure by Laplace’s equation as follows:
P = T [κ1 + κ2] (3)
where κ1 and κ2 are the principal surface curvatures at a surface point. This equation is valid as long as the membrane is so thin that bending rigidity can be neglected and the curvature changes are not sudden. Accordingly, only the spatial points with positive Gaussian curvature were used for tension (and stress) calculations in this study. Stress is defined as the force acting on a unit area. The stress distribution on the surface can be calculated from wall tension and normal wall thickness as:
σ = T/h (4)
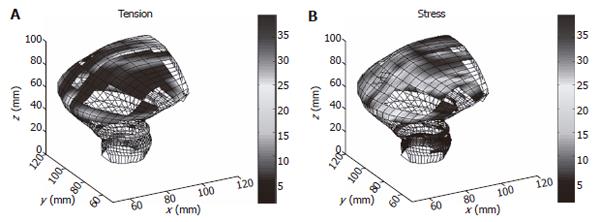
T is the surface tension and h is the normal wall thickness. An example of tension and stress distribution on the rectum model are illustrated in Figure 5.
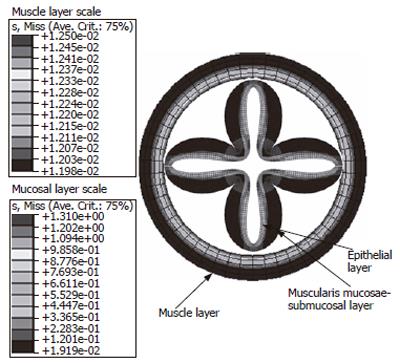
The major shortcoming of the above surface analysis is the thin wall assumption. Thus only surfaces with positive principal curvatures in both directions could use Laplace’s equation for tension and stress calculation (Figure 5). To overcome this limitation, numerical methods such as finite element analysis must be adopted. The finite element method has been used for modeling GI tract bioelectric activity[30,31] and the layered esophagus distension simulation[32,33]. Figure 6 is a mucosal folded three layered esophageal finite element model. It is indicated that the stress distribution throughout the esophageal wall was not uniform and the stress was discontinuous between the muscle and mucosal-submucosal layer (Figure 6). Thus the Laplace’s law is no longer valid in such layered and thick wall models.
Mechanosensitive receptors are important for GI tract function and sensation. The intraganglionic laminar nerve ending (IGLE) is believed to be a mechanosensitive receptor and is located within the smooth muscle-lined regions of the GI tract[34,35]. It is generally believed that they are tension receptors. The neurons respond in an intensity-dependent manner to the gastric distension[35,36]. Hence, determination of the stress or tension locally is important for understanding the mechanical environment at receptor sites. Methods based on pressure-volume measurements obtained during bag distension (such as the barostat) do not directly measure variables used in plane stress and strain analysis[5,8,12,22]. Because the bag can elongate, cross-sectional area cannot be derived from bag volume. Moreover, the main assumption for the computation of tension using the barostat and Laplace’s law is that the geometry is spherical, although it seems obvious from medical imaging modalities such as ultrasound and magnetic resonance (MR)-scanning of the complex GI organs such as stomach or rectum that the assumption is not valid. Impedance planimetry measures luminal pressure and cross-sectional area in a short segment of hollow viscera during bag distension[14-18,22,37]. Based on these measures the circumferential strain, tension (applying Laplace law) and stiffness (slope of tension-strain relation) of a specific cross-sectional segment can be computed. This approach has limitations in irregular organs like the stomach, rectum or sigmoid colon because the calculated tension is based on the assumption of circularity, is only valid for thin walled structures, and only accounts for circumferential tension.
In our 3D surface analysis, we generated the organ geometry based on 3-D ultrasound or MR images measurements. It is clear that GI organs such as the stomach, rectum, sigmoid colon and gall bladder have heterogeneous curvature distributions. Consequently, the geometry cannot be assumed spherical or cylindrical and that tension estimations based on Laplace’s law are dubious because the geometry of the surface is complex. Two different methods were used for building 3D model and the surface approximation. By using the Fourier transform method the whole surface was reconstructed and smoothed simultaneously, i.e. the surface can be described theoretically and then the curvatures can be computed with good accuracy. However, it is difficult to describe all geometry characters in such complex GI organs by using only one function. Furthermore, the Fourier transform method can only be used on the surface generated from the horizontal cross sectional images. The analysis employed in these surface models produces large errors at both polar ends, especially to models with a curved center axis, such as the stomach, rectum or sigmoid colon. Since 3D solid model can be re-sliced in any direction, a new method for re-generating the 3-D surface from the solid model was developed. By using the new method, all geometric characters can thus be kept in the surface model.
The major limitation of the surface analysis is the thin wall assumption. Thus only surfaces with positive principal curvatures in both directions could use Laplace’s equation for tension and stress calculation. The finite element analysis or the finite difference method should be developed for further GI modeling analysis in the future. 3-D modeling based on cross-sectional imaging (CT, MRI and ultrasonography) has been used to characterize biomechanics and geometry in for instance the stomach[24,27], the rectum[26] cardiovascular system[38], and in computer-aided orthopedic surgery. The present analytical tool can be used to analyze complex structures for understanding biomechanical properties and visceral perception in other hollow visceral organs. The geometry and sensory aspects of diseases in the sigmoid colon (diverticular disease, irritable bowel syndrome, etc.), small bowel (motility disorders), stomach (motility disorders, non-ulcer dyspepsia, etc.) and esophagus (esophagitis, gastro-esophageal reflux disease, non-cardiac chest pain, etc.) can be obtained by applying a modified version of this method.
Dr. Elena Steffensen, Dr. Anette Bergmann for their contributions to the rectum and the sigmoid colon models, Prof T. Hausken for his contribution to the human stomach model and Prof G. Kassab for the Fourier Transform method development.
Arbitrary point in a given cross section of the surface can be expressed in a polar co-ordinate system as (r, θ, z), where r, θ and z are the polar radius, angle and section height with respect to the origin. Each point can be fitted using a Fourier series as
Math 1
where d denotes the degree of the Fourier series.
To approximate the Fourier coefficient as a function of the section height z , orthogonal polynomial were used as
ai(z) = c0i + c0i z + c2i z2+ ... + cpi zp (A2)
where p is the degree of the polynomial and i is the index of the Fourier coefficient. The (r, θ, z) coordinates were described using vector rotation as
X(θ, z) = (r (θ, z) cos(θ), r (θ, z) sin(θ), z) (A3)
where
Math 2
Hence, all the information of the surface is contained in the coefficient matrix, i.e., the surface was now transformed from a three-dimensional Cartesian coordinates (x, y, z) to a two-dimensional local tangent plane coordinates system (θ, z), where the θ is the tangent direction corresponding to the circumferential muscle direction and z to the longitudinal muscle direction, respectively.
This smoothing algorithm consists of two consecutive Gaussian smoothing steps with a positive scale factor λ applied to all the vertices of the shape, a second Gaussian smoothing step applied to all the vertices but with a negative scale factor μ, greater in magnitude than the first scale factor (0 < λ< -μ). To produce a significant smoothing effect, these two steps must be repeated, alternating the positive and negative scale factors, a number of times. The relation between the position of the vertices of the surface before and after N iteration can be expressed as
XN = ((I - μK)(I - λK))N X (B1)
where N was the number of iterations, λ and μ are two scale factors, I is the nV× nV identity matrix, K = I - W, W is the weight matrix and nV is the number of the neighborhood of a vertex. In fact this method produces a low pass filter effect. The two scale factors determine the pass band and the stop band.
S- Editor Pan BR E- Editor Bi L
| 1. | Champion JK, Delise N, Hunt T. Myenteric plexus in spastic motility disorders. J Gastrointest Surg. 2001;5:514-516. [RCA] [PubMed] [DOI] [Full Text] [Cited by in Crossref: 21] [Cited by in RCA: 17] [Article Influence: 0.7] [Reference Citation Analysis (0)] |
| 2. | Villadsen GE, Storkholm JH, Hendel L, Vilstrup H, Gregersen H. Impedance planimetric characterization of esophagus in systemic sclerosis patients with severe involvement of esophagus. Dig Dis Sci. 1997;42:2317-2326. [RCA] [PubMed] [DOI] [Full Text] [Cited by in Crossref: 28] [Cited by in RCA: 27] [Article Influence: 1.0] [Reference Citation Analysis (0)] |
| 3. | van der Schaar PJ, Lamers CB, Masclee AA. The role of the barostat in human research and clinical practice. Scand J Gastroenterol Suppl. 1999;230:52-63. [RCA] [PubMed] [DOI] [Full Text] [Cited by in Crossref: 39] [Cited by in RCA: 36] [Article Influence: 1.4] [Reference Citation Analysis (0)] |
| 4. | Whitehead WE, Wald A, Diamant NE, Enck P, Pemberton JH, Rao SS. Functional disorders of the anus and rectum. Gut. 1999;45 Suppl 2:II55-II59. [RCA] [PubMed] [DOI] [Full Text] [Cited by in Crossref: 70] [Cited by in RCA: 88] [Article Influence: 3.4] [Reference Citation Analysis (0)] |
| 5. | Madoff RD, Orrom WJ, Rothenberger DA, Goldberg SM. Rectal compliance: a critical reappraisal. Int J Colorectal Dis. 1990;5:37-40. [RCA] [PubMed] [DOI] [Full Text] [Cited by in Crossref: 72] [Cited by in RCA: 55] [Article Influence: 1.6] [Reference Citation Analysis (0)] |
| 6. | Thumshirn M, Camilleri M, Choi MG, Zinsmeister AR. Modulation of gastric sensory and motor functions by nitrergic and alpha2-adrenergic agents in humans. Gastroenterology. 1999;116:573-585. [RCA] [PubMed] [DOI] [Full Text] [Cited by in Crossref: 136] [Cited by in RCA: 116] [Article Influence: 4.5] [Reference Citation Analysis (0)] |
| 7. | Piessevaux H, Tack J, Wilmer A, Coulie B, Geubel A, Janssens J. Perception of changes in wall tension of the proximal stomach in humans. Gut. 2001;49:203-208. [RCA] [PubMed] [DOI] [Full Text] [Cited by in Crossref: 85] [Cited by in RCA: 92] [Article Influence: 3.8] [Reference Citation Analysis (0)] |
| 8. | Distrutti E, Azpiroz F, Soldevilla A, Malagelada JR. Gastric wall tension determines perception of gastric distention. Gastroenterology. 1999;116:1035-1042. [RCA] [PubMed] [DOI] [Full Text] [Cited by in Crossref: 171] [Cited by in RCA: 159] [Article Influence: 6.1] [Reference Citation Analysis (0)] |
| 9. | Arhan P, Devroede G, Danis K, Dornic C, Faverdin C, Persoz B, Pellerin D. Viscoelastic properties of the rectal wall in Hirschsprung's disease. J Clin Invest. 1978;62:82-87. [RCA] [PubMed] [DOI] [Full Text] [Cited by in Crossref: 31] [Cited by in RCA: 25] [Article Influence: 0.5] [Reference Citation Analysis (0)] |
| 10. | Ginzel KH. [Studies on the mechanism of the peristaltic reflex of the guinea pig ileum]. Naunyn Schmiedebergs Arch Exp Pathol Pharmakol. 1960;238:104-106. [PubMed] |
| 11. | Sengupta JN, Gebhart GF. Gastrointestinal afferent fibers and sensation. Physiology of the gastrointestinal tract. New York: Raven Press 1994; 483-519. |
| 12. | Gregersen H, Kassab G. Biomechanics of the gastrointestinal tract. Neurogastroenterol Motil. 1996;8:277-297. [RCA] [PubMed] [DOI] [Full Text] [Cited by in Crossref: 221] [Cited by in RCA: 204] [Article Influence: 7.0] [Reference Citation Analysis (0)] |
| 13. | Drewes AM, Schipper KP, Dimcevski G, Petersen P, Andersen OK, Gregersen H, Arendt-Nielsen L. Multimodal assessment of pain in the esophagus: a new experimental model. Am J Physiol Gastrointest Liver Physiol. 2002;283:G95-103. [PubMed] |
| 14. | Dall FH, Jørgensen CS, Houe D, Gregersen H, Djurhuus JC. Biomechanical wall properties of the human rectum. A study with impedance planimetry. Gut. 1993;34:1581-1586. [RCA] [PubMed] [DOI] [Full Text] [Cited by in Crossref: 45] [Cited by in RCA: 45] [Article Influence: 1.4] [Reference Citation Analysis (0)] |
| 15. | Petersen P, Gao C, Rössel P, Qvist P, Arendt-Nielsen L, Gregersen H, Drewes AM. Sensory and biomechanical responses to distension of the normal human rectum and sigmoid colon. Digestion. 2001;64:191-199. [RCA] [PubMed] [DOI] [Full Text] [Cited by in Crossref: 25] [Cited by in RCA: 27] [Article Influence: 1.2] [Reference Citation Analysis (0)] |
| 16. | Petersen P, Gao C, Arendt-Nielsen L, Gregersen H, Drewes AM. Pain intensity and biomechanical responses during ramp-controlled distension of the human rectum. Dig Dis Sci. 2003;48:1310-1316. [RCA] [PubMed] [DOI] [Full Text] [Cited by in Crossref: 48] [Cited by in RCA: 44] [Article Influence: 2.0] [Reference Citation Analysis (0)] |
| 17. | Drewes AM, Petersen P, Rössel P, Gao C, Hansen JB, Arendt-Nielsen L. Sensitivity and distensibility of the rectum and sigmoid colon in patients with irritable bowel syndrome. Scand J Gastroenterol. 2001;36:827-832. [RCA] [PubMed] [DOI] [Full Text] [Cited by in Crossref: 46] [Cited by in RCA: 43] [Article Influence: 1.8] [Reference Citation Analysis (0)] |
| 18. | Dall FH, Jørgensen CS, Djurhuus JC, Gregersen H. Biomechanical wall properties of the porcine rectum: a study using impedance planimetry. Dig Dis. 1991;9:347-353. [RCA] [PubMed] [DOI] [Full Text] [Cited by in Crossref: 11] [Cited by in RCA: 9] [Article Influence: 0.3] [Reference Citation Analysis (0)] |
| 19. | Takeda T, Kassab G, Liu J, Puckett JL, Mittal RR, Mittal RK. A novel ultrasound technique to study the biomechanics of the human esophagus in vivo. Am J Physiol Gastrointest Liver Physiol. 2002;282:G785-G793. [PubMed] |
| 20. | Takeda T, Kassab G, Liu J, Nabae T, Mittal RK. Effect of atropine on the biomechanical properties of the oesophageal wall in humans. J Physiol. 2003;547:621-628. [RCA] [PubMed] [DOI] [Full Text] [Cited by in Crossref: 18] [Cited by in RCA: 21] [Article Influence: 1.0] [Reference Citation Analysis (0)] |
| 21. | Takeda T, Nabae T, Kassab G, Liu J, Mittal RK. Oesophageal wall stretch: the stimulus for distension induced oesophageal sensation. Neurogastroenterol Motil. 2004;16:721-728. [RCA] [PubMed] [DOI] [Full Text] [Cited by in Crossref: 41] [Cited by in RCA: 36] [Article Influence: 1.7] [Reference Citation Analysis (0)] |
| 22. | Gregersen H. Biomechanics of the Gastrointestinal Tract. London: Springer-Verlag 2002; 77-105. |
| 23. | Barlow JD, Gregersen H, Thompson DG. Identification of the biomechanical factors associated with the perception of distension in the human esophagus. Am J Physiol Gastrointest Liver Physiol. 2002;282:G683-G689. [PubMed] |
| 24. | Liao D, Gregersen H, Hausken T, Gilja OH, Mundt M, Kassab G. Analysis of surface geometry of the human stomach using real-time 3-D ultrasonography in vivo. Neurogastroenterol Motil. 2004;16:315-324. [RCA] [PubMed] [DOI] [Full Text] [Cited by in Crossref: 48] [Cited by in RCA: 42] [Article Influence: 2.0] [Reference Citation Analysis (0)] |
| 25. | Liao D, Duch BU, Stødkilde-Jørgensen H, Zeng YJ, Gregersen H, Kassab GS. Tension and stress calculations in a 3-D Fourier model of gall bladder geometry obtained from MR images. Ann Biomed Eng. 2004;32:744-755. [RCA] [PubMed] [DOI] [Full Text] [Cited by in Crossref: 9] [Cited by in RCA: 10] [Article Influence: 0.5] [Reference Citation Analysis (0)] |
| 26. | Frøkjaer JB, Liao D, Bergmann A, McMahon BP, Steffensen E, Drewes AM, Gregersen H. Three-dimensional biomechanical properties of the human rectum evaluated with magnetic resonance imaging. Neurogastroenterol Motil. 2005;17:531-540. [RCA] [PubMed] [DOI] [Full Text] [Cited by in Crossref: 35] [Cited by in RCA: 35] [Article Influence: 1.8] [Reference Citation Analysis (0)] |
| 27. | Liao D, Zhao J, Gregersen H. Regional surface geometry of the rat stomach based on three-dimensional curvature analysis. Phys Med Biol. 2005;50:231-246. [RCA] [PubMed] [DOI] [Full Text] [Cited by in Crossref: 17] [Cited by in RCA: 17] [Article Influence: 0.9] [Reference Citation Analysis (0)] |
| 28. | Taubin G; Geometric signal processing on polygonal meshes. In: Proc. EUROGRAPHICS: State of the Art Report (STAR), Interlaken, Switzerland (2000). Avaliable from: http: //mesh.brown.edu/taubin/pdfs/taubin-eg00star.pdf. . |
| 29. | Dierckx P. Curve and Surface Fitting with Splines. Oxford: Oxford University Press 1993; 74-128. |
| 30. | Buist ML, Cheng LK, Yassi R, Bradshaw LA, Richards WO, Pullan AJ. An anatomical model of the gastric system for producing bioelectric and biomagnetic fields. Physiol Meas. 2004;25:849-861. [RCA] [PubMed] [DOI] [Full Text] [Cited by in Crossref: 30] [Cited by in RCA: 27] [Article Influence: 1.3] [Reference Citation Analysis (0)] |
| 31. | Pullan A, Cheng L, Yassi R, Buist M. Modelling gastrointestinal bioelectric activity. Prog Biophys Mol Biol. 2004;85:523-550. [RCA] [PubMed] [DOI] [Full Text] [Cited by in Crossref: 69] [Cited by in RCA: 59] [Article Influence: 2.8] [Reference Citation Analysis (0)] |
| 32. | Liao D, Zhao J, Fan Y, Gregersen H. Two-layered quasi-3D finite element model of the oesophagus. Med Eng Phys. 2004;26:535-543. [RCA] [PubMed] [DOI] [Full Text] [Cited by in Crossref: 33] [Cited by in RCA: 34] [Article Influence: 1.7] [Reference Citation Analysis (0)] |
| 33. | Yang W, Fung TC, Chian KS, Chong CK 3-D finite element model of the two-layered esophagus: The effects of residual strains and buckling of mucosa. Proceedings of the Second LASTED international conference. Biomechanics. 2005;194-199. |
| 34. | Ozaki N, Sengupta JN, Gebhart GF. Mechanosensitive properties of gastric vagal afferent fibers in the rat. J Neurophysiol. 1999;82:2210-2220. [PubMed] |
| 35. | Page AJ, Martin CM, Blackshaw LA. Vagal mechanoreceptors and chemoreceptors in mouse stomach and esophagus. J Neurophysiol. 2002;87:2095-2103. [PubMed] |
| 36. | Phillips RJ, Powley TL. Tension and stretch receptors in gastrointestinal smooth muscle: re-evaluating vagal mechanoreceptor electrophysiology. Brain Res Brain Res Rev. 2000;34:1-26. [RCA] [PubMed] [DOI] [Full Text] [Cited by in Crossref: 194] [Cited by in RCA: 177] [Article Influence: 7.1] [Reference Citation Analysis (0)] |
| 37. | Gregersen H, Christensen J. Gastrointestinal tone. Neurogastroenterol Motil. 2000;12:501-508. [RCA] [PubMed] [DOI] [Full Text] [Cited by in Crossref: 42] [Cited by in RCA: 39] [Article Influence: 1.6] [Reference Citation Analysis (0)] |
| 38. | Petrank YF, Dong SJ, Tyberg J, Sideman S, Beyar R. Regional differences in shape and load in normal and diseased hearts studied by three dimensional tagged magnetic resonance imaging. Int J Card Imaging. 1999;15:309-321. [RCA] [PubMed] [DOI] [Full Text] [Cited by in Crossref: 19] [Cited by in RCA: 16] [Article Influence: 0.6] [Reference Citation Analysis (0)] |


