Published online Apr 21, 2006. doi: 10.3748/wjg.v12.i15.2357
Revised: November 2, 2005
Accepted: November 18, 2005
Published online: April 21, 2006
AIM: To study the effect of interleukin-10 (IL-10) on the expression of transforming growth factor β1 (TGF-β1) in hepatic fibrosis rats and the anti-fibrotic role of exo-genous IL-10.
METHODS: Hepatic fibrosis was induced by carbon tetrachloride administered (CCl4) intraperitoneally. The experiment was performed in two stages. In the first stage, 60 SD rats were divided randomly into normal control group 1(GN1, n = 8), hepatic fibrosis group(GC, n = 28)and IL-10 intervened group(GI, n = 24). At the beginning of the 7th and 11th wk, hepatic stellate cells (HSCs) were isolated, reverse transcription-polymerase chain reation (RT-PCR) and immunocytochemistry were performed to detect the expression of TGF-β1 in HSCs. Histological examination was used to determine the degree of hepatic fibrosis. In the second stage, 47 SD rats were divided randomly into normal control group 2(GN2, n = 6)and CCl4 group(GZ, n = 41). At the end of the 9th week, rats in GZ group were allocated randomly into model group(GM, n = 9), IL-10 treatment group(GT, n = 9)and recovered group(GR, n = 9). At the end of the 12th week, all rats were sacrificed. RT-PCR and immunohistochemistry were performed to detect the expression of TGF-β1 in liver tissue. ELISA was used to assay serum TGF-β1 levels.
RESULTS: Hepatic fibrosis developed in rats with the increase of the injection frequency of CCl4. In the first stage, hepatic fibrosis developed and HSCs were isolated successfully. At the 7th and 11th week, TGF-β1 mRNA in GC group increased significantly compared with that in GN1(P = 0.001/0.042)and GI groups(P = 0.001/0.007), whereas there was no significant difference between the two groups. The levels of TGF-β1 at the beginning of the 7th wk was higher than that of the 11th wk(P = 0.049). Immunocytochemistry results of TGF-β1 were consistent with the above findings. In the second stage, TGF-β1 increased significantly in GM group compared to GN2. After treatment with IL-10, TGF-β1 declined obviously. The expression of TGF-β1 decreased in GR group but was still higher than that in GT group.
CONCLUSION: The levels of TGF-β1 are increased in hepatic fibrosis rats and decreased after treatment with exogenous IL-10. IL-10 may play an anti-fibrotic role by suppressing TGF-β1 expression.
- Citation: Shi MN, Huang YH, Zheng WD, Zhang LJ, Chen ZX, Wang XZ. Relationship between transforming growth factor β1 and anti-fibrotic effect of interleukin-10. World J Gastroenterol 2006; 12(15): 2357-2362
- URL: https://www.wjgnet.com/1007-9327/full/v12/i15/2357.htm
- DOI: https://dx.doi.org/10.3748/wjg.v12.i15.2357
Hepatic fibrosis, which represents the wound healing response of the liver, is a common sequel of liver injury characterized by increased deposition and altered composition of extracellular matrix(ECM)[1-2]. Hepatic stellate cells(HSCs)are the major source of ECM and regarded as the principle cell type in the development of hepatic fibrosis [3-5]. TGF-β1 appears to be the main fibrogenic mediator and exerts its effects through autocrine or paracrine on HSCs [6]. Hepatocytes also express TGF-β1 when isolated and cultured in vitro as a response to an altered extracellular environment. It has been reported that interleukin-10 (IL-10)could relieve the degree of rat hepatic fibrosis induced by carbon tetrachloride(CCl4)[7]. In the present study, we isolated HSCs and detected the expression of TGF-β1 in HSCs and liver tissues, and explored the relationship between TGF-β1 and hepatic fibrosis in an attempt to explain the possible mechanisms of the antifibrotic activities of exogenous IL-10 in vivo.
All rats were bred under routine conditions(at room temperature of 22 °C ± 2 °C, a humidity of 55% ± 5%) with a light/dark cycle and free access to drinking water and food (BK Company in Shanghai,China). In the first stage, 60 clean male SD rats were divided randomly into normal control group 1(GN1,n = 8), hepatic fibrosis group(GC, n = 28)and IL-10 intervened group(GI, n = 24). Rats in GN1 group were injected intraperitoneally with saline at a dose of 2 mL/kg twice a week. Rats in the other two groups received intraperitoneal injection of 50% CCl4 dissolved in castor oil (2 mL/kg) twice a week as described previously[8]. From the third week, rats in GI group were injected intraperitoneally with IL-10 dissolved in saline (4 μg/kg) 20 min before CCl4 administration as previously described[9]. The intervention lasted to the end of the experiment. In the second stage, 47 SD rats were divided randomly into normal control group 2(GN2, n = 6)and CCl4 group(GZ, n = 41). Rats in the GN2 group were injected intraperitoneally with saline at a dose of 2 mL/kg, twice a week. Rats in the GZ group received intraperitoneal injection of 50% CCl4 dissolved in castor oil (2 mL/kg) twice a week. At the end of the 9th week, rats in the GZ group were divided randomly into model group(GM, n = 9), IL-10 treatment group(GT, n = 9)and recovered group(GR, n = 9). Rats in the GM group were injected with CCl4 continuously: Rats in the GT group received intraperitoneal IL-10 dissolved in saline (4 μg /kg) after injection of CCl4 for 9 weeks and rats in the GR group were not treated. Three rats in the GN2 group were executed at the 9th week and the other rats were sacrificed at the 12th week.
In the first stage, at the beginning of the 7th and 11th week,2 rats from each group were chosen randomly for histological examination. Liver tissues were fixed in 10% formalin and embedded with paraffin. Sections were stained with hematoxylin and eosin (HE) and examined under a light microscope.
Isolation, incubation and identification of HSCs were performed as previously described[10]. Briefly,at the beginning of the 7th and 11th week, 5 rats from each group were chosen randomly to perfuse with 0.13% pronase E and 0.025% type-IV collagenase through a portal vein catheter. The liver tissue suspension was incubated with 0.02% pronase E and 0.025% type-IV collagenase under agitation. The suspension obtained from the digested liver tissue was centrifuged with 11% Nycodenz density gradient to purify HSCs. Then, the HSCs were seeded at the concentration of 1×10⁶ cells /mL of Dulbecco’s modified Eagle’s medium(DMEM)supplemented with 20% fetal calf serum in 96-well plates and kept at 37 °C in a 50 mL/L CO2 atmosphere for 72 h. The HSCs were identified by their typical phase-contrast microscopic appearance and immunocytochemistry using antibody directed against desmin. Cell vitality was checked by trypan-blue exclusion.
Total RNA was extracted from freshly isolated HSCs and liver tissues according to the instructions of the RNA isolation kit (Jingmei Biotechnology Company, Shenzhen). Its quantity and purity were assessed by measuring the optical density at 260 nm and 280 nm. After measurement of RNA amount,samples were either used immediately for RT or stored at -70 °C.
For RT, 1 μg total RNA was transcribed following the instructions of the first strand cDNA synthesis kit(Jingmei Biotechnology Company, Shenzhen). Twenty μL reaction mixture was transcribed at 42 °C for 60 min, at 99 °C for 5 min and stored at -20 °C.
For PCR, primers coding for the house-keeping gene-β-actin were added into the reaction mixture to standardize the results. Fifty μL aqua was added into the reactive system containing 2 μL cDNA, 5 μL 10×buffer, 5 μL 25 mmoL/L MgCl2, 1 μL 10 mmoL/L dNTP, 1 μL 20 mmoL/L up stream and down stream primer of target gene, 1 μL 20 mmoL/L β-actin primer pairs, 3U Taq DNA polymerase. Then PCR was performed with pre-denaturation at 94 °C for 5 min followed by 30 cycles at 94 °C for 45 s, at 55 °C for 30 s, at 72 °C for 60 s and a final extension at 72 °C for 7 min. Primers were designed according to the reference of GenBank(Table 1). PCR products were immediately analyzed by 20 g/L agarose gel electrophoresis and the density of resultant bands was semi-quantified by scanning densitometry using the ratio of TGF-β1 to β-actin to assess the relative level.
| mRNA | Upstreamprimer | Downstreamprimer | Productlength (bp) |
| TGF-β1 | CTC TGC AGG CGC AGC TCT G | GGA CTC TCC ACC TGC AAG AC | 392 |
| β-actin | CCA ACC GTG AAA AGA TGA CC | CAG GAG GAG CAA TGA TCT TG | 660 |
Most of HSCs attached to the dishes after 72 h of primary culture. The 96-well plates were washed twice with 0.1 moL/L PBS and cells were fixed with poly-formaldehyde at 4 °C overnight. The following procedures were performed according to the instructions of streptavidin/peroxidase(S-P)kit (Beijing Zhongshan Company). Briefly, cells were washed with PBS, incubated with bovine serum albumin in PBS, reacted with primary antibody dissolved in PBS, washed, incubated with peroxidase-conjugated second antibody, washed again and reacted with S-P for 20 min. Color reaction was developed by incubation with DAB. In negative controls, the primary antibody was replaced by PBS.
Immunohistochemistry of hepatic TGF-β1
After dewaxed with xylene and rehydrated through a graded alcohol series, sections were digested with 4 g/L trypsin. The following procedures were similar to the steps of immunocytochemistry. Slides were then analyzed with an image analyzing system to obtain the relative contents of hepatic TGF-β1. The characteristics of the antibodies used in this study are summarized in Table 2.
| Antibody | Type | Source | Workingsolution |
| Desmin | Polyclonal, mouse | Beijing Zhongshan Co. | 1:100 |
| TGF-β1 | Polyclonal, rabbit | BOSTER Co. | 1:20/1:25 |
| Antibody to rabbit IgG | Goat | Beijing Zhongshan Co. | Ready to use |
| Antibody to mouse IgG | Goat | Beijing Zhongshan Co. | Ready to use |
ELISA of serum TGF-β1
Assay of serum TGF-β1 content was performed with double antibody ABC-ELISA method according to the ELISA kit instructions(Maoyuan Science Technology Limited Company, Shanghai).
All data were expressed as mean±SE. The significance for the difference between the groups was studied with SPSS11.0 by one-way ANOVA. P < 0.05 was considered statistically significant.
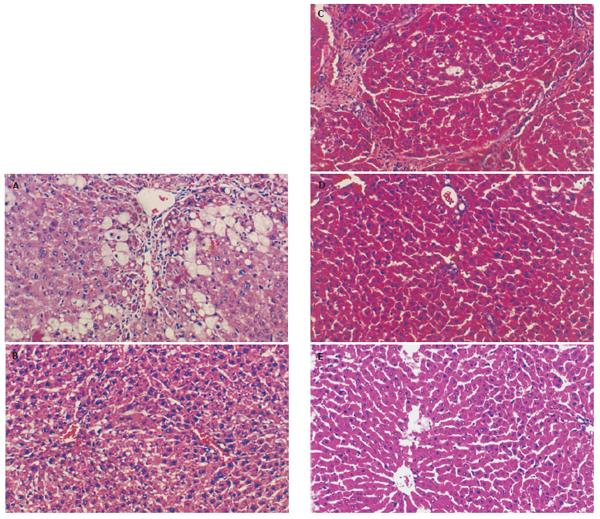
Hepatic fibrosis became remarkable after the treatment with CCl4. At the 7th wk, specimens from the GC group showed steatosis and ballooning degeneration, the collagen fibers increased and began to extend to the parenchyma, many mononuclear cells and unusual neutrophils surrounded the centrilobular veins and fibrotic septa(Figure 1A),while only a few inflammatory cells infiltrated around the centrilobular veins without evident changes of lobular structure in the GI group (Figure 1B). At the 11th week, the reticular fiber extended into the hepatic plate and full delimitation was developed(Figure 1C), while less fibrosis septa and inflammatory infiltration were seen in the GI group (Figure 1D). Specimens from the GN1 group showed normal lobular structure(Figure 1E). Due to the limit of samples, no statistical data presented disparity between the two groups, but fibrogenesis in the GI group was much less severe than that in the GC group.
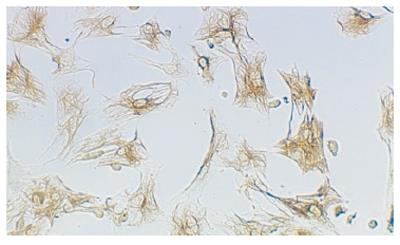
A total of 2-4.5×10⁷ cells were harvested from each rat. HSCs were identified by immunoreaction with desmin(Figure 2). The mean purity of freshly isolated HSCs was 95% ± 5%. The cell vitality checked by trypan-blue exclusion was higher than 95%.
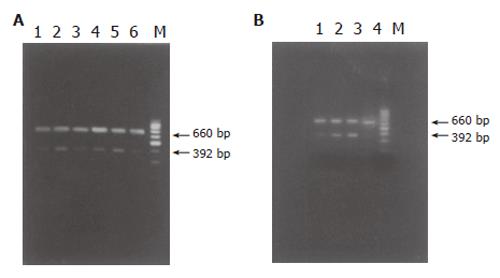
The purity of RNA was determined by the ratio of OD260 and OD280 ranging between 1.8-2.0. In the first stage, at the 7th and 11th wk, TGF-β1 mRNA in the GC group increased obviously compared to the GN1 and GI groups(P < 0.01), but no difference was seen between the two groups. TGF-β1 expression at the 7th wk was higher than that at the 11th wk(P < 0.05, Table 3, Figure 3A). In the second stage, TGF-β1 mRNA in the GM group increased notably compared to the GN2 group(P < 0.01) and declined obviously after treatment with IL-10(P < 0.01). Its expression in the GR group was lower than that in the GM group(P < 0.01) but still higher than that in the GT group(P < 0.05, Table 4, Figure 3B).
| GROUP | n | TGF-β1 content | ||
| Immunhistochemistry | RT-PCR | ELISA | ||
| N2 | 6 | 0.810 ± 0.141 | 0.188 ± 0.014 | 95.442 ± 35.341 |
| M | 9 | 1.804 ± 0.382a | 0.449 ± 0.040b | 242.593 ± 53.902a |
| R | 9 | 0.963 ± 0.121c | 0.279 ± 0.015bd | 165.514 ± 23.193ac |
| T | 9 | 0.501 ± 0.250ace | 0.182 ± 0.027de | 113.472 ± 15.101ce |
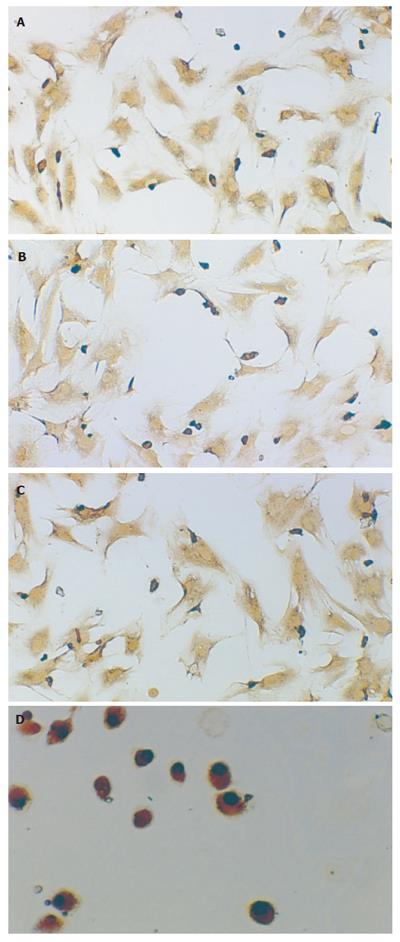
In the first stage, TGF-β1 positive expressions were localized in cytoplasm and nuclei of HSCs in all groups by immunocytochemistry after 72 h of primary culture. Most of the cells attached to and spread over the plastic substratum. At the 7th wk, the size of HSCs in the GC and GI groups was a little larger than that in the GN1 group. At the 11th wk, cell phenotype in the GI group showed circle or ellipse and was a little smaller than that in the 7th wk, no obvious change of phenotype was seen in the GC group. Although the number of samples was limited, the expression of TGF-β1 in the GC group was higher than that in the GN1 group and decreased after treatment with IL-10(Figures 4A-4D). In the second stage, TGF-β1 positive expressions in the GM group were localized in most of the liver tissues, appearing brown. After treatment with IL-10, the distributing area was smaller and the color was lighter. TGF-β1 expression in the GR group was lower than that in the GM group but still higher than that in the GT group(Table 4, Figures 5A-5D).
Expression of serum TGF-β1
The expression of serum TGF-β1 detected by ELISA in different groups had the same tendency as that detected by RT-PCR and immunohistochemistry in the second stage(Table 4).
Although significant progress has been made in understanding the pathogenesis of hepatic fibrosis, a rational therapy that prevents the progression or even reverses fibrosis remains elusive[11-13]. IL-10 is produced mainly by TH2 cells and inhibits the functions of TH1 cells. It down-regulates pro-cytokines synthesis and is associated with amelioration of the inflammatory response[14-16]and fibrosis[17-18]. The present study also found the trend from the pathological sections that IL-10 could relieve the degree of inflammation. In this experiment, we detected TGF-β1 in hepatic fibrosis group as well as in IL-10 treatment group.
TGF-β1 is a multi-functional cytokine in the liver involved in regulation of liver growth and induction of hepatocyte apoptosis, and is the most important medium involved in fibrotic and cirrhotic liver[19-22]. It can promote the development of liver fibrosis by inducing the synthesis of ECM proteins and down-regulating the expression of matrix, thus degrading enzymes and stimulating synthesis of their respective inhibitors[23-26]. The present study showed that, with the development of hepatic fibrosis, TGF-β1 increased in hepatic fibrosis rats and decreased after treatment with IL-10. TGF-β1 mRNA level in HSCs did not run parallel with the progression of hepatic fibrosis in the first stage. TGF-β1 protein level detected by immunohistochemistry and ELISA in IL-10 treatment group was lower than that in normal control group in the second stage. These results suggest that TGF-β1 is closely correlated with hepatic fibrosis and that the improvement of hepatic fibrosis is related with the decreasing expression of TGF-β1. These results also suggest that the expression of TGF-β1 of HSCs cannot be regarded as a predictable factor for the degree of hepatic fibrosis and that the abi-lity of HSCs to produce TGF-β1 is declined when fibrosis develops. While the results of ELISA proved that IL-10 exerted its inhibitory effects on the expression of TGF-β1 not only in liver but also in serum, suggesting that IL-10 can inhibit the expression of TGF-β1. However, further studies are needed to confirm whether the expression of TGF-β1 in normal liver inhibited by IL-10 has any adverse effects and whether the effect of IL-10 on TGF-β1 is modulated by weakening the signal transduction.
S- Editor Wang J L- Editor Wang XL E- Editor Zhang Y
| 1. | Du WD, Zhang YE, Zhai WR, Zhou XM. Dynamic changes of type I,III and IV collagen synthesis and distribution of collagen-producing cells in carbon tetrachloride-induced rat liver fibrosis. World J Gastroenterol. 1999;5:397-403. [PubMed] |
| 2. | Wang JY, Guo JS, Yang CQ. Expression of exogenous rat collagenase in vitro and in a rat model of liver fibrosis. World J Gastroenterol. 2002;8:901-907. [PubMed] |
| 3. | Bataller R, Brenner DA. Hepatic stellate cells as a target for the treatment of liver fibrosis. Semin Liver Dis. 2001;21:437-451. [RCA] [PubMed] [DOI] [Full Text] [Cited by in Crossref: 373] [Cited by in RCA: 397] [Article Influence: 16.5] [Reference Citation Analysis (0)] |
| 4. | Wang FS, Wu ZZ. Current situation in studies of gene therapy of liver cirrhosis and liver fibrosis. Shijie Huanren Xiaohua Zazhi. 2000;8:371-373. |
| 5. | Dai WJ, Jiang HC. Advances in gene therapy of liver cirrhosis: a review. World J Gastroenterol. 2001;7:1-8. [PubMed] |
| 6. | Xiang DD, Wei YL, Li QF. Molecular mechanism of transforming growth factor b1 on Ito cell. Shijie Huanren Xiaohua Zazhi. 1999;7:980-981. |
| 7. | Zhang LJ, Wang XZ, Huang YH, ChenZX . The effects of CGRP,AgII and ET on the liver fibrosis rats. Shijie Huaren Xiaohua Zazhi. 2001;9:457-459. |
| 8. | Morrow JD, Awad JA, Kato T, Takahashi K, Badr KF, Roberts LJ 2nd, Burk RF. Formation of novel non-cyclooxygenase-derived prostanoids (F2-isoprostanes) in carbon tetrachloride hepatotoxicity. An animal model of lipid peroxidation. J Clin Invest. 1992;90:2502-2507. [RCA] [PubMed] [DOI] [Full Text] [Cited by in Crossref: 263] [Cited by in RCA: 251] [Article Influence: 7.6] [Reference Citation Analysis (0)] |
| 9. | Nelson DR, Lauwers GY, Lau JY, Davis GL. Interleukin 10 treatment reduces fibrosis in patients with chronic hepatitis C: a pilot trial of interferon nonresponders. Gastroenterology. 2000;118:655-660. [PubMed] |
| 10. | Zheng WD, Wang XZ, Zhang LJ, Shi MN. A simple and reliable method of isolating rat hepatic stellate cells. Fujian Yikedaxue Xuebao. 2002;38:71-73. |
| 11. | Schuppan D, Strobel D, Hahn EG. Hepatic fibrosis - therapeutic strategies. Digestion. 1998;59:385-390. [RCA] [PubMed] [DOI] [Full Text] [Cited by in Crossref: 24] [Cited by in RCA: 25] [Article Influence: 0.9] [Reference Citation Analysis (0)] |
| 12. | Pinzani M, Marra F, Carloni V. Signal transduction in hepatic stellate cells. Liver. 1998;18:2-13. [RCA] [PubMed] [DOI] [Full Text] [Cited by in Crossref: 172] [Cited by in RCA: 173] [Article Influence: 6.4] [Reference Citation Analysis (0)] |
| 13. | Gressner AM. The cell biology of liver fibrogenesis - an imbalance of proliferation, growth arrest and apoptosis of myofibroblasts. Cell Tissue Res. 1998;292:447-452. [RCA] [PubMed] [DOI] [Full Text] [Cited by in Crossref: 150] [Cited by in RCA: 142] [Article Influence: 5.3] [Reference Citation Analysis (0)] |
| 14. | Ledeboer A, Brevé JJ, Poole S, Tilders FJ, Van Dam AM. Interleukin-10, interleukin-4, and transforming growth factor-beta differentially regulate lipopolysaccharide-induced production of pro-inflammatory cytokines and nitric oxide in co-cultures of rat astroglial and microglial cells. Glia. 2000;30:134-142. [RCA] [PubMed] [DOI] [Full Text] [Cited by in RCA: 4] [Reference Citation Analysis (0)] |
| 15. | Marques CP, Hu S, Sheng W, Cheeran MC, Cox D, Lokensgard JR. Interleukin-10 attenuates production of HSV-induced inflammatory mediators by human microglia. Glia. 2004;47:358-366. [RCA] [PubMed] [DOI] [Full Text] [Cited by in Crossref: 54] [Cited by in RCA: 58] [Article Influence: 2.8] [Reference Citation Analysis (0)] |
| 16. | Mitchell MD, Simpson KL, Keelan JA. Paradoxical proinflammatory actions of interleukin-10 in human amnion: potential roles in term and preterm labour. J Clin Endocrinol Metab. 2004;89:4149-4152. [RCA] [PubMed] [DOI] [Full Text] [Cited by in Crossref: 35] [Cited by in RCA: 32] [Article Influence: 1.5] [Reference Citation Analysis (0)] |
| 17. | Zhang LJ, Yu JP, Li D, Huang YH, Chen ZX, Wang XZ. Effects of cytokines on carbon tetrachloride-induced hepatic fibrogenesis in rats. World J Gastroenterol. 2004;10:77-81. [PubMed] |
| 18. | Wang XZ, Zhang LJ, Li D, Huang YH, Chen ZX, Li B. Effects of transmitters and interleukin-10 on rat hepatic fibrosis induced by CCl4. World J Gastroenterol. 2003;9:539-543. [PubMed] |
| 19. | Flisiak R, Pytel-Krolczuk B, Prokopowicz D. Circulating transforming growth factor beta(1) as an indicator of hepatic function impairment in liver cirrhosis. Cytokine. 2000;12:677-681. [RCA] [PubMed] [DOI] [Full Text] [Cited by in Crossref: 46] [Cited by in RCA: 55] [Article Influence: 2.2] [Reference Citation Analysis (0)] |
| 20. | Lee BS, Kim NJ, Jeong HY, Lee HY, Kang DY, Noh SM. Changes in serum cytokine concentration: a morphological study of liver cirrhosis induced by common bile duct ligation in rats. Korean J Intern Med. 2003;18:6-12. [PubMed] |
| 21. | Flisiak R, Prokopowicz D. Transforming growth factor-beta1 as a surrogate marker of hepatic dysfunction in chronic liver diseases. Clin Chem Lab Med. 2000;38:1129-1131. [RCA] [PubMed] [DOI] [Full Text] [Cited by in Crossref: 9] [Cited by in RCA: 10] [Article Influence: 0.4] [Reference Citation Analysis (0)] |
| 22. | Nakamura T, Sakata R, Ueno T, Sata M, Ueno H. Inhibition of transforming growth factor beta prevents progression of liver fibrosis and enhances hepatocyte regeneration in dimethylnitrosamine-treated rats. Hepatology. 2000;32:247-255. [RCA] [PubMed] [DOI] [Full Text] [Cited by in Crossref: 198] [Cited by in RCA: 207] [Article Influence: 8.3] [Reference Citation Analysis (0)] |
| 23. | Xu XB, He ZP, Liang ZQ, Leng XS. [Obstruction of TGF-beta1 signal transduction by anti-Smad4 gene can therapy experimental liver fibrosis in the rat]. Zhonghua Ganzangbing Zazhi. 2004;12:263-266. [PubMed] |
| 24. | Wu XR, Lv MH, Wang Q, Shi SS, Guo WD. [The plasma levels of transforming growth factor beta1 and the protein expressions of alpha-SMA, urokinase plasminogen activator and plasminogen activator inhibitor-1 in liver of patients with different grades of hepatic fibrosis]. Zhonghua Ganzangbing Zazhi. 2004;12:400-402. [PubMed] |
| 25. | Ma C, Chegini N. Regulation of matrix metalloproteinases (MMPs) and their tissue inhibitors in human myometrial smooth muscle cells by TGF-beta1. Mol Hum Reprod. 1999;5:950-954. [RCA] [PubMed] [DOI] [Full Text] [Cited by in Crossref: 50] [Cited by in RCA: 52] [Article Influence: 2.0] [Reference Citation Analysis (0)] |
| 26. | Knittel T, Mehde M, Kobold D, Saile B, Dinter C, Ramadori G. Expression patterns of matrix metalloproteinases and their inhibitors in parenchymal and non-parenchymal cells of rat liver: regulation by TNF-alpha and TGF-beta1. J Hepatol. 1999;30:48-60. [RCA] [PubMed] [DOI] [Full Text] [Cited by in Crossref: 240] [Cited by in RCA: 238] [Article Influence: 9.2] [Reference Citation Analysis (0)] |


