Copyright
©The Author(s) 2003.
World J Gastroenterol. Sep 15, 2003; 9(9): 1909-1914
Published online Sep 15, 2003. doi: 10.3748/wjg.v9.i9.1909
Published online Sep 15, 2003. doi: 10.3748/wjg.v9.i9.1909
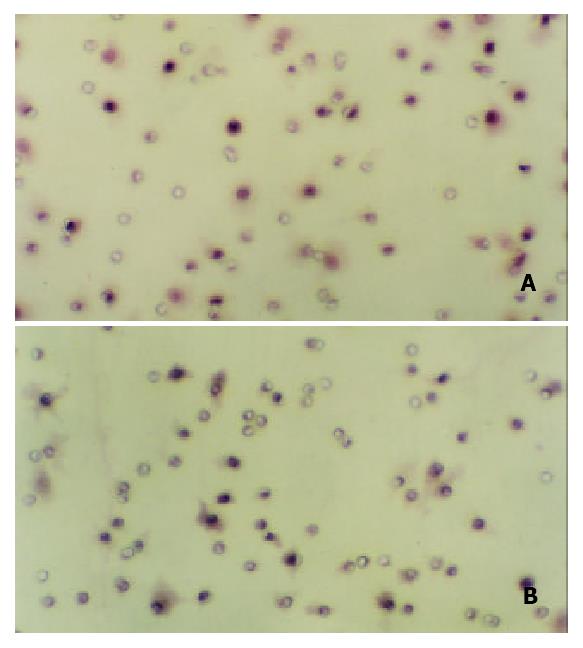
Figure 1 Effect of c9,t11-CLA on invasion of SGC-7901 cells detected by reconstituted basement membrane invasion assay (100 ×).
A: There are more invading SGC-7901 cells in the nega-tive control group. B: There are less invading SGC-7901 cells in the 200 μmol/L c9,t11-CLA group.
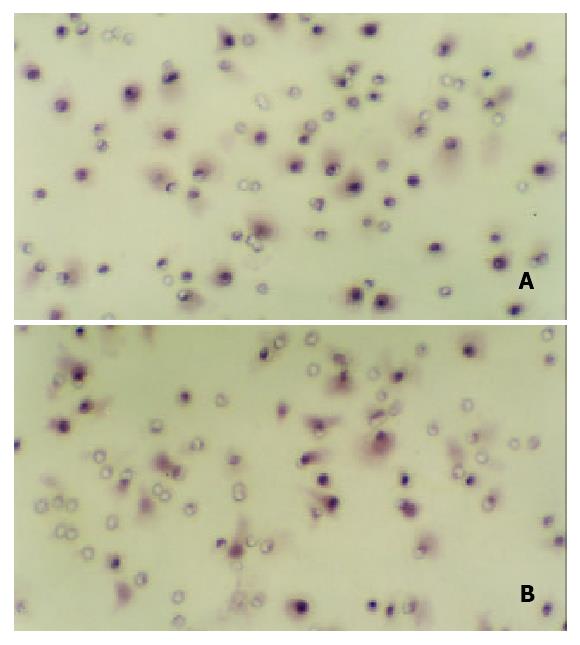
Figure 2 Effect of c9,t11-CLA on chemotaxic migration of SGC-7901 cells detected by chemotaxied-motion assay (100 ×).
A: There are more invading SGC-7901 cells in the negative con-trol group. B: There are less invading SGC-7901 cells in the 200 μmol/L c9,t11-CLA group.
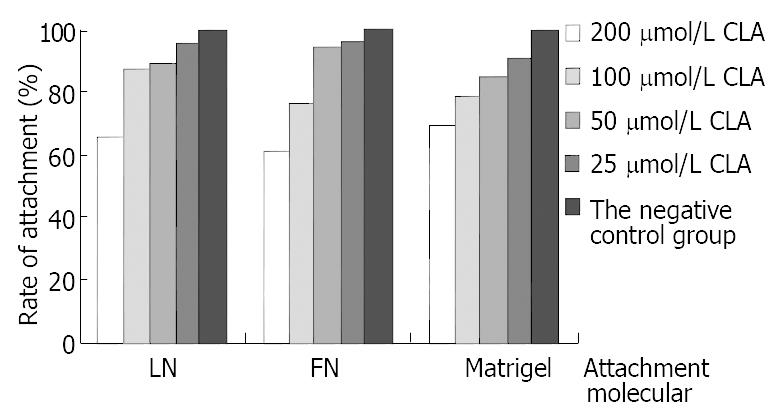
Figure 3 Effect of c9,t11-CLA on the attachment ability of SGC-7901 cells.
Figure 4 Effects of c9,t11-CLA on Gelatinase secretion in SGC-7901 cells detected by zymography.
A, B, C, D are 200 μmol/L, 100 μmol/L, 50 μmol/L, 25 μmol/L c9,t11-CLA, respectively. E is the negative control group.
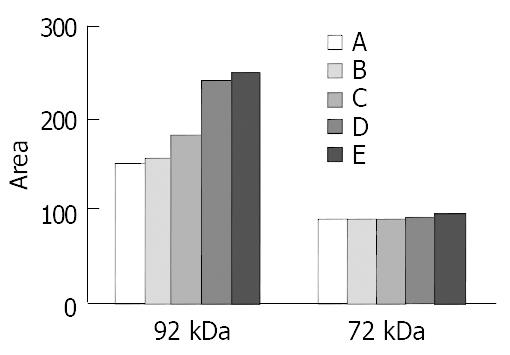
Figure 5 Quantitation of 92 and 72 kDa type IV Collagenase levels in SGC-7901 cells by ChemiImager 4000.
A, B, C, D are 200 μmol/L, 100 μmol/L, 50 μmol/L, 25 μmol/L c9,t11-CLA, respectively. E is the negative control group.
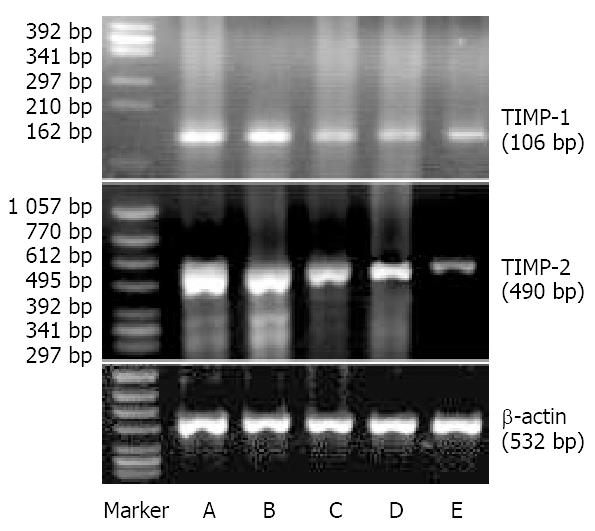
Figure 6 Effects of c9,t11-CLA on expression of TIMP-1 mRNA and TIMP-2 mRNA in SGC-7901 cells detected by RT-PCR.
Top: Expression of TIMP-1 mRNA. Middle: Expression of TIMP-2 mRNA. A, B, C, D are 20 μmol/L, 100 μmol/L, 50 μmol/L, 25 μmol/L c9,t11-CLA, respectively. E is the negative control group.
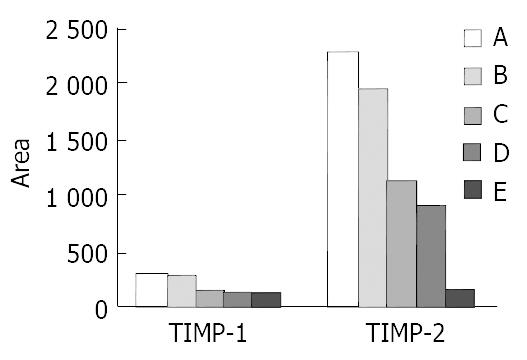
Figure 7 Quantitation of TIMP-1 and TIMP-2 mRNA levels in the SGC-7901 cells by ChemiImager 4000.
A, B, C, D are 200 μmol/L, 100 μmol/L, 50 μmol/L, 25 μmol/L c9,t11-CLA, respectively. E is the negative control group.
-
Citation: Chen BQ, Yang YM, Gao YH, Liu JR, Xue YB, Wang XL, Zheng YM, Zhang JS, Liu RH. Inhibitory effects of
c 9,t 11-conjugated linoleic acid on invasion of human gastric carcinoma cell line SGC-7901. World J Gastroenterol 2003; 9(9): 1909-1914 - URL: https://www.wjgnet.com/1007-9327/full/v9/i9/1909.htm
- DOI: https://dx.doi.org/10.3748/wjg.v9.i9.1909


