Copyright
©The Author(s) 2003.
World J Gastroenterol. Aug 15, 2003; 9(8): 1689-1696
Published online Aug 15, 2003. doi: 10.3748/wjg.v9.i8.1689
Published online Aug 15, 2003. doi: 10.3748/wjg.v9.i8.1689
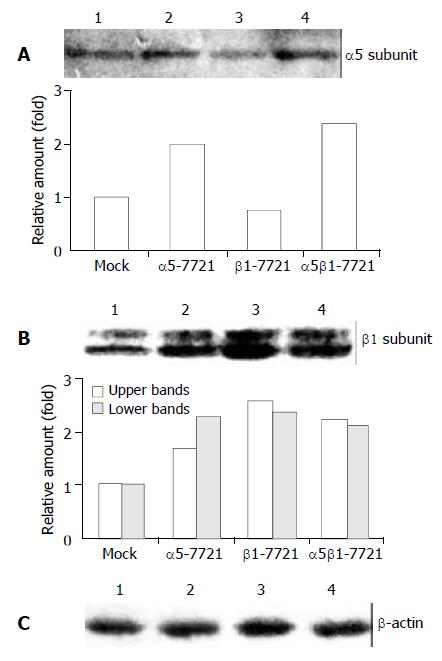
Figure 1 Integrin α5 and β1 protein levels in α5-, β1- and α5β1 transfected SMMC-7721 cells.
(A) The expression level of α5 chain was increased in α5-7721 and α5β1-7721 cells. (B) Two forms of β1 integrin were due to different levels of β1-chain glycosylation. The hypoglycosylated lower band was tenta-tively identified as biosynthetic precursor of β1 subunit, the hyperglycosylated upper band was mature subunits, exposed in part on the cell surface (the 130-kDa product). Immunoblot assay showed that protein levels of the mature form were el-evated in the transfectants, especially in β1-7721 and α5β1-7721 cells. (C) The protein level of β-actin showed an equal loading amount in each well. Lane 1, mock cells; lane 2, α5-7721; lane 3, β1-7721; lane 4, α5β1-7721. Each point in the graphs was the mean value from three separate experiments.
Figure 2 S-phase delay was induced in β1- and α5β1-transfectant cells.
For cell cycle analysis, transfected and mocked cells were synchronized by exposure to SFM for 48 h, then grown in RPMI1640 medium containing 10% CBS and penicillin/streptomycin solution. Twelve or 16 h later, the cells were collected and analysed for flow cytometry as described under “Materials and Methods”. A, mocked cells; B, α5-7721 cells; C, β1-7721 cells; D, α5β1-7721 cells. Each bar in graph represented the mean ± SD obtained from three independent experiments. The S-phase delay was significantly different in β1-7721 and α5β1-7721 cells (n = 3, bP < 0.01 vs mocked cells).
Figure 3 Message RNA and/or protein levels of cell cycle regu-latory genes p21cip1 and p27 kip1 in β1-7721 and α5β1-7721 transfectants, but not that of cyclin D1 and cdk2.
(A) Immunoblot assay showed the protein level of cyclin D1 and cdk2 were not apparently affected, but p21cip1 and p27kip1 pro-tein levels were increased in β1-7721 and α5β1-7721 cells. The protein level of β-actin was detected to assess the loading amount in each well in SDS-PAGE gel. (B) Message RNA lev-els of p21cip1 and p27kip1 were assessed by RT-PCR, and nor-malized by that of β-actin. It was apparent that mRNA level of p21cip1 was increased in β1- and α5β1- transfected cells. However, the p27kip1 mRNA amount was the same as control. Each result represented three separate experiments. Lane 1, mocked cell; lane 2, α5-7721; lane 3, β1-7721; lane 4, α5β1-7721.
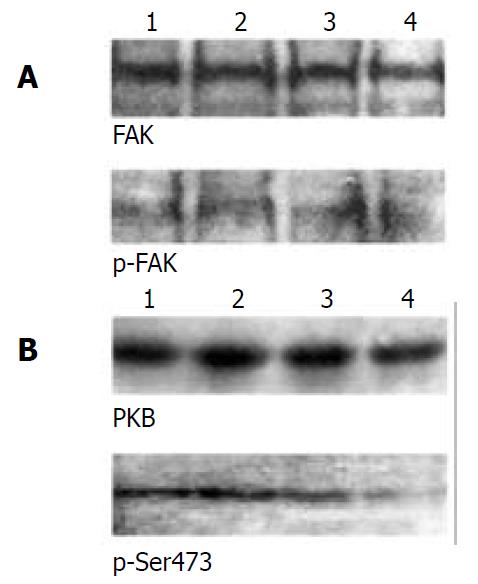
Figure 4 Activation of PKB, but not FAK, was downregulated in β1- and α5β1- transfected cells.
(A) FAK activation was as-sessed by phosphotyrosine- specific antibody, followed by stripping and reprobing with anti-FAK antibody. (B) PKB and its Ser473-phosphorylated forms were determined by 10% SDS-PAGE with the equal loading amount. The loading amount control is shown in Figure 1C and Figure 3A. Lane 1, mock cells; lane 2, α5-7721; lane 3, β1-7721; lane 4, α5β1-7721. Results were representative of 4 repeated experiments.
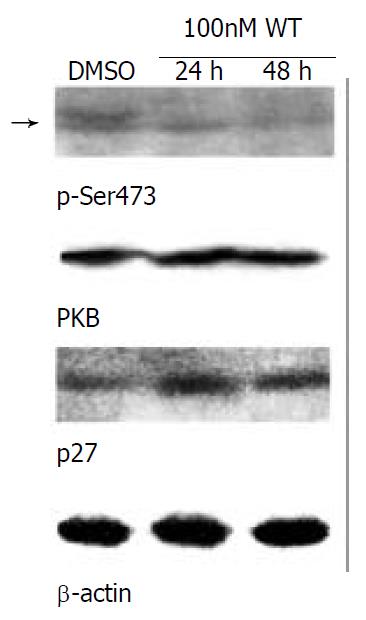
Figure 5 Ser473-phosphorylated form of PKB was decreased, but p27kip1 protein level was increased concomitantly in SMMC-7721 parental cells treated with the PI3K inhibitor wortmannin.
The parental SMMC-7721 cells were starved with serum-free medium for 48 h, then grown in normal medium/10% CBS containing DMSO (as control, 24 h) or 100 nM wortmannin for the indicated times. The amount of DMSO did not exceed 0.1%, which was determined not to damage the cells. Equal amount of wortmannin was added again after grown for 24 h. The level of Ser473-phosphorylated form of PKB (arrow) was declined, but p27kip1 protein level was elevated with the treatment of wortmannin in SMMC-7721 cells. Results were representative of at least 3 repeated experiments. Abbreviation: DMSO, dimethylsulfoxide; WT, wortmannin.
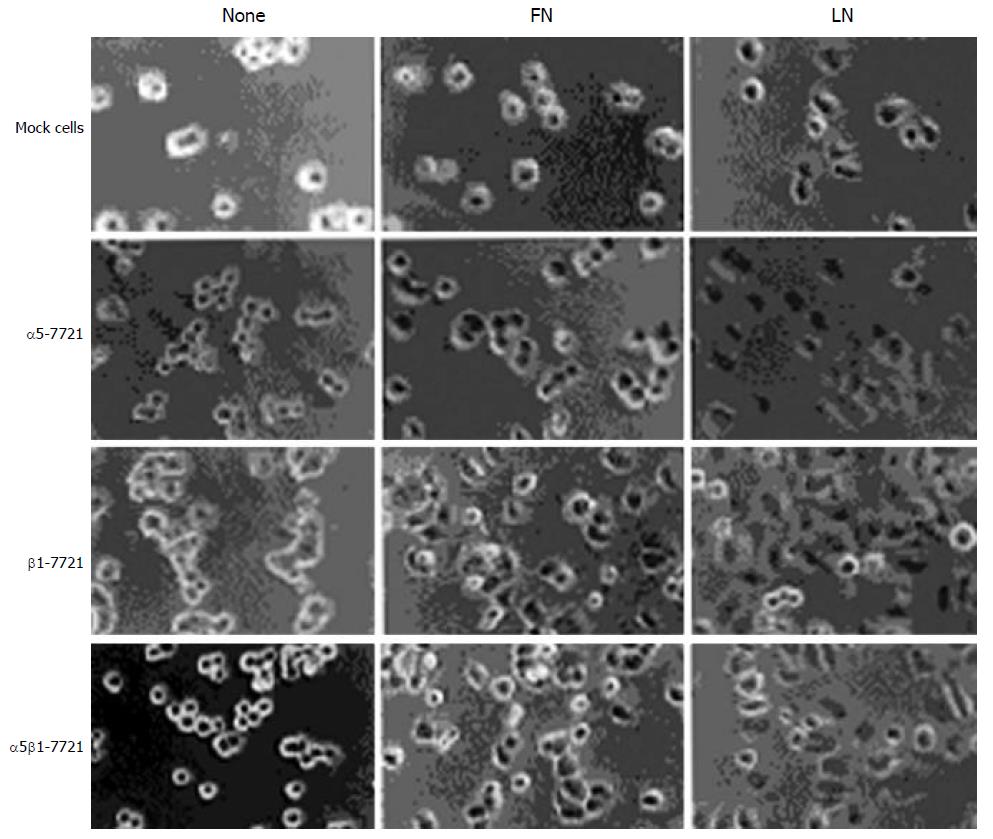
Figure 6 β1-7721 and α5β1-7721 cells subjected to spreading on fibronectin- or laminin- coated culture dishes.
The mocked and transfected cells were plated on FN- or LN- coated tissue culture plates in normal medium for 60 min, then cells on the plates were photographed by phase-contrast microscopy with a digital camera. Abbreviations: FN, fibronectin; LN, laminin.
Figure 7 Effects of laminin on transfected cells.
Protein levels of phosphorylated FAK (A) and Ser473-phosphorylated form of PKB (B) were increased in the transfected cells, especially in β1-7721 and α5β1-7721 cells grown in the LN-coated culture dishes for 60 minutes. (C) Under the same condition, p27kip1 protein level was decreased in β1-7721 and α5β1-7721 cells. Lane 1, mock cells; lane 2, α5-7721; lane 3, β1-7721; lane 4, α5β1-7721. Each result represented at least 3 independent experiments.
Figure 8 The percentage of cells in S phase was increased in SMMC-7721 cells plated on poly-HEME-coated petri dishes.
The parental SMMC-7721 cells were plated on poly-HEME-coated petri dishes, and cultured in normal medium for 24 h (A), 48 h (B) or 72 h (C), respectively, then collected and analysed by flow cytometry. The cell cycle pattern (C) was simi-lar to that of β1-7721 or α5β1-7721 cells.
- Citation: Liang YL, Lei TW, Wu H, Su JM, Wang LY, Lei QY, Zha XL. S-phase delay in human hepatocellular carcinoma cells induced by overexpression of integrin β1. World J Gastroenterol 2003; 9(8): 1689-1696
- URL: https://www.wjgnet.com/1007-9327/full/v9/i8/1689.htm
- DOI: https://dx.doi.org/10.3748/wjg.v9.i8.1689


