Copyright
©The Author(s) 2003.
World J Gastroenterol. Jul 15, 2003; 9(7): 1611-1614
Published online Jul 15, 2003. doi: 10.3748/wjg.v9.i7.1611
Published online Jul 15, 2003. doi: 10.3748/wjg.v9.i7.1611
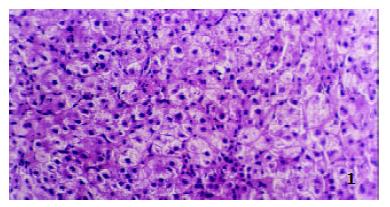
Figure 1 The liver tissue before treatment with heparin.
H&E staining. × 200.
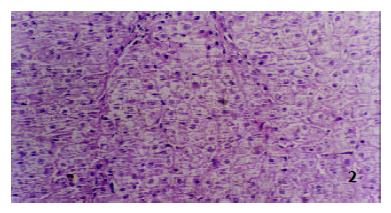
Figure 2 The liver tissue after treatment with heparin.
H&E staining. × 200.
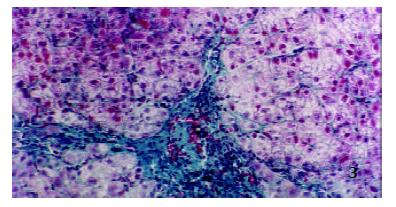
Figure 3 The liver tissue before treatment with heparin.
Masson staining. × 200.
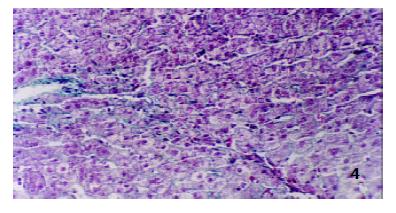
Figure 4 The liver tissue after treatment with heparin.
Masson staining. × 200.
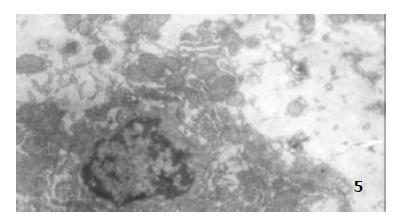
Figure 5 The hepatocyte before treatment heparin.
× 6000.
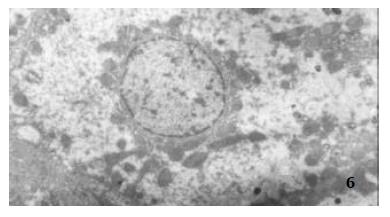
Figure 6 The hepatocyte after treatment with with heparin.
× 3500.
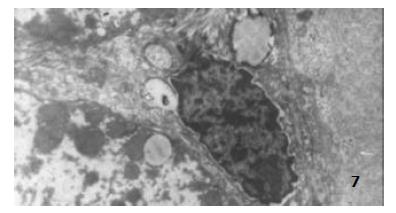
Figure 7 The Ito cell before treatment with heparin.
× 5000.
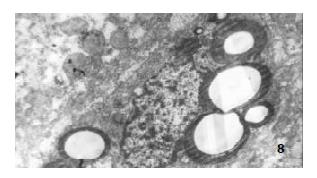
Figure 8 The Ito cell after treatment with with heparin.
× 5000.
- Citation: Shi J, Hao JH, Ren WH, Zhu JR. Effects of heparin on liver fibrosis in patients with chronic hepatitis B. World J Gastroenterol 2003; 9(7): 1611-1614
- URL: https://www.wjgnet.com/1007-9327/full/v9/i7/1611.htm
- DOI: https://dx.doi.org/10.3748/wjg.v9.i7.1611


