Copyright
©The Author(s) 2003.
World J Gastroenterol. Jul 15, 2003; 9(7): 1584-1588
Published online Jul 15, 2003. doi: 10.3748/wjg.v9.i7.1584
Published online Jul 15, 2003. doi: 10.3748/wjg.v9.i7.1584
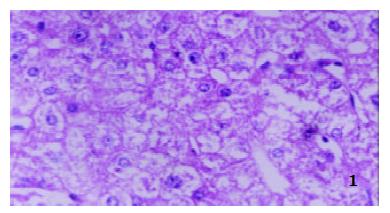
Figure 1 The liver tissue in portal hypertensive patients with HE staining (× 400).
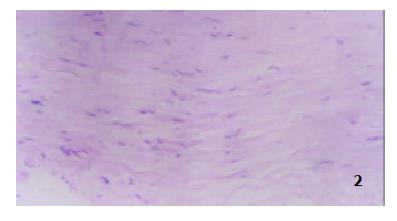
Figure 2 Splenic vein in portal hypertensive patients with HE staining method (× 400).
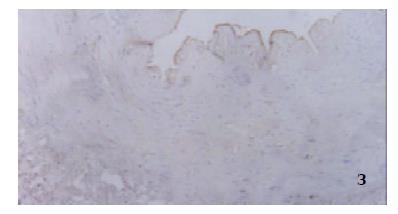
Figure 3 Splenic vein in portal hypertensive patients by immunohistochemical staining with α-cm-actin antibody (× 400).
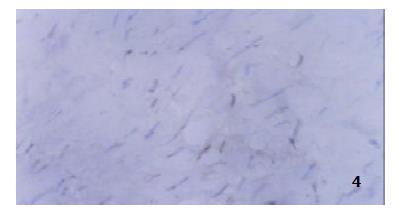
Figure 4 Splenic vein in portal hypertensive patients by immunohistochemical staining with PCNA (× 400).
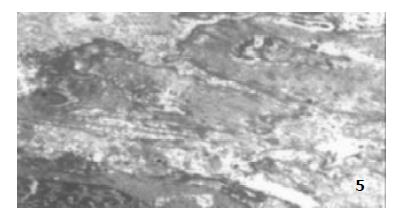
Figure 5 Splenic vein of portal hypertensive patients under transmission electron microscope (× 4000).
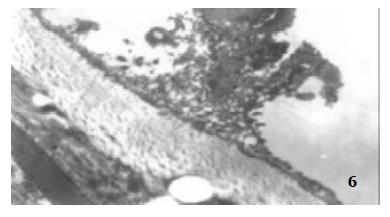
Figure 6 Splenic vein of portal hypertensive patients under transmission electron microscope (× 6000).
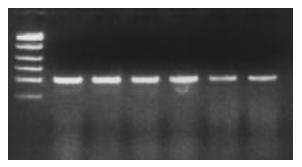
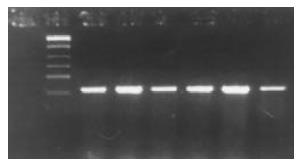
Figure 7 Expression of human β-actin mRNA (Note: from left to right there was PCR marker and lanes 1-6, figures 8, 9 were the same).
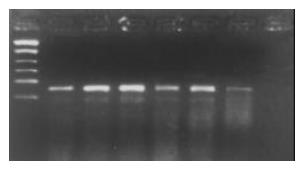
Figure 8 Expression of local renin mRNA in the liver, splenic artery and vein from the controls and cirrhotic portal hypertensive patients.
Lanes 1, 3, 5 were splenic vein, artery and liver from controls, Lanes 2, 4, 6 were from patients.
Figure 9 Expression of local angiotensinogen mRNA in the liver, splenic artery and vein from controls and portal hypertensive patients.
Lanes 1, 2, 3 were splenic vein, artery and liver from controls, Lanes 4, 5, 6 were from portal hypertensive patients.
- Citation: Zhang L, Yang Z, Shi BM, Li DP, Fang CY, Qiu FZ. Expression of local renin and angiotensinogen mRNA in cirrhotic portal hypertensive patient. World J Gastroenterol 2003; 9(7): 1584-1588
- URL: https://www.wjgnet.com/1007-9327/full/v9/i7/1584.htm
- DOI: https://dx.doi.org/10.3748/wjg.v9.i7.1584


