Copyright
©The Author(s) 2003.
World J Gastroenterol. Jul 15, 2003; 9(7): 1439-1443
Published online Jul 15, 2003. doi: 10.3748/wjg.v9.i7.1439
Published online Jul 15, 2003. doi: 10.3748/wjg.v9.i7.1439
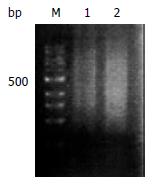
Figure 1 Size range of mRNA on 2% agarose gel electrophorsis.
Normal gastric mucosa mRNA (lane1) and gastric carcinoma mRNA (lane 2). 100 bp size marker (lane M).
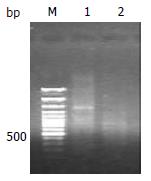
Figure 2 Digested and undigested double strands cDNA products.
Undigested double strands cDNA products (lane 1) and RsaI digested double strands cDNA products (lane 2). 100bp size marker (lane M).
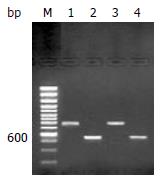
Figure 3 Detection of adaptors ligation efficiency.
Tester1-1 was amplified with G3PDH3' primer, PCR primer1 (lane 1) and tester1-1 with G3PDH3’, 5'primers (lane 2). Tester1-2 was amplified with G3PDH3'primer, PCR primer1 (lane 3) and tester1-2 with G3PDH3’, 5'primers (lane 4). 100 bp size marker (lane M).
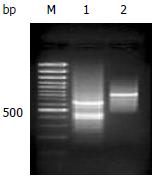
Figure 4 Analyses of PCR products.
Secondary PCR products of subtraction samples (lane 1) and unsubtraction samples (lane 2). 100 bp size marker (lane M).
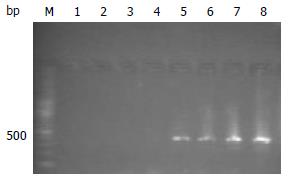
Figure 5 Identification of subtraction efficiency by PCR.
G3PDH PCR products of subtracted samples at 18, 23, 28 and 33 cycles (lanes1, 2, 3 and 4) respectively and G3PDH PCR products of unsubtracted samples respectively at 18, 23, 28 and 33 cycles (lanes 5, 6, 7 and 8). 100 bp size marker (lane M).
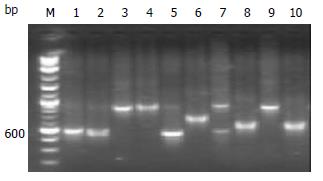
Figure 6 Identification of inserted fragments in plasmids of library by PCR.
Inserted fragments in plasmids of library (lanes 1-10). 100 bp size marker (lane M).
- Citation: Du JJ, Dou KF, Peng SY, Xiao HS, Wang WZ, Guan WX, Wang ZH, Gao ZQ, Liu YB. cDNA suppression subtraction library for screening down-regulated genes in gastric carcinoma. World J Gastroenterol 2003; 9(7): 1439-1443
- URL: https://www.wjgnet.com/1007-9327/full/v9/i7/1439.htm
- DOI: https://dx.doi.org/10.3748/wjg.v9.i7.1439


