Copyright
©The Author(s) 2003.
World J Gastroenterol. Jun 15, 2003; 9(6): 1251-1255
Published online Jun 15, 2003. doi: 10.3748/wjg.v9.i6.1251
Published online Jun 15, 2003. doi: 10.3748/wjg.v9.i6.1251
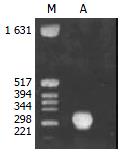
Figure 1 Amplification of HBV DNA in the 2.
2.15 cells with PCR. The PCR products were resolved on 1.5% agarose gel. M: Molecule weight marker; A: HBV DNA in 2.2.15 cells.
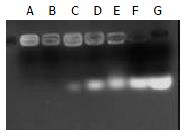
Figure 2 Analysis of Gal-PLL/asODNs complex formation at different molar ratios.
A: Gal-PLL/asODNs = 3:1; B: Gal-PLL/asODNs = 2:1; C: Gal-PLL/asODNs = 1.75:1; D: Gal-PLL/asODNs = 1.5:1; E: Gal-PLL/asODNs = 1:1; F: Gal-PLL/asODNs = 0. 5:1; G: Gal-PLL/asODNs = 0:1.
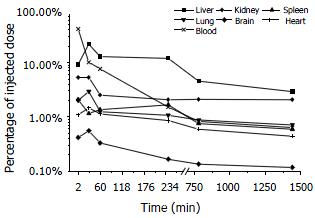
Figure 3 Distribution of asODNs in Kunming mice (n = 2).
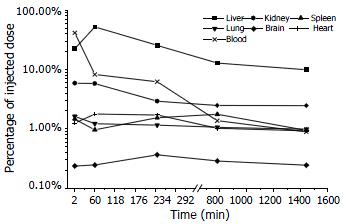
Figure 4 Distribution of Gal-PLL-asODNs in Kunming mice (n = 2).
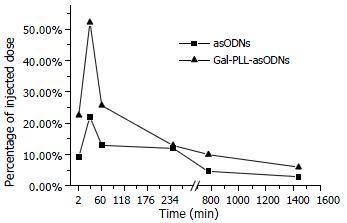
Figure 5 Comparision of the amount retained in liver between asODNs and Gal-PLL-asODNs (n = 2).
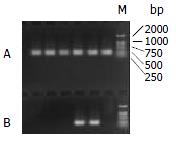
Figure 6 Products of HBV DNA nested-PCR in the mice serum after 12 d treatment.
Lane A: Products of HBVDNA nested-PCR in serum after normal saline treatment; Lane B: Products of HBVDNA nested-PCR in serum after asODNs treatment. M: Molecule weight marker.
- Citation: Zheng SJ, Zhong S, Zhang JJ, Chen F, Ren H, Deng CL. Distribution and anti-HBV effects of antisense oligodeoxynu-cleotides conjugated to galactosylated poly-L-lysine. World J Gastroenterol 2003; 9(6): 1251-1255
- URL: https://www.wjgnet.com/1007-9327/full/v9/i6/1251.htm
- DOI: https://dx.doi.org/10.3748/wjg.v9.i6.1251


