Copyright
©The Author(s) 2003.
World J Gastroenterol. May 15, 2003; 9(5): 951-955
Published online May 15, 2003. doi: 10.3748/wjg.v9.i5.951
Published online May 15, 2003. doi: 10.3748/wjg.v9.i5.951
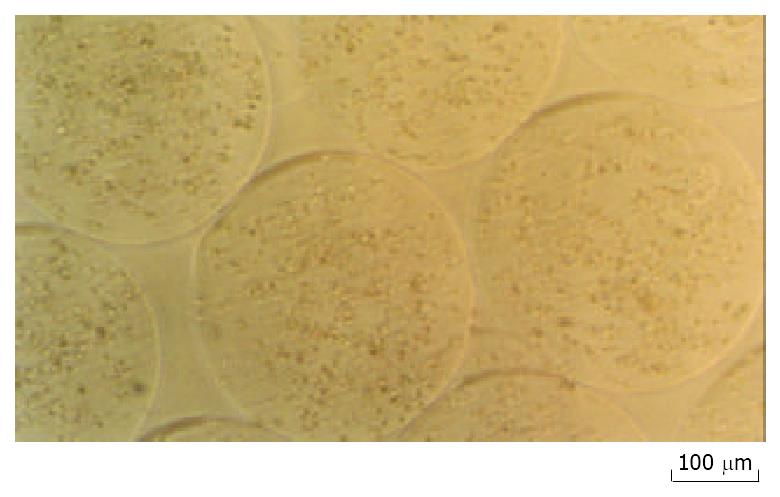
Figure 1 NIH3T3-mIL-12 cells-loaded microcapsules (average capsule diameter 450 µm).
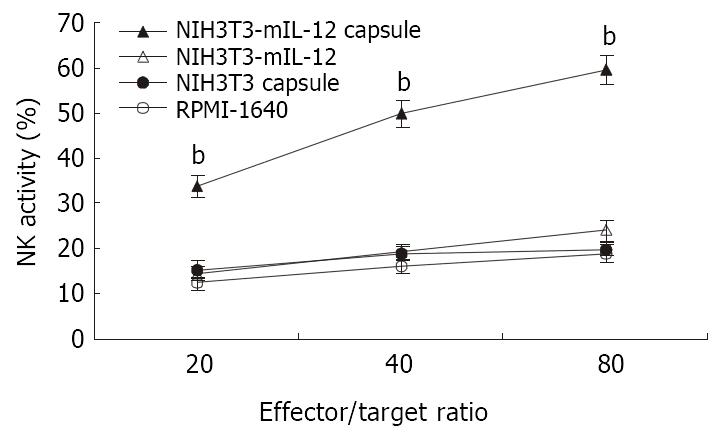
Figure 2 NK activity induced by various treatment.
-x±s, n = 10, bP < 0.01 for the group treated with NIH3T3-mIL-12 cells capsule versus other three counterpart groups, respectively.
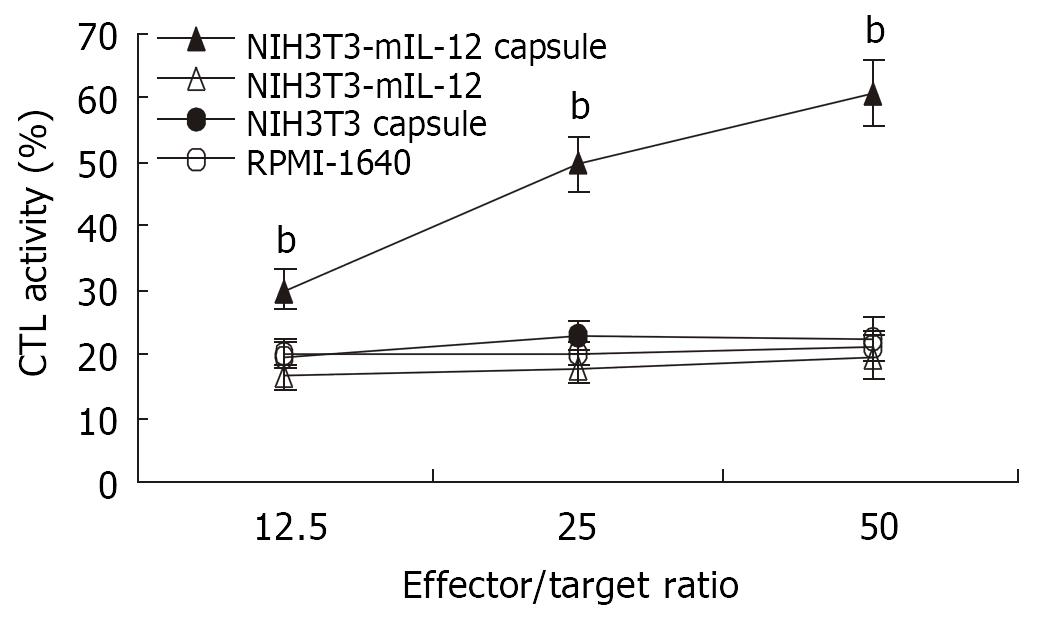
Figure 3 CTL activity against CT26 induced by various treatment.
-x±s, n = 10, bP < 0.01 for the group treated with NIH3T3-mIL-12 cells capsule versus other three counterpart groups, respectively.
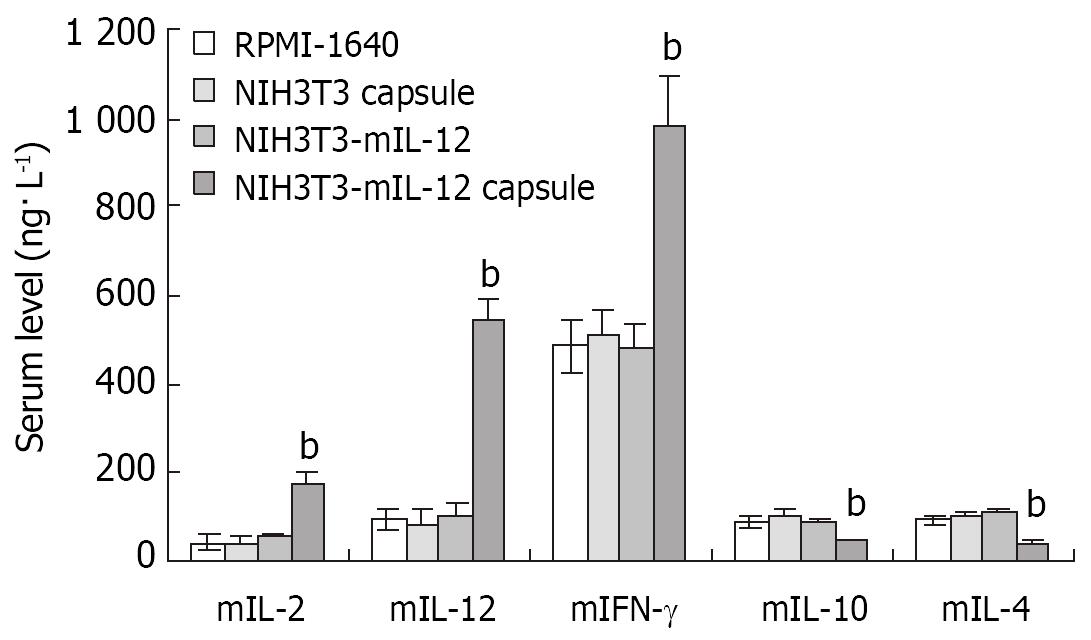
Figure 4 Cytokines levels in serum after various treatment in the tumor-bearing model.
-x±s, n = 10, bP < 0.01 for the group treated with NIH3T3-mIL-12 cells capsule versus other three counterpart groups, respectively.
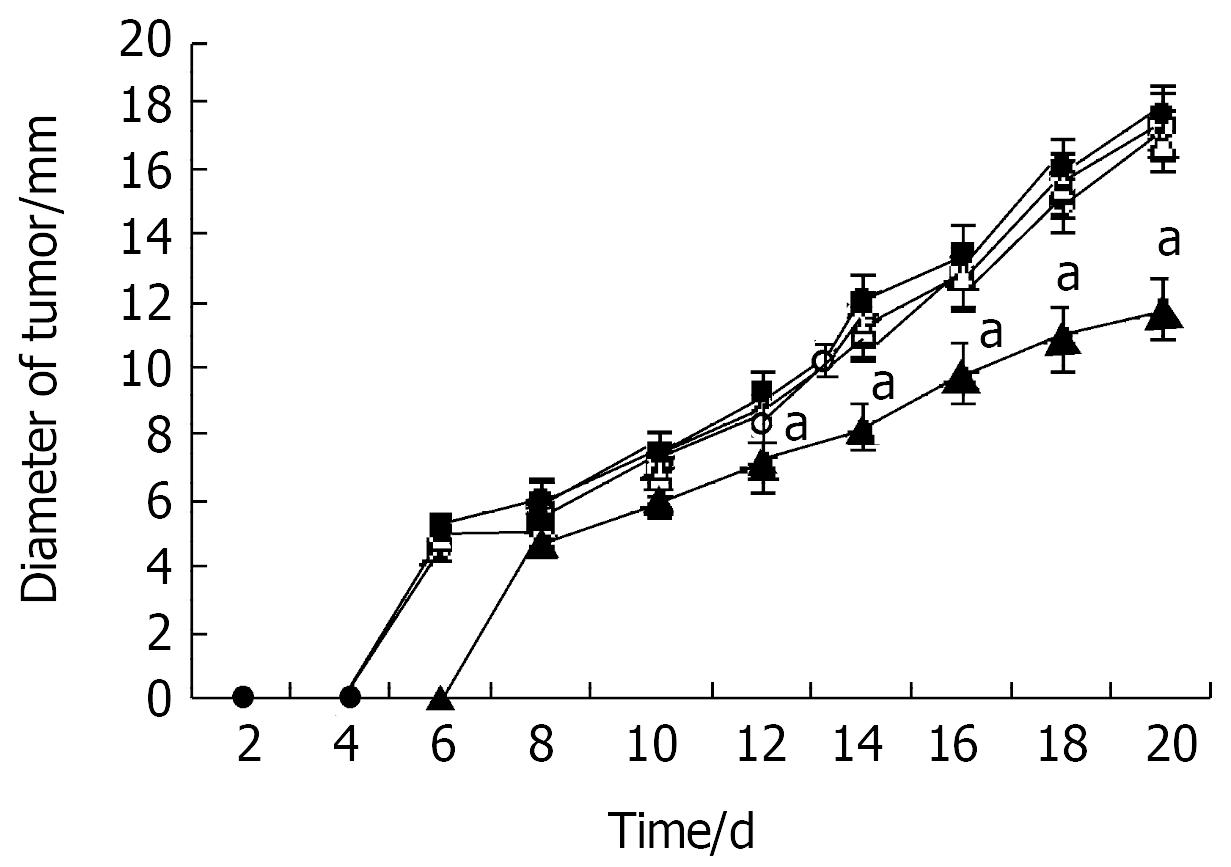
Figure 5 Inhibition of tumor growth by microencapsulated NIH3T3-mIL-12.
Two days after tumor inoculation, mice were injected sc with NIH3T3-mIL-12 cells capsule (▲), NIH3T3-mIL-12 cells (△), NIH3T3 cells capsule (●) or RPMI-1640 (○). -x±s, n = 20, aP < 0.05 for the group treated with NIH3T3-mIL-12 cells capsule versus other three counterpart groups respectively.
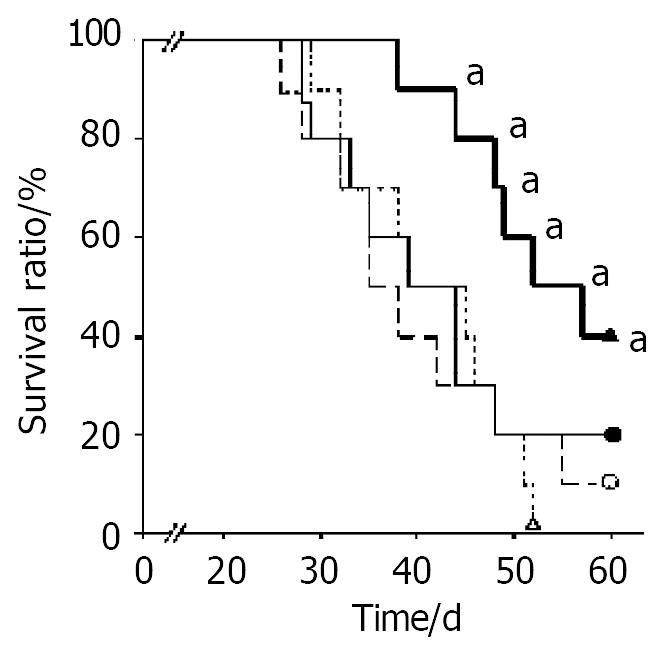
Figure 6 Survival time after various treatment in the tumor-bearing model.
Two days after tumor inoculation, mice were injected sc with RPMI-1640 (○), NIH3T3 cells capsule (●), NIH3T3-mIL-12 cells (△) and NIH3T3-mIL-12 cells capsule (▲), respectively. Ten tumor-bearing mice (n = 10) in each group were observed for their survival time. All surviving mice were monitored for at least 60 d. aP < 0.05, compared with other three counterpart groups, respectively.
- Citation: Zheng S, Xiao ZX, Pan YL, Han MY, Dong Q. Continuous release of interleukin 12 from microencapsulated engineered cells for colon cancer therapy. World J Gastroenterol 2003; 9(5): 951-955
- URL: https://www.wjgnet.com/1007-9327/full/v9/i5/951.htm
- DOI: https://dx.doi.org/10.3748/wjg.v9.i5.951


