Copyright
©The Author(s) 2003.
World J Gastroenterol. May 15, 2003; 9(5): 1020-1027
Published online May 15, 2003. doi: 10.3748/wjg.v9.i5.1020
Published online May 15, 2003. doi: 10.3748/wjg.v9.i5.1020
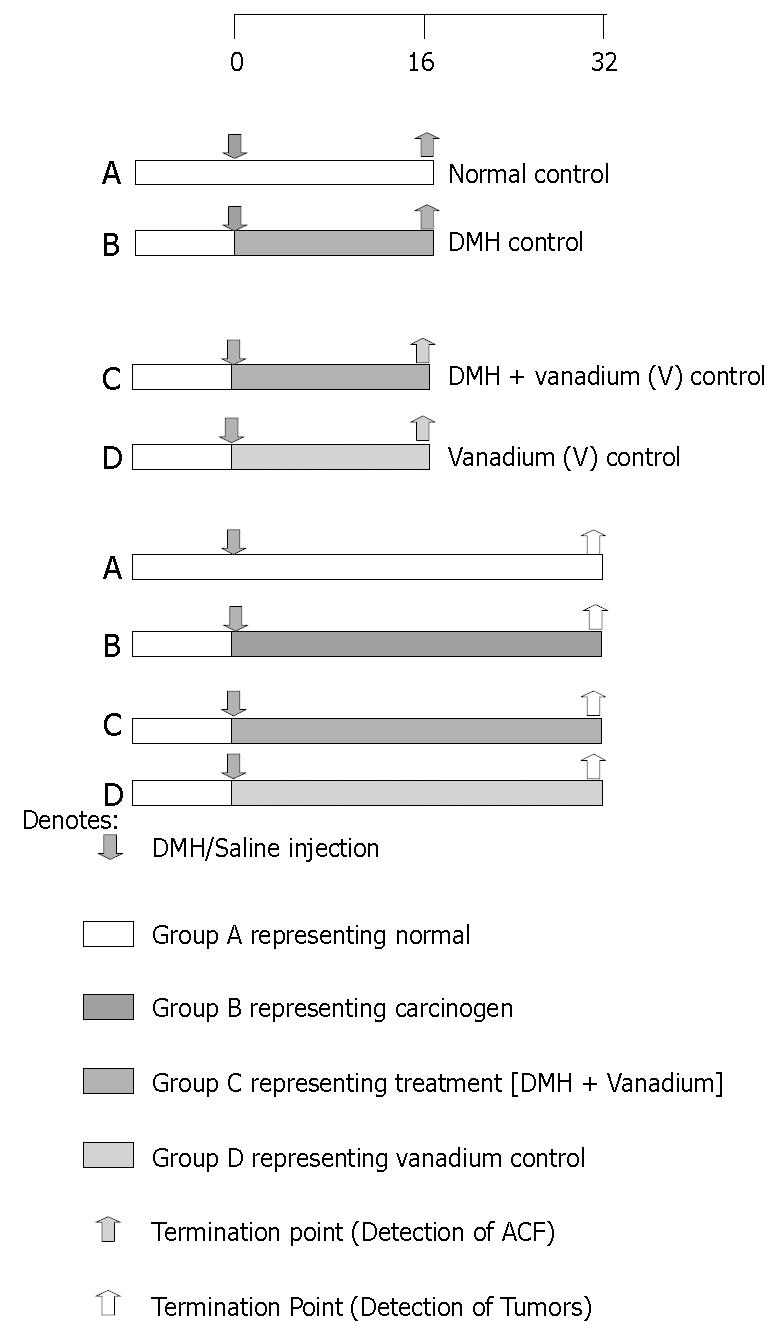
Figure 1 Grouping and different time point of the experiment.
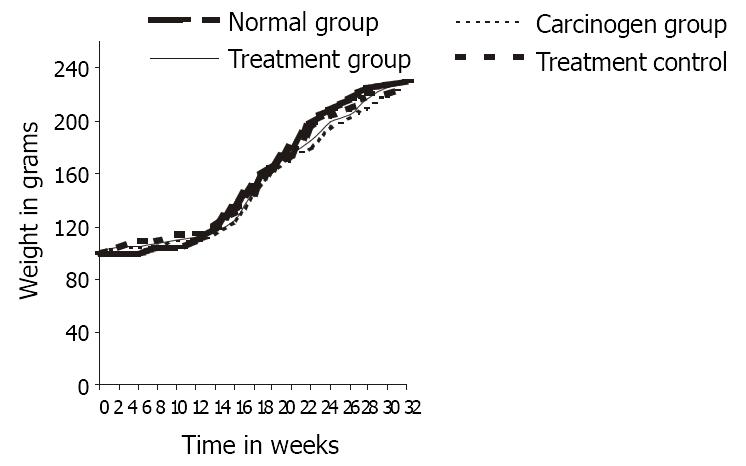
Figure 2 Depicts the body weights of different group of animals.
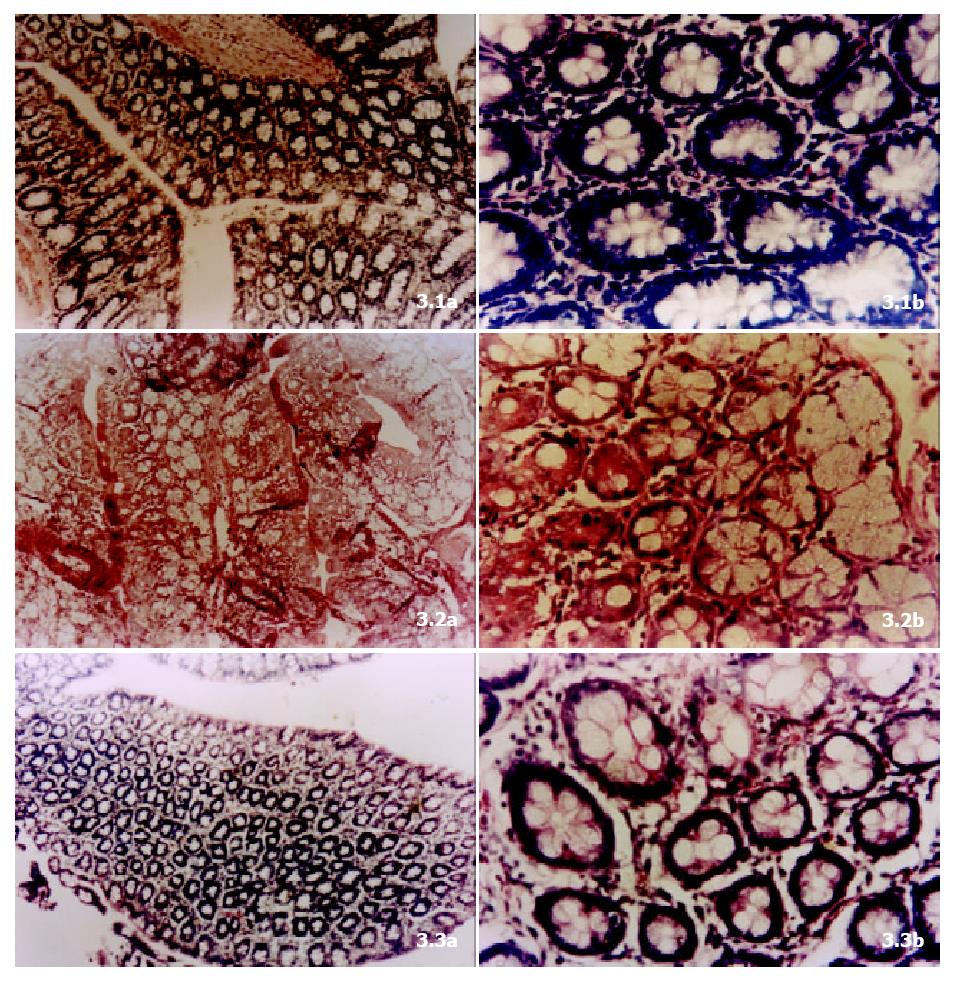
Figure 3 3.
1a: showing the normal colonic architecture view of rats sacrificed at end of week 16 (Low power). 3.1b: showing the normal colonic architecture view of rats sacrificed at end of week 16 (High power). 3.2a: representing the carcinogen-induced group B rats sacrificed at end of week 16 (Low power). 3.2b: representing the carcinogen-induced group B rats sacrificed at end of week 16 (High power). 3.3a: showing the treatment with vanadium group C rats sacrificed at the end of week 16 (Low power). 3.3b: showing the treatment with vanadium group C rats sacrificed at the end of week 16 (High power).
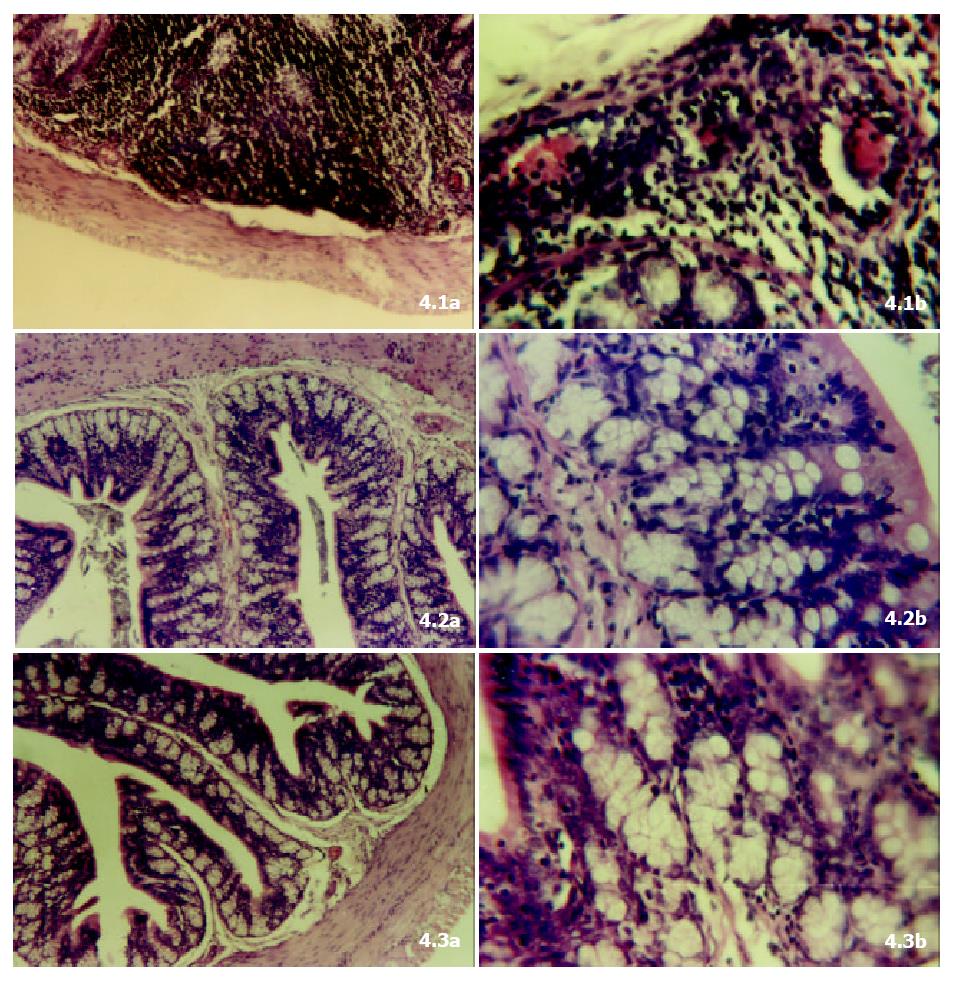
Figure 4 4.
1a: showing the carcinogen-induced group B rats sacrificed at end of week 32 (Low power). 4.1b: showing the carcinogen-induced group B rats sacrificed at end of week 32 (High power). 4.2a: showing the treatment with vanadium group C rats sacrificed at the end of week 32 (Low power). 4.2b: showing the treatment with vanadium group C rats sacrificed at the end of week 32 (High power). 4.3a: showing the vanadium control group D rats with no signs of toxicity sacrificed at the end of week 32 (Low power). 4.3b: showing the vanadium control group D rats with no signs of toxicity sacrificed at the end of week 32 (High power).
- Citation: Kanna PS, Mahendrakumar C, Chakraborty T, Hemalatha P, Banerjee P, Chatterjee M. Effect of vanadium on colonic aberrant crypt foci induced in rats by 1,2 Dimethyl hydrazine. World J Gastroenterol 2003; 9(5): 1020-1027
- URL: https://www.wjgnet.com/1007-9327/full/v9/i5/1020.htm
- DOI: https://dx.doi.org/10.3748/wjg.v9.i5.1020


