Copyright
©The Author(s) 2003.
World J Gastroenterol. Apr 15, 2003; 9(4): 701-705
Published online Apr 15, 2003. doi: 10.3748/wjg.v9.i4.701
Published online Apr 15, 2003. doi: 10.3748/wjg.v9.i4.701
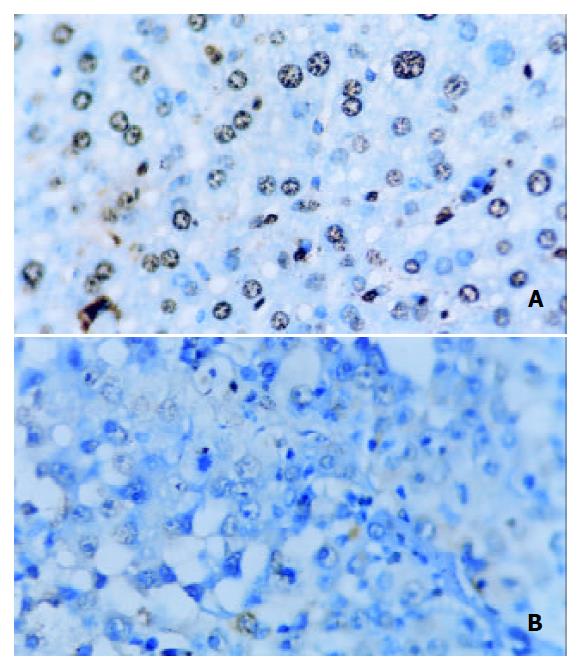
Figure 1 TUNEL marker (Nucleolus with brown granule in-dicated positive).
A: Star-99 group; B: saline group; × 400.
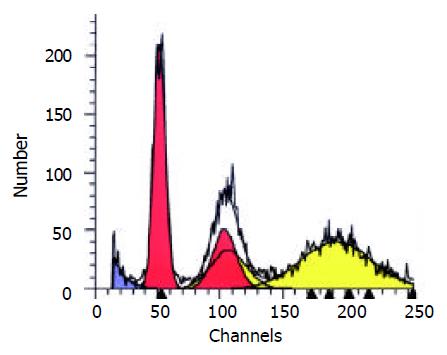
Figure 2 FCM DNA analysis showed the hereroploidy peak in the saline group.
(Yellow peak).
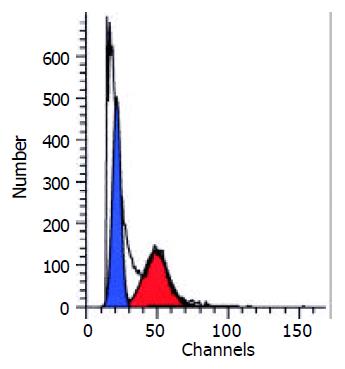
Figure 3 FCM DNA analysis showed the apoptosis peak in the Star-99 group.
(Blue peak).
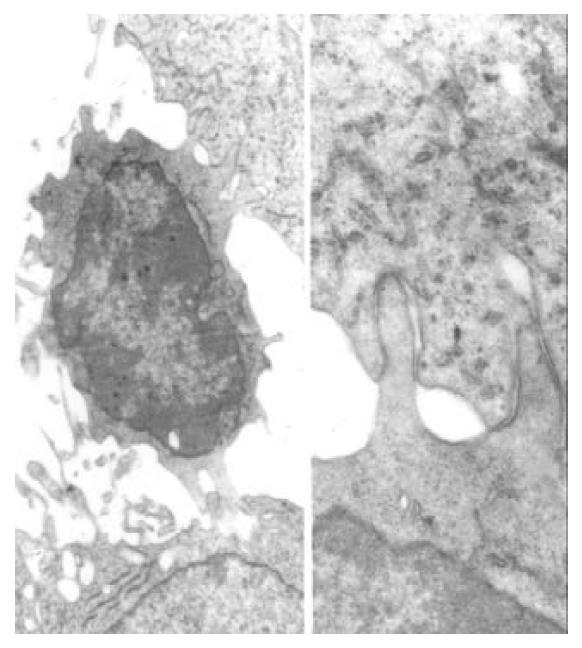
Figure 4 Many lymphocytes could be seen in the tumor tissues and the microvilli on the surface of the lymphocytes attacking the cancer cells in the Star-99 group (The right figure is a mag-nified image.
).
- Citation: Lin LW, Lin XD, He YM, Gao SD, Xue ES. Experimental study on ultrasound-guided intratumoral injection of “Star-99” in treatment of hepatocellular carcinoma of nude mice. World J Gastroenterol 2003; 9(4): 701-705
- URL: https://www.wjgnet.com/1007-9327/full/v9/i4/701.htm
- DOI: https://dx.doi.org/10.3748/wjg.v9.i4.701


