Copyright
©The Author(s) 2003.
World J Gastroenterol. Mar 15, 2003; 9(3): 599-602
Published online Mar 15, 2003. doi: 10.3748/wjg.v9.i3.599
Published online Mar 15, 2003. doi: 10.3748/wjg.v9.i3.599
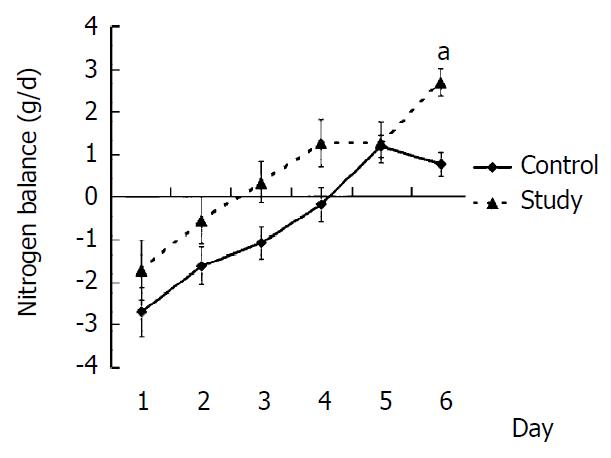
Figure 1 Nitrogen balance after infusion in two groups.
aP < 0.05 vs the control group.
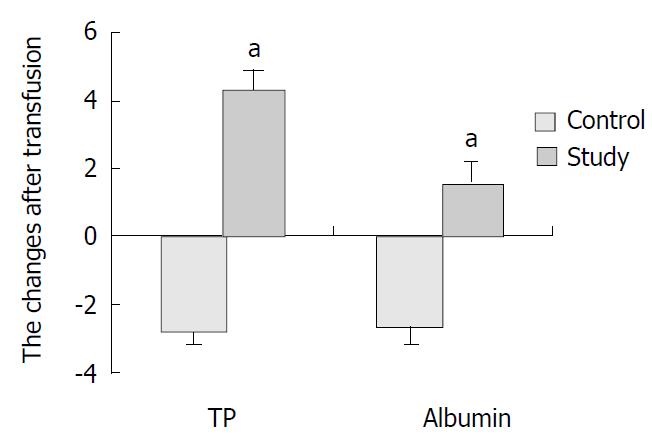
Figure 2 The changes of total protein and albumin after infusion in two groups.
aP < 0.05 vs the control group.
- Citation: Wang XY, Li N, Gu J, Li WQ, Li JS. The effects of the formula of amino acids enriched BCAA on nutritional support in traumatic patients. World J Gastroenterol 2003; 9(3): 599-602
- URL: https://www.wjgnet.com/1007-9327/full/v9/i3/599.htm
- DOI: https://dx.doi.org/10.3748/wjg.v9.i3.599


