Copyright
©The Author(s) 2003.
World J Gastroenterol. Mar 15, 2003; 9(3): 544-546
Published online Mar 15, 2003. doi: 10.3748/wjg.v9.i3.544
Published online Mar 15, 2003. doi: 10.3748/wjg.v9.i3.544
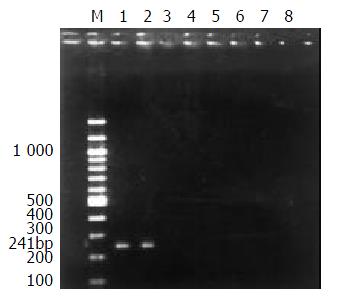
Figure 1 PCR signals of sry gene in experimental groups.
(M. 100 bp DNA marker; 1. Liver(M): liver of male rat as a positive control; 2. Liver(E): liver of female rat in experimental group; 3. Spleen(E): spleen of female rat in experimental group; 4. Kidney(E): kidney of female rat in experimental group; 5. Liver (C): liver of female rat in control group; 6. Spleen(C): spleen of female rat in control group; 7. Kidney(C): kidney of female rat in control group; 8. Liver(F): liver of female rat negative control).
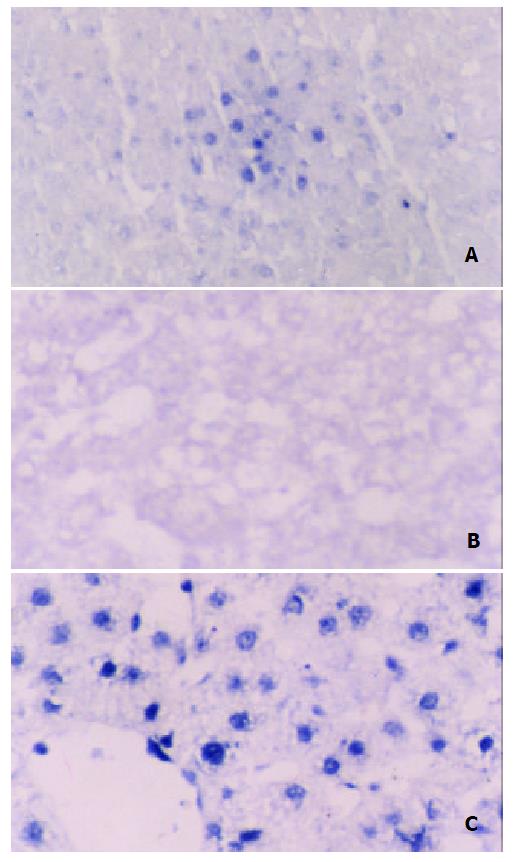
Figure 2 In situ hybridization assay of sry gene in liver.
A. Experimental group, Liver of female rat undergoing oval cell-transplanting. A cluster of cells with sry gene marker could be seen in the parenchyma of liver. B. Negative control group, liver of normal female rat. No hybridization signals could be seen. C. Positive control group, liver of normal male rat. Each cell with distinct hybridization signals.
- Citation: Chen JZ, Hong H, Xiang J, Xue L, Zhao GQ. A selective tropism of transfused oval cells for liver. World J Gastroenterol 2003; 9(3): 544-546
- URL: https://www.wjgnet.com/1007-9327/full/v9/i3/544.htm
- DOI: https://dx.doi.org/10.3748/wjg.v9.i3.544


