Copyright
©The Author(s) 2003.
World J Gastroenterol. Feb 15, 2003; 9(2): 258-261
Published online Feb 15, 2003. doi: 10.3748/wjg.v9.i2.258
Published online Feb 15, 2003. doi: 10.3748/wjg.v9.i2.258
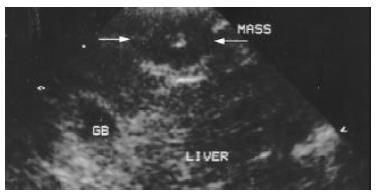
Figure 1 Image of VX2 tumor lesion under conventional B mode US.
Arrow indicates the VX2 tumor lesion at the anterior part of the right lobe. It is oval and hypoechoic with a small hyperechoic scar at the center of the lesion.
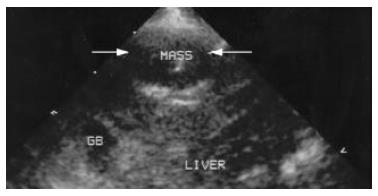
Figure 2 Image of VX2 tumor lesion under conventional second harmonic imaging.
Arrow indicates the same VX2 tumor lesion at the anterior part of the right lobe. The echogenicity of the lesion and the around liver parenchyma seem unchanged at all.
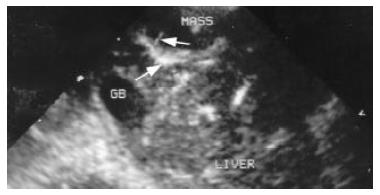
Figure 3 Contrast enhanced second harmonic image.
It shows the enhancement of the liver arteries in the parenchyma, arrows indicate the afferent artery and its branches.
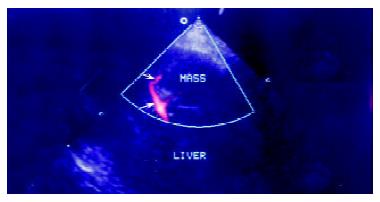
Figure 4 Conventional power Doppler image of the lesion.
Arrows indicate the clear afferent blood flow signals of the lesion and its branches.
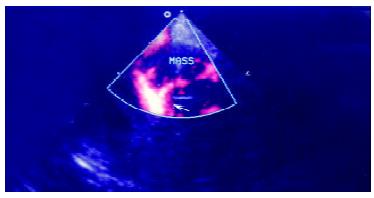
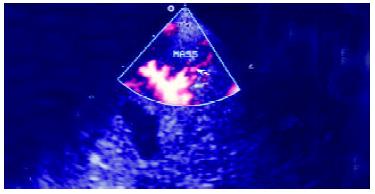
Figure 5 Contrast enhanced power Doppler image.
It shows the enhancement of the afferent arteries in the lesion, arrow indicates especially the pronounced blooming artifacts around the artery and its branches.
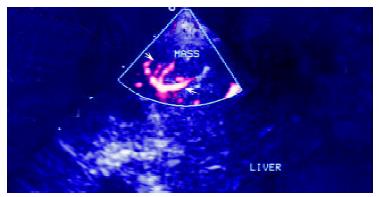
Figure 6 Contrast enhanced harmonic power Doppler image.
It shows the enhancement of the afferent arteries in the lesion, arrow indicates the newly appeared intralesional blood signals and less blooming artefacts around the artery and its branches.
Figure 7 Contrast enhanced harmonic power Doppler image at a later stage.
It shows the enhancement of the afferent arteries in the lesion, where intralesional blood signals and rare blooming artefacts are observable around the artery and its branches.
- Citation: Du WH, Yang WX, Wang X, Xiong XQ, Zhou Y, Li T. Vascularity of hepatic VX2 tumors of rabbits: Assessment with conventional power Doppler US and contrast enhanced harmonic power Doppler US. World J Gastroenterol 2003; 9(2): 258-261
- URL: https://www.wjgnet.com/1007-9327/full/v9/i2/258.htm
- DOI: https://dx.doi.org/10.3748/wjg.v9.i2.258


