Copyright
©The Author(s) 2003.
World J Gastroenterol. Dec 15, 2003; 9(12): 2791-2795
Published online Dec 15, 2003. doi: 10.3748/wjg.v9.i12.2791
Published online Dec 15, 2003. doi: 10.3748/wjg.v9.i12.2791
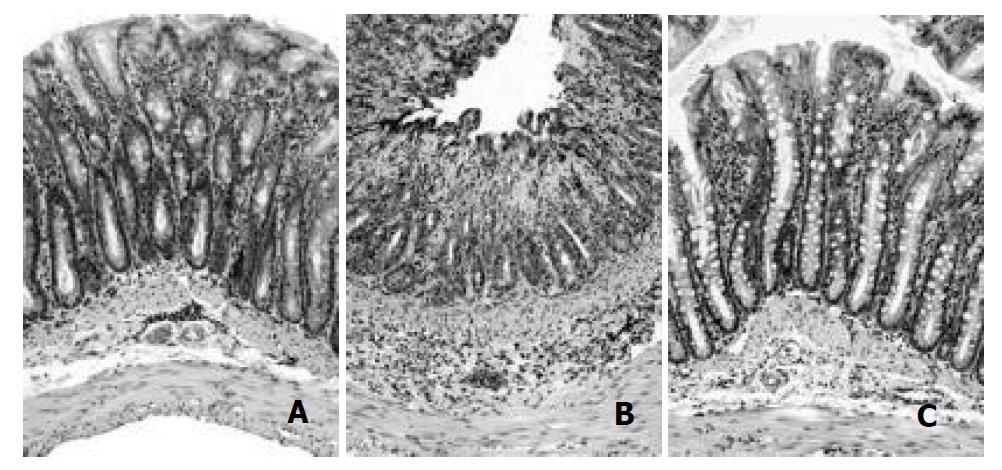
Figure 1 Photomicrographs of distal colons from control (A), at 2 days (B) and at 7 days (C) post-induction of colitis (PIC).
At 2 days PIC, histological inflammatory features including mucosal hemorrhage, submucosal edema, and inflammatory infiltration in the lamina propria and the submucosa were observed. At 7 days PIC, there was no remarkable inflammatory feature compared with control.
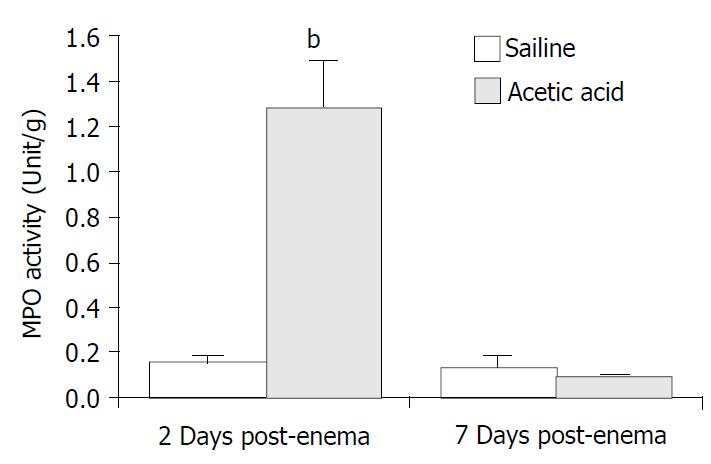
Figure 2 Tissue MPO activity at 2 and 7 days post-induction of colitis (PIC).
MPO activity was increased about 8-fold at 2 days PIC. No statistically significant difference was detected between the saline-instilled and the acetic acid-instilled groups at day 7. (bP < 0.01).
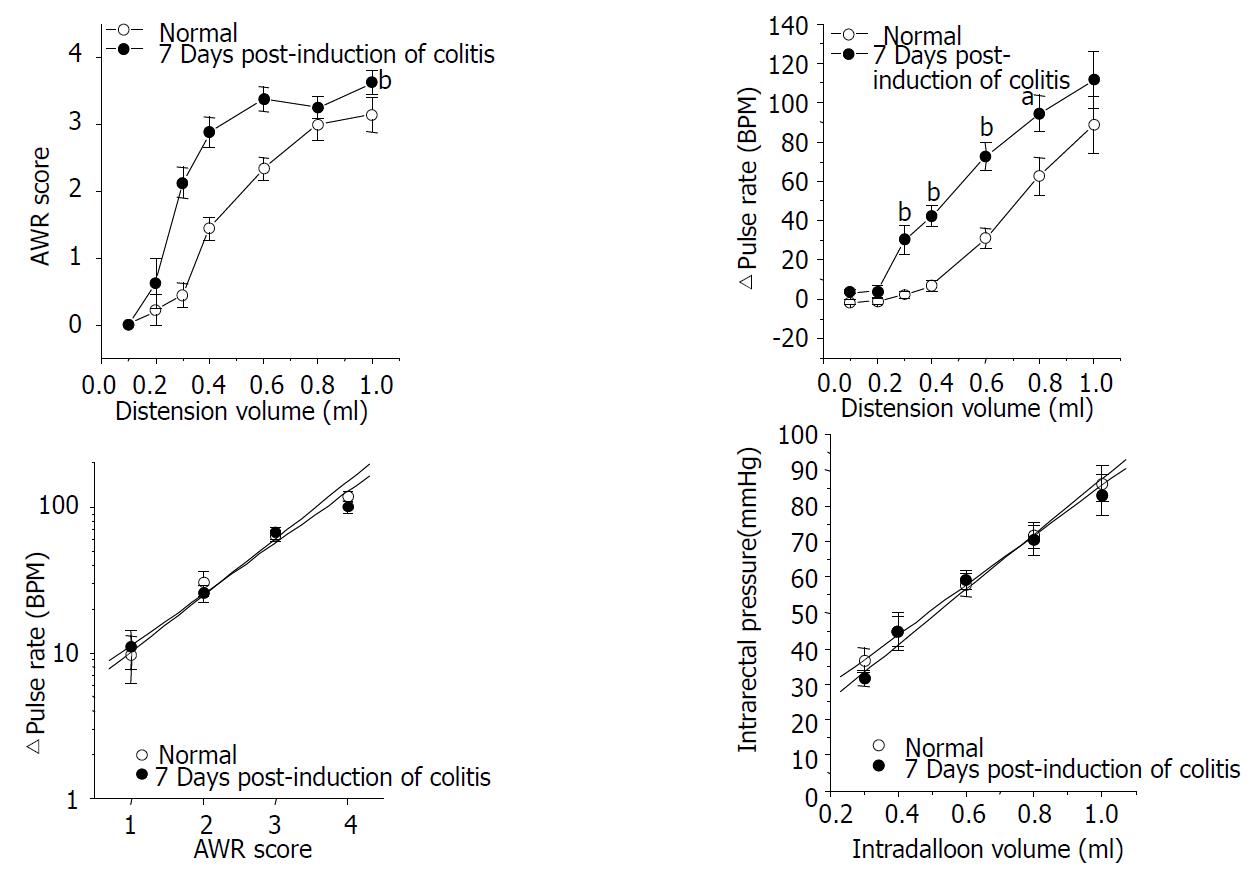
Figure 3 Summarized plots representing the rectal distension-induced AWR (A) and concomitant pulse rate change (B), the relationship between the AWR score and the extent of pulse rate change (C), and the relationship between intraballoon volume and intrarectal pressure (D) in each group.
At 7 days PIC, AWR and tachycardia were exaggerated in response to rectal distension. Note the good linear correlation between the AWR score and the logarithmic D pulse rate, which was not significantly different between groups. Intrarectal pressure was linearly increased as the balloon inflated, and the fitted functions of two groups were not significantly different from each other. (aP < 0.05, bP < 0.01).
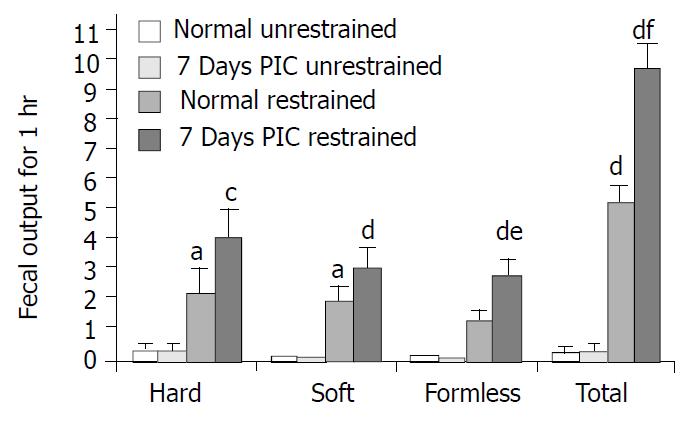
Figure 4 Restraint stress-induced defecation.
The number of formless stool and the total number of defecation during 1 h restraint stress in the 7 days PIC group were significantly larger than the corresponding values in control rats. (aP < 0.05 restrained vs. unrestrained in control; bP < 0.01; cP < 0.05 restrained vs. unrestrained in 7 days PIC group; dP < 0.01; eP < 0.05 restrained 7 days PIC group vs. restrained control group; fP < 0.01).
- Citation: La JH, Kim TW, Sung TS, Kang JW, Kim HJ, Yang IS. Visceral hypersensitivity and altered colonic motility after subsidence of inflammation in a rat model of colitis. World J Gastroenterol 2003; 9(12): 2791-2795
- URL: https://www.wjgnet.com/1007-9327/full/v9/i12/2791.htm
- DOI: https://dx.doi.org/10.3748/wjg.v9.i12.2791


