Copyright
©The Author(s) 2003.
World J Gastroenterol. Dec 15, 2003; 9(12): 2726-2731
Published online Dec 15, 2003. doi: 10.3748/wjg.v9.i12.2726
Published online Dec 15, 2003. doi: 10.3748/wjg.v9.i12.2726
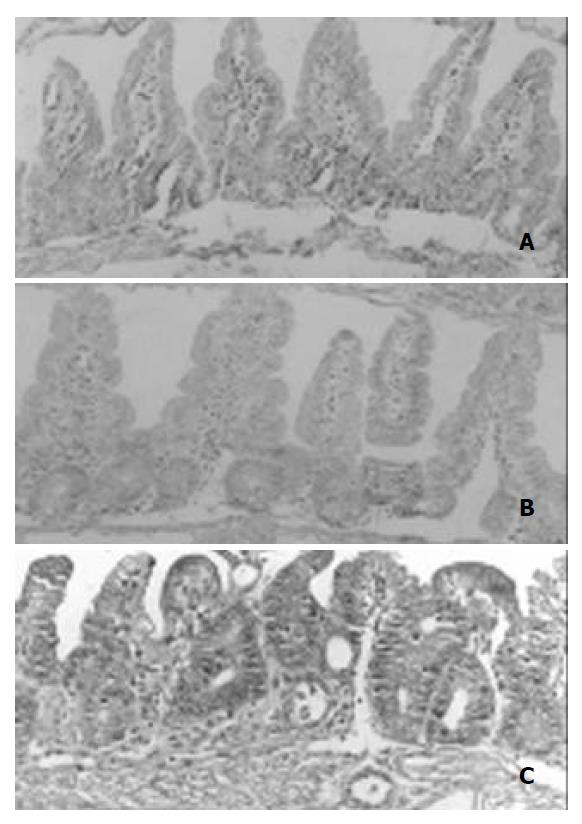
Figure 1 Histological changes in crypts following irradiation.
A: Unirradiated controls (×100). B: 3 hours after a single dose of 9.0 Gy (×100). Villi and crypts remained unchanged, but cell division of intestinal epithelia ceased. C: 3 days after a single dose of 9.0 Gy (×100).
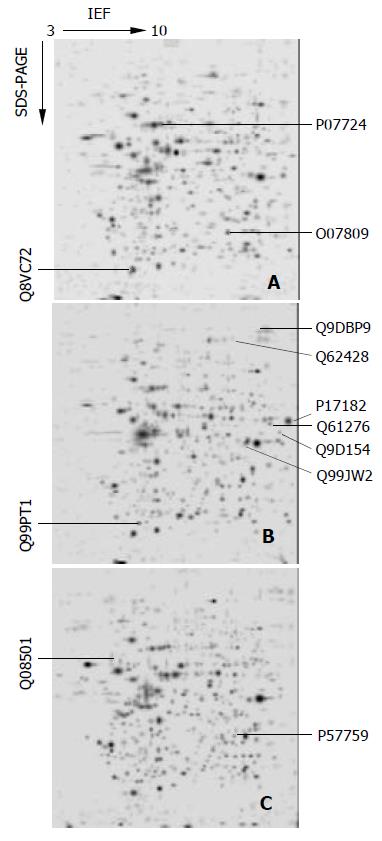
Figure 2 Two-dimensional electrophoresis maps.
A: normal intestinal epithelial cells, B: 3 h irradiated epithelial cells, C: 72 h post-radiation. Number indicated proteins were summarized in Table 2.
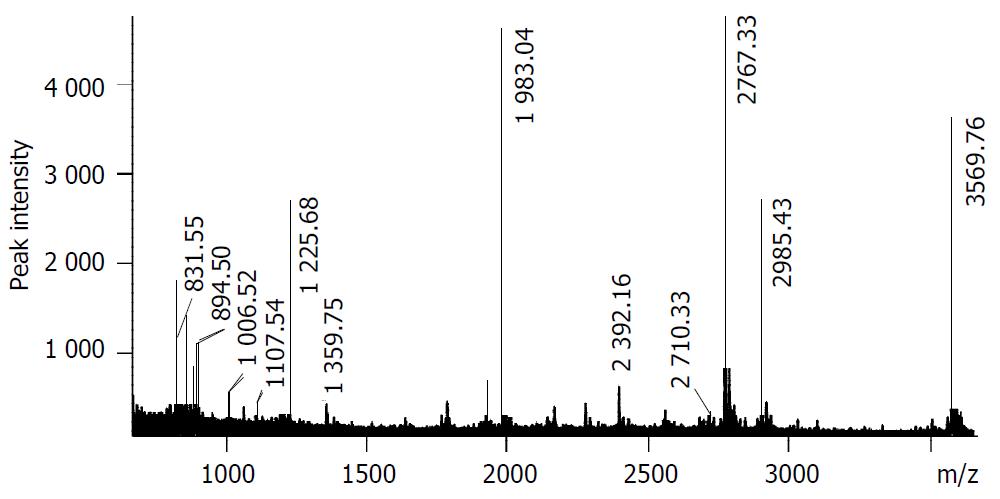
Figure 3 MALDI-TOF-MS spectrum of spot P35700 in 2-DE map.
MS spectrum of peptide mixture was obtained from a typical in-gel digestion of the 2-DE separated protein.
Figure 4 Western blot analysis of Enolase after radiation.
A: Protein samples, obtained at indicated time after radiation, were separated by SDS-PAGE, and immunoblotted with corresponding antibody. Equal amounts of total proteins were applied to each lane. B: Relative protein level of Enolase was determined by quantitating the intensity of Enolase bands with a densitometer.
Figure 5 Semi-quantitative RT-PCR analysis of peroxiredoxin I.
A: PCR product run on an agarose gel. The upper band repre-sented peroxiredoxin I (750 bp), and the lower band represented GAPDH (450 bp). B: Relative abundance of the mRNA of peroxiredoxin I was normalized by GAPDH.
Figure 6 Semi-quantitative RT-PCR analysis of Q8VC72.
RNA samples were prepared from mouse intestinal epithelia at indi-cated time. Left: The band represents Q8VC72 (461 bp). Right: The band represents GAPDH (450 bp). The expression of Q8VC72 remained unchanged after radiation.
- Citation: Zhang B, Su YP, Ai GP, Liu XH, Wang FC, Cheng TM. Differentially expressed proteins of gamma-ray irradiated mouse intestinal epithelial cells by two-dimensional electrophoresis and MALDI-TOF mass spectrometry. World J Gastroenterol 2003; 9(12): 2726-2731
- URL: https://www.wjgnet.com/1007-9327/full/v9/i12/2726.htm
- DOI: https://dx.doi.org/10.3748/wjg.v9.i12.2726


