Copyright
©The Author(s) 2003.
World J Gastroenterol. Oct 15, 2003; 9(10): 2149-2153
Published online Oct 15, 2003. doi: 10.3748/wjg.v9.i10.2149
Published online Oct 15, 2003. doi: 10.3748/wjg.v9.i10.2149
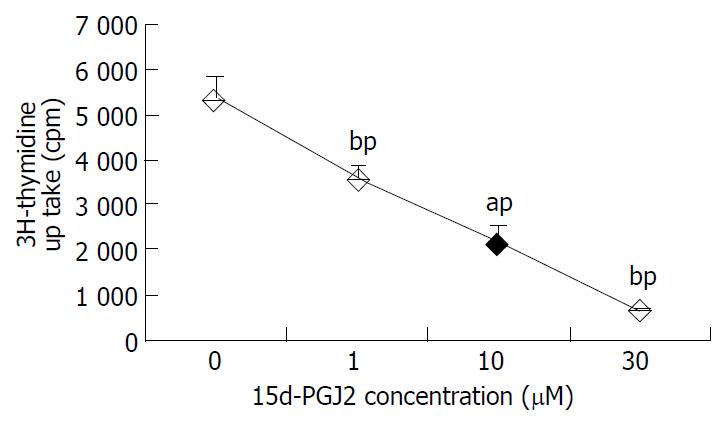
Figure 1 Effect of 15d-PGJ2 on cell growth by H3-TdR assay (48 h).
MCG-803 cells were incubated with various concentra-tions of 15d-PGJ2 for 48 h. The value is represented as mean ± SEM (n = 3). aP < 0.05, bP < 0.01 versus control group.
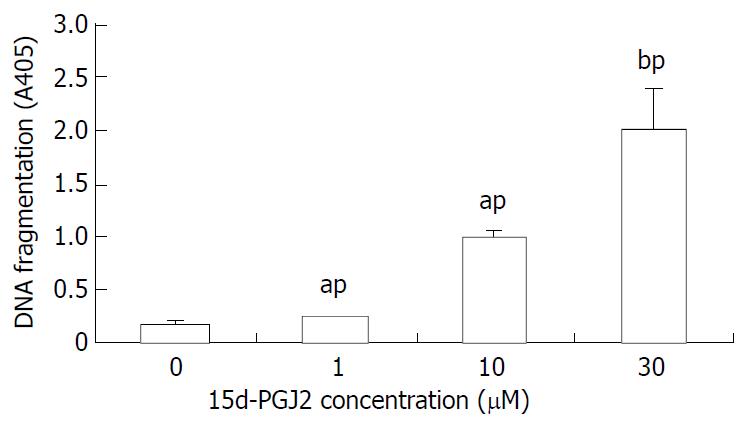
Figure 2 Effect of 15d-PGJ2 on DNA fragmentation in MCG-803 cells.
Cytoplasmic histone-associated DNA fragments were determined using a commercial ELISA kit. Culture of MCG-803 cells for 24 h in the presence of 15d-PGJ2 resulted in dose dependent DNA fragmentation. aP < 0.05, bP < 0.01 compared with the controls. The value is represented as mean ± SEM (n = 3).
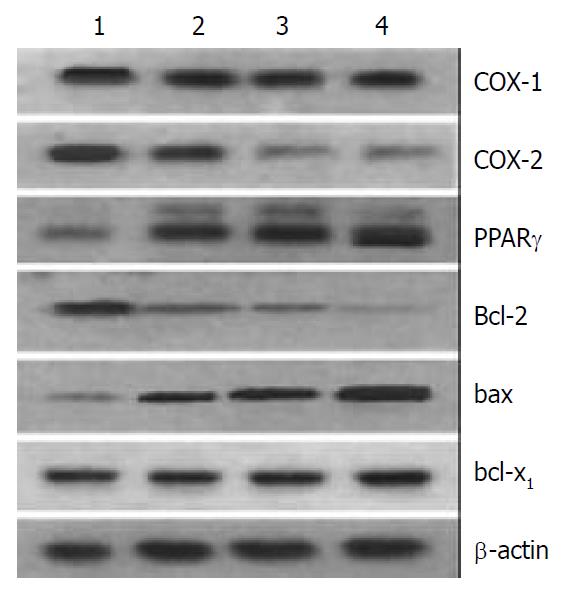
Figure 3 COX-1, COX-2, PPARγ, bcl-2, bax, and bcl-XL pro-tein levels in MCG-803 cells treated with 15d-PGJ2.
Cell ly-sates were collected and processed at 6 h. The whole cellular protein was electrophoresed in SDS-PAGE gel. Western blot was performed using antibodies against COX-1, COX-2, PPARγ, bcl-2, bax, bcl-XL. β-actin was used as a lane-loading control. (1) control, (2) 1 μM, (3) 10 μM, (4) 30 μM.
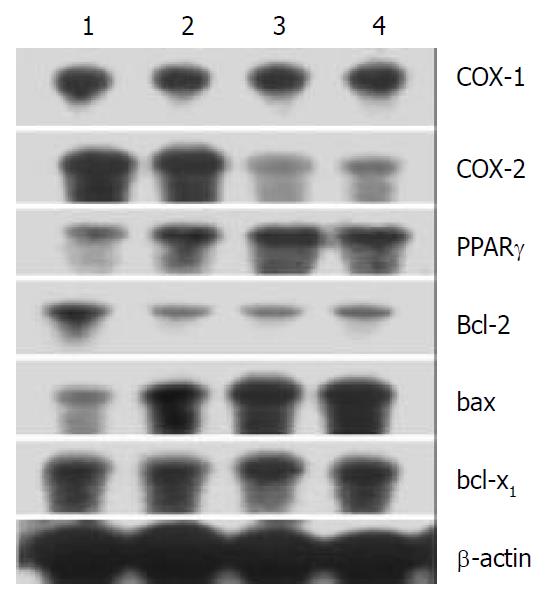
Figure 4 COX-1, COX-2, PPAR-γ, bcl-2, bax, bcl-XLmRNA levels in MCG-803 cells treated with 15d-PGJ2 for 6 h by North-ern blot.
(1) control, (2) 1 μM, (3) 10 μM, (4) 30 μM.
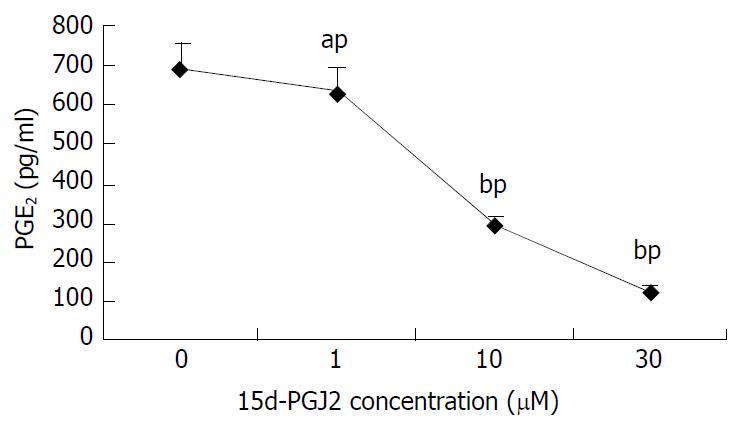
Figure 5 Effect of 15d-PGJ2 on PGE2 production by RIA (24 h).
MCG-803 cells were incubated at various concentrations of 15d-PGJ2 for 24 h. The value is represented as mean ± SEM (n = 3). aP < 0.05 and, bP < 0.01 versus corresponding control groups.
- Citation: Chen YX, Zhong XY, Qin YF, Bing W, He LZ. 15d-PGJ2 inhibits cell growth and induces apoptosis of MCG-803 human gastric cancer cell line. World J Gastroenterol 2003; 9(10): 2149-2153
- URL: https://www.wjgnet.com/1007-9327/full/v9/i10/2149.htm
- DOI: https://dx.doi.org/10.3748/wjg.v9.i10.2149


