Copyright
©The Author(s) 2003.
World J Gastroenterol. Jan 15, 2003; 9(1): 84-88
Published online Jan 15, 2003. doi: 10.3748/wjg.v9.i1.84
Published online Jan 15, 2003. doi: 10.3748/wjg.v9.i1.84
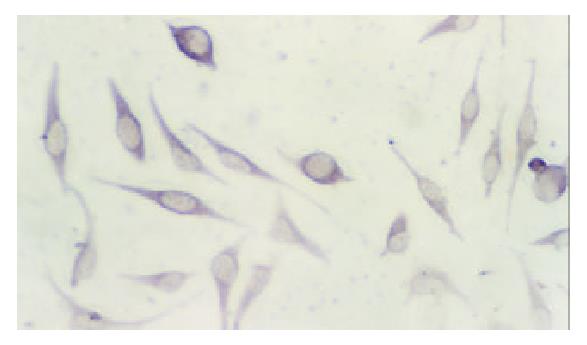
Figure 1 SNU-449 cells show negative p16 staining (original magnification × 400).
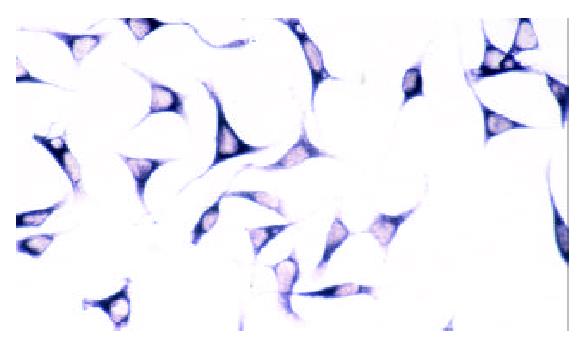
Figure 2 SNU-449/pCLXSN-p16 cells show positive p16 staining (original magnification × 200).
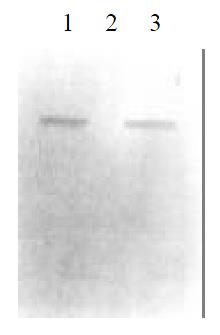
Figure 3 Western blot analysis.
Lanes 1 and 3: SNU-449/pCLXSN-p16 cells; Lane 2: SNU-449 cells.
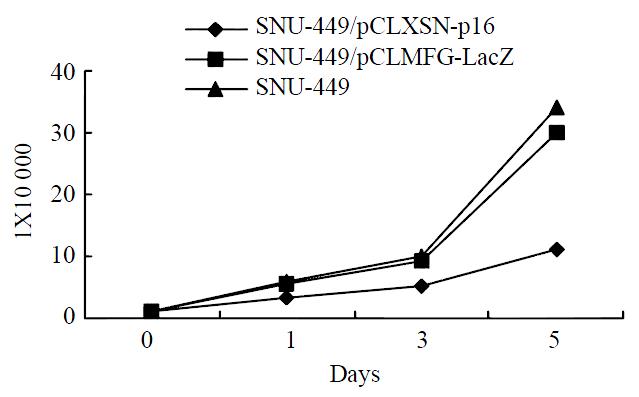
Figure 4 In vitro growth curves of SNU-449/pCLXSN-p16, SNU-449/pCLMFG-LacZ and SNU-449 cell lines.
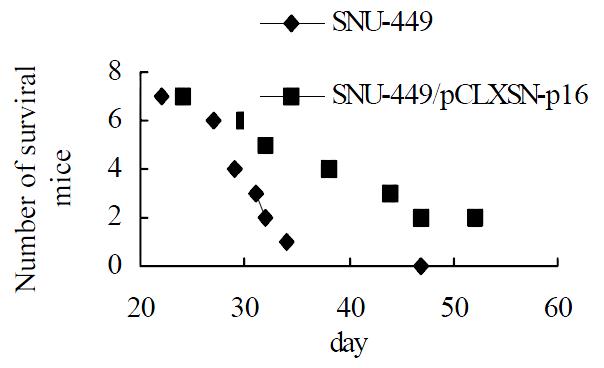
Figure 5 Survival curves of nude mice.
- Citation: Huang JZ, Xia SS, Ye QF, Jiang HY, Chen ZH. Effects of p16 gene on biological behavious in hepatocellular carcimoma cells. World J Gastroenterol 2003; 9(1): 84-88
- URL: https://www.wjgnet.com/1007-9327/full/v9/i1/84.htm
- DOI: https://dx.doi.org/10.3748/wjg.v9.i1.84


