Copyright
©The Author(s) 2003.
World J Gastroenterol. Jan 15, 2003; 9(1): 59-64
Published online Jan 15, 2003. doi: 10.3748/wjg.v9.i1.59
Published online Jan 15, 2003. doi: 10.3748/wjg.v9.i1.59
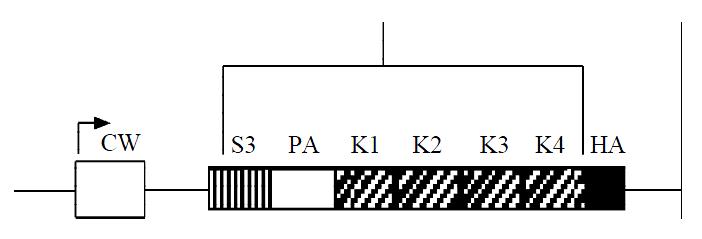
Figure 1 Schematic diagram of angiostatin cDNA fragment.
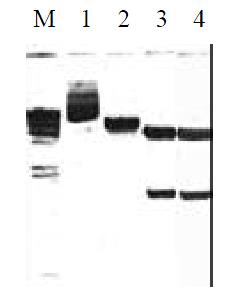
Figure 2 Identification of angiostatin cDNA insertion in pcDNA3.
1(+)-angio. M: λdsDNA/HindIII marker; 1: pcDNA3.1(+)-angio/HindIII; 2: pcDNA3.1(+)-angio; 3: pcDNA3.1(+)-angio/HindIII+XbaI; 4: pcDNa3.1(+)-angio/BamHI.
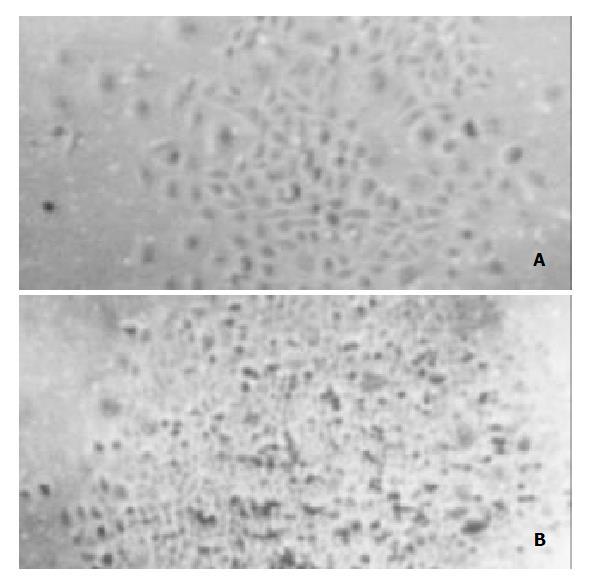
Figure 3 Cell clones transfected with pcDNA3.
1(+)-angio and pcDNA3.1(+) respectively. A: Cell clone pcDNA3.1(+)-angio transfected; B: Cell clone pcDNA3.1(+) transfected.
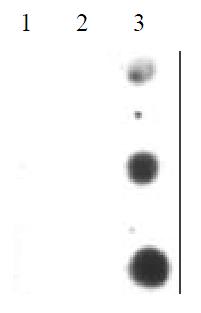
Figure 4 Angiostatin mRNA expression by Dot Blot analysis.
1: SGC7901; 2: SGC7901(+); 3:SGC7901-pcDNA3.1(+)-angio.
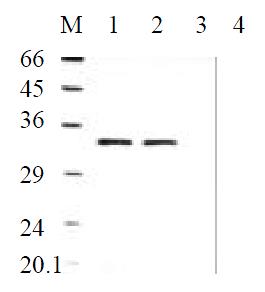
Figure 5 Angiostatin protein expression by Western Blot analysis.
M: Marker; 1: SGC7901pcDNA3.1(+)-angio; 2: SGC7901pcDNA3.1(+)-angio; 3: SGC7901pcDNA3.1(+); 4: SGC7901.
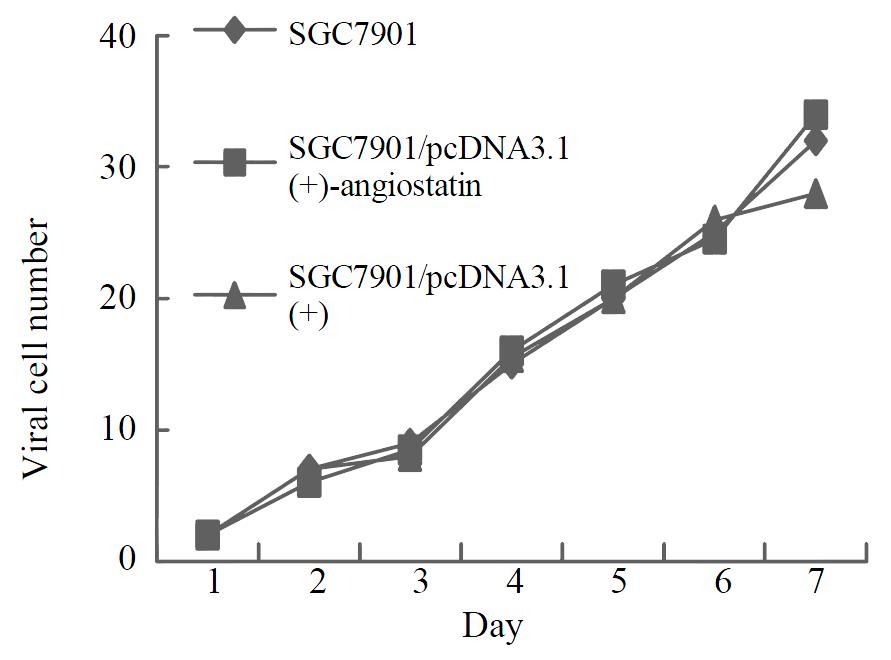
Figure 6 Cell growth curves.
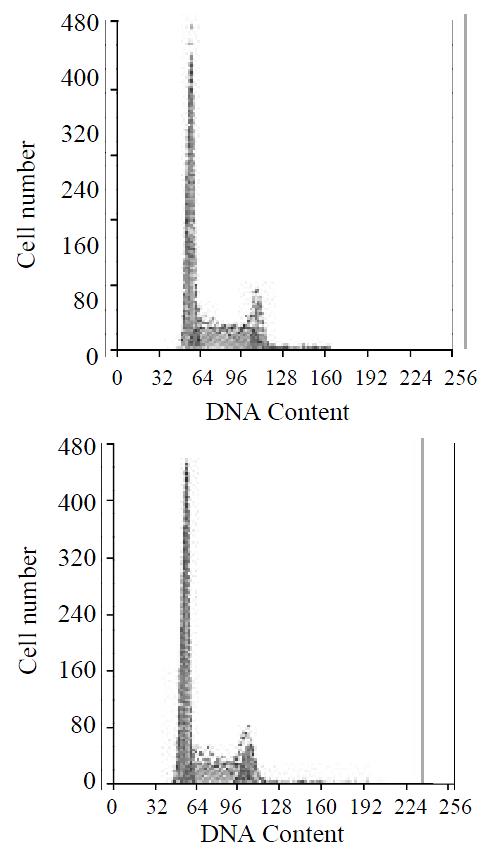
Figure 7 Cell cycle distributions by FACS analysis.
A: SGC7901 transfected with pcDNA3.1(+)-angio; B: SGC7901.
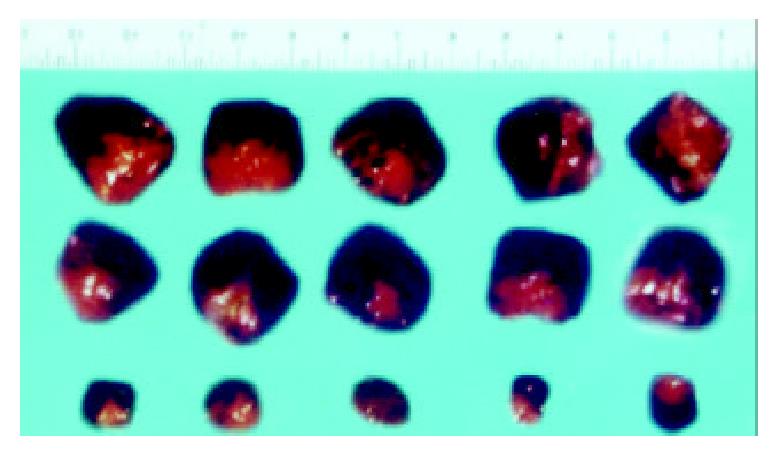
Figure 8 Tumors formed in nude mice by SGC7901/pcDNA-angio, SGC7901/pcDNA, and SGC7901 cells (n = 5).
A:SGC7901; B: SGC7901/pcDNA3.1(+); C: SGC7901/pcDNA3.1(+)-angio.
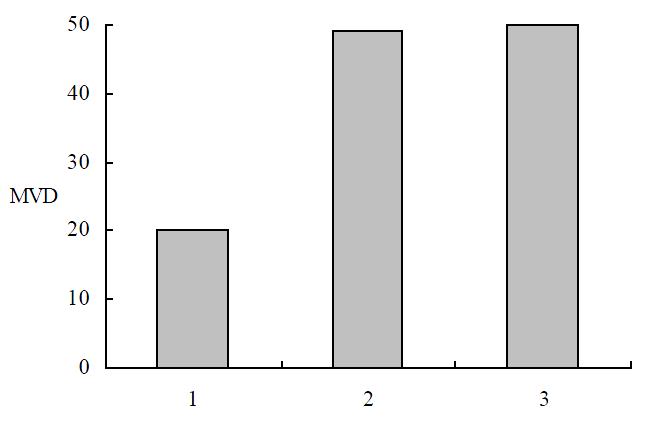
Figure 9 MVD in immunochemistry staining.
1: SGC7901/pcDNA-angio; 2: SGC7901/pcDNA; 3: SGC7901.
- Citation: Wu J, Shi YQ, Wu KC, Zhang DX, Yang JH, Fan DM. Angiostatin up-regulation in gastric cancer cell SGC7901 inhibits tumorigenesis in nude mice. World J Gastroenterol 2003; 9(1): 59-64
- URL: https://www.wjgnet.com/1007-9327/full/v9/i1/59.htm
- DOI: https://dx.doi.org/10.3748/wjg.v9.i1.59


