Copyright
©The Author(s) 2003.
World J Gastroenterol. Jan 15, 2003; 9(1): 30-34
Published online Jan 15, 2003. doi: 10.3748/wjg.v9.i1.30
Published online Jan 15, 2003. doi: 10.3748/wjg.v9.i1.30
Figure 1 Differential analysis of expressed genes among human gastric cancer, paratumor and normal stomach mucosal tissues by means of fluorescent differential display.
The differentially expressed cDNA fragment W2 (arrowed) showed higher expression in tumor and paratumor tissues than that in normal ones. N: normal; P: paratumor; T: tumor; 1-7: patient number.
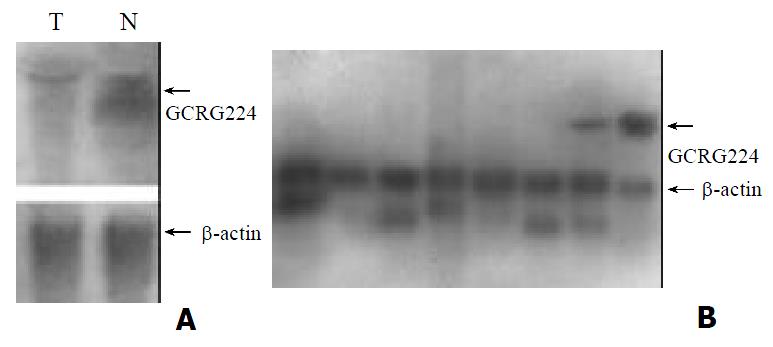
Figure 2 Northern blot analysis of GCRG224 expression in (A) human gastric cancer T/N pairs.
T: tumor, N: non-tumor. (B) various adult human tissues. From left to right: spleen, thymus, prostate, testis, ovary, small intestine, colon, peripheral blood leukocyte.
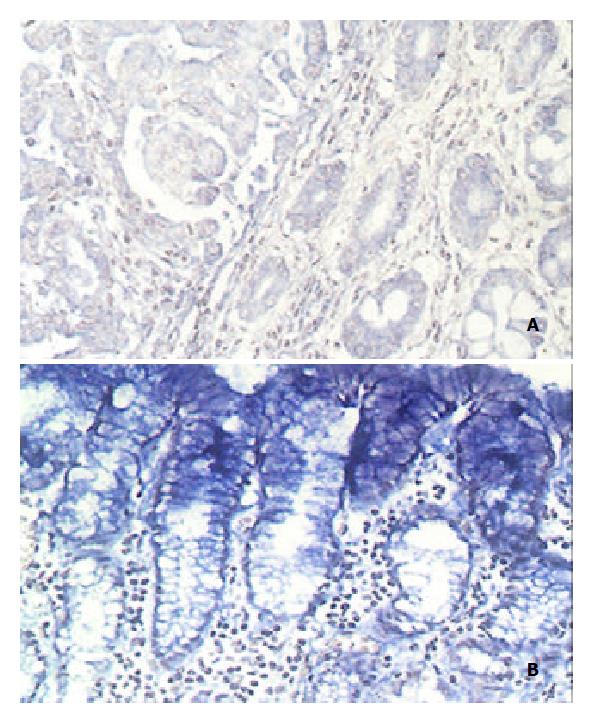
Figure 3 ISH analysis of GCRG224-ORF mRNA in formaldehyde-fixed, paraffin-embedded gastric tissues with a digoxigenin-labeled anti-sense probe, NBT/BCIP was used as alkaline phosphatase substrates, the expression appeared as cytoplasmic staining (blue precipitates).
(A): Mild expression in tumor (left) and intestinal metaplasia glands (right) (200 ×); (B): Strong expression in gastric mucosal epithelium cells, while the adjacent normal gastric glands showed little staining (200 ×).
- Citation: Wang GS, Wang MW, Wu BY, You WD, Yang XY. A novel gene, GCRG224, is differentially expressed in human gastric mucosa. World J Gastroenterol 2003; 9(1): 30-34
- URL: https://www.wjgnet.com/1007-9327/full/v9/i1/30.htm
- DOI: https://dx.doi.org/10.3748/wjg.v9.i1.30


