Copyright
©The Author(s) 2002.
World J Gastroenterol. Dec 15, 2002; 8(6): 1029-1034
Published online Dec 15, 2002. doi: 10.3748/wjg.v8.i6.1029
Published online Dec 15, 2002. doi: 10.3748/wjg.v8.i6.1029
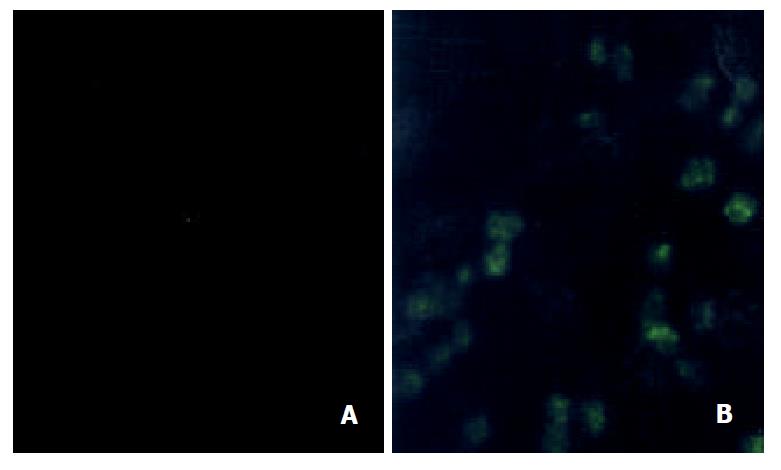
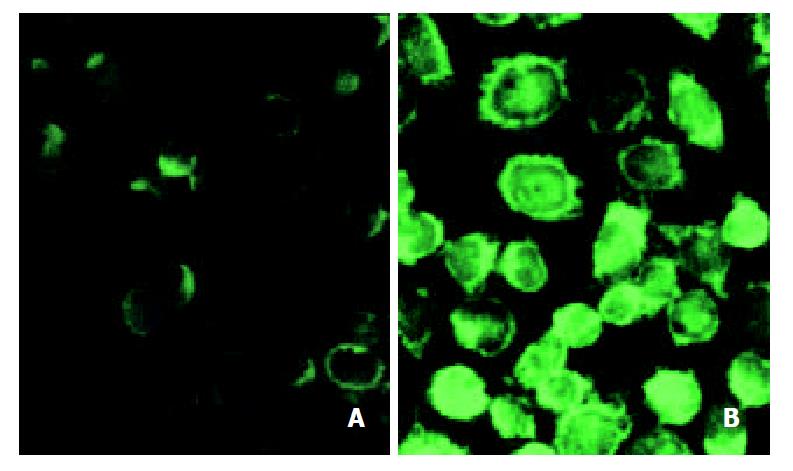
Figure 1 Immunocytochemical detection of MRP in Bel7402 and its 5-FU resistant cells in cytoprep slides.
(A) Bel7402 cells; (B) Bel7402/5-FU cells. The cells were fixed in 70% methanol, and incubated with anti-MRP monoclonal antibody MRPr-1 for 1 hr at room temperature. FITC-conjugated goat anti-mouse IgG was added to examine the fluorescence staining ofMRP under confocal laser scanning microscope.
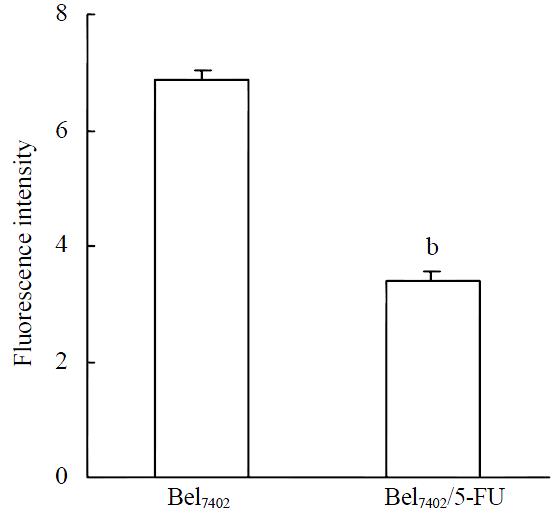
Figure 2 FLU accumulation in Bel7402 and Bel7402/5-FU cells.
The cells were incubated with 100 μmol·L-1 FLU for 3hr. After washing, the cells were trypsinized and intracellular fluorescence of FLU was determined with a flow cytometer. Data were pooled from three independent experiments. bP < 0.001 vs Bel7402 cells
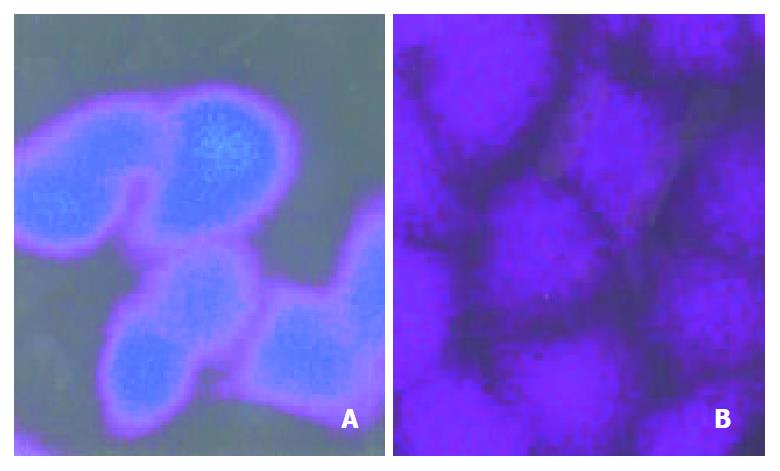
Figure 3 FLU distribution in Bel7402 and Bel7402/5-FU cells.
The cells were incubated with 100 μmol·L-1 FLU for 3 hr. Then the intracellular distribution of FLU was revealed by confocal la-ser scanning microscopy. (A) Bel7402 cells; (B) Bel7402/5-FU cells.
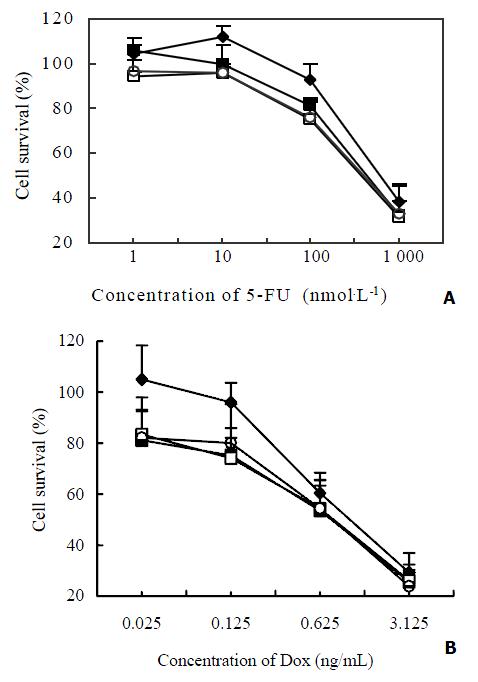
Figure 4 Effect of BSO on the cytotoxicity of 5-FU and Dox to Bel7402/5-FU cells.
The cells were incubated with different con-centrations of 5-FU (Figure 4A) or Dox (Figure 4B) in the ab-sence (◆) or presence of BSO at the concentration of 5 μmol·L-1 (□), 50 μmol·L-1 (○) and 100 μmol·L-1 (■) respectively for 72 hr. Cell survival was determined by MTT assay. The values represent the means ± SD of three experiments.
Figure 5 Immunocytochemical analysis of TS from parental and 5-FU resistant Bel7402 cells.
The cytoprep slides were made as described in “Methods”. The slides were fixed in acetone, incubated with TS 106 and stained by using FITC-conjugated goat anti-mouse IgG. TS expression was determined by con-focal laser scanning microscopy. (A) Bel7402 cells; (B) Bel7402/ 5-FU cells.
- Citation: Jin J, Huang M, Wei HL, Liu GT. Mechanism of 5-fluorouracil required resistance in human hepatocellular carcinoma cell line Bel7402. World J Gastroenterol 2002; 8(6): 1029-1034
- URL: https://www.wjgnet.com/1007-9327/full/v8/i6/1029.htm
- DOI: https://dx.doi.org/10.3748/wjg.v8.i6.1029


