Copyright
©The Author(s) 2002.
World J Gastroenterol. Aug 15, 2002; 8(4): 718-723
Published online Aug 15, 2002. doi: 10.3748/wjg.v8.i4.718
Published online Aug 15, 2002. doi: 10.3748/wjg.v8.i4.718
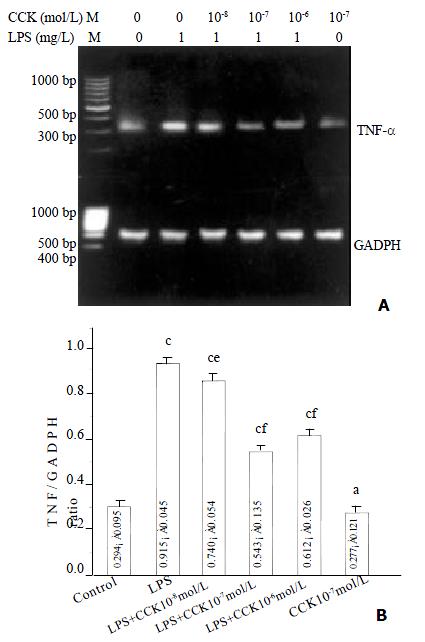
Figure 1 sCCK-8 inhibited LPS-induced TNF-α mRNA expression in PIMs in a dose-dependent manner.
A: Representative pictures of three experiments of RT-PCR. B: Relative level of TNF-α mRNA expression. n = 3, ¯x ± s, aP > 0.05, cP < 0.01 vs control, eP < 0.05, fP < 0.01 vs LPS.
Figure 2 sCCK-8 inhibited LPS-induced NF-κB binding in PIMs in a dose-dependent manner through CCK receptor.
A: Representative autoradiography picture of three experiments of EMSA. Lane 1, negative control; lane 2, positive control; lane 3, 32P-labeled NF-κB Oligo plus unlabeled NF-κB Oligo (competitor); lane 4, 32P-labeled NF-κB Oligo plus unlabeled AP-2 Oligo (noncompetitor); lane 5, control; lane 6, LPS; lane 7, LPS + CCK 10-8 mol·L-1; lane 8, LPS + CCK 10-7 mol·L-1; lane 9, LPS + CCK 10-6 mol·L-1; lane 10, LPS + CCK + proglumide; lane 11, CCK 10-7 mol·L-1. B: Densitometry of EMSA showing decreased NF-κB binding in PIMs treated with sCCK-8. n = 3, ¯x ± s, aP > 0.05, cP < 0.01 vs control; eP < 0.05, fP < 0.01 vs LPS; iP < 0.01 vs LPS + CCK 10-7 mol·L-1.
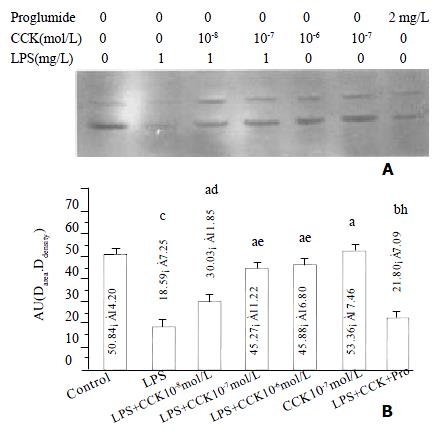
Figure 3 sCCK-8 increased IκB α protein level at 30 min after LPS stimulation in a dose-dependent manner in PIMs.
A: Representative Western blot of three experiments. B: Normalized total protein of IκBα immunoreactivity. n = 3, ¯x ± s, aP > 0.05, bP < 0.05, cP < 0.01 vs control; dP > 0.05, eP < 0.05, fP < 0.01 vs LPS; hP < 0.05 vs LPS + CCK 10-7 mol·L-1.
- Citation: Cong B, Li SJ, Yao YX, Zhu GJ, Ling YL. Effect of cholecystokinin octapeptide on tumor necrosis factor α transcription and nuclear factor-κB activity induced by lipopolysaccharide in rat pulmonary interstitial macrophages. World J Gastroenterol 2002; 8(4): 718-723
- URL: https://www.wjgnet.com/1007-9327/full/v8/i4/718.htm
- DOI: https://dx.doi.org/10.3748/wjg.v8.i4.718


